Large nonlinear Kerr effect in graphene
Abstract
Under strong laser illumination, few-layer graphene exhibits both a transmittance increase due to saturable absorption and a nonlinear phase shift. Here, we unambiguously distinguish these two nonlinear optical effects and identify both real and imaginary parts of the complex nonlinear refractive index of graphene. We show that graphene possesses a giant nonlinear refractive index , almost nine orders of magnitude larger than bulk dielectrics. We find that the nonlinear refractive index decreases with increasing excitation flux but slower than the absorption. This suggests that graphene may be a very promising nonlinear medium, paving the way for graphene-based nonlinear photonics.
1OPERA-photonics, Université libre de Bruxelles, 50 Av. F. D. Roosevelt, CP 194/5, B-1050 Bruxelles, Belgium
2Engineering Physics Department, École polytechnique de Montréal, P.O. Box 6079, Station Centre-ville,
Montréal (Québec), H3C 3A7 Canada
3Department of Chemistry, National University of Singapore, 3 Science Drive 3, Singapore 117543
4Laboratoire d’information quantique, CP 225, Université libre de Bruxelles,
50 Av. F. D. Roosevelt, B-1050 Bruxelles, Belgium
∗Corresponding author: hzhang@ulb.ac.be, smassar@ulb.ac.be
160.4330, 160.4236, 190.3270, 190.7110.
Graphene, a single sheet of carbon in a hexagonal lattice, exhibits many interesting electrical and optical properties [1, 2] which arise due to its particular bandgap structure , where the sign corresponds to electron (respectively hole) band, is the quasi-momentum, and V is the Fermi velocity. In particular, a single graphene layer absorbs a fraction of the incident light across the infrared and visible range, where is the fine structure constant [3].
Graphene also has a broadband ultra-fast saturable absorption [4, 5, 6, 7], due to valence band depletion and conductance band filling. This saturable absorption has been used, amongst other applications, for laser mode locking [4, 7].
The massless bandgap structure of graphene has led to the prediction of other strong nonlinear optical effects, including frequency multiplication [8, 9] and frequency mixing [10]. Recently, broadband four-wave mixing in few-layer graphene samples has been reported [11]. This allowed the determination of the absolute value of the third order susceptibility of a single graphene layer esu, approximately eight orders of magnitude larger than in bulk dielectrics. Four-wave mixing in graphene deposited on optical ferrules has also been observed [12].
To our knowledge, there has so far not been any measurement that unambiguously discriminates between the real and imaginary part of the third order susceptibility of graphene. We report herein the experimental measurement of the nonlinear optical refractive index of loosely stacked few-layer graphene using Z-scan technique. As demonstrated in [13], the knowledge of this coefficient together with the nonlinear absorption is sufficient to calculate the complex value of .
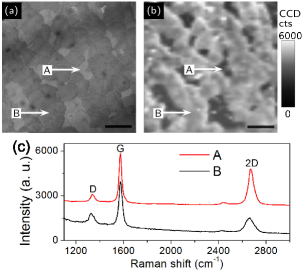
Samples of graphene were prepared as follows: a few-layer graphene thin film was grown on 25 m thick Cu foils by chemical vapor deposition (CVD) [14]. The copper was etched with ammonium persulfate (0.1 M). After thorough rinsing in distilled water, the floating graphene film was fished by quartz substrate and dried gently in nitrogen gas. The optical image of a typical graphene sample is shown in Fig. 1 (a). The non-uniform color contrast of the optical micrograph indicates that the film has a variable thickness, i.e., the dark contrast zones correspond to thicker graphene domains whereas the faint contrast zones correspond to thinner graphene domains. This is further confirmed by the Raman map of the G band, as shown in Fig. 1 (b), in which bright zones have larger G band intensity, indicating more graphene layers. Raman spectra given in Fig. 1 (c) are captured from marked spots in Fig. 1 (a), (b), with zone A bilayer and zone B 4-layer graphene. The thickness can be unambiguously identified by optical contrast (not shown) on optical transmission measurements.Different graphene samples, with respectively 1, 2, 3, 4, and 6 layers were used in the experiments reported below. The fabrication process produces loosely stacked graphene layers wherein the optical properties are expected to arise from the cumulative contribution of each layer.
We measured the real and imaginary parts of the complex nonlinear refractive index by using the Z-scan technique [15]. Our experimental setup has been used previously in [16], but has been adapted to the small thickness of the sample. The sample is subjected to picosecond pulses emitted from a Pritel picosecond laser with center wavelength 1550 nm, pulse duration 3.8 ps (full width at half maximum), 3-dB spectral width 1.2 nm and repetition rate 10 MHz. These pulses are amplified through a Keopsys erbium-doped fiber amplifier. After out-coupling from the fiber, shaping and routing the beam through the focusing objective, the average power of the pulse train can be adjusted between 0 and 4.5 mW. From the laser parameters, the peak pulse power can therefore be adjusted from 0 to 118 W. The beam is focused using a 20 microscope objective, generating a beam waist of 3 m, corresponding to illuminations ranging up to a peak intensity of . The beam waist was measured by the beam profiler and further confirmed by z-scan parameter fitting. The graphene sample and its quartz substrate are oriented perpendicularly to the beam axis and translated along the axis through the focus with a linear motorized stage. A portion of the amplifier output is picked off and measured to monitor the optical power level continuously.
Measurements are performed in two regimes, an open-aperture regime wherein all the light transmitted through the sample is collected on a photo-detector and a closed-aperture regime where only an on-axis portion of the diffracted beam is collected. The open-aperture regime enables the characterization of the intensity-dependent absorption. A typical trace when the sample is translated through the beam focus is shown in Fig. 2 (a). The peak in transmission when the sample passes through the focus is characteristic of saturable absorption. The sample’s linear absorption almost completely vanishes for illuminations greater than 0.6 . Note that the wings visible in Fig. 2 (a) present an unusual slope which may arise from the sample’s inhomogeneity. Its presence does not affect our conclusions.
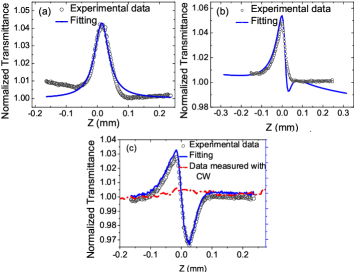
A typical closed aperture measurement is shown in Fig. 2 (b). In this trace the effect of the nonlinear phase is of the same order of magnitude as the effect of saturable absorption. In order to isolate the former, we divide the curve in Fig. 2 (b) by the curve in Fig. 2 (a), thereby obtaining the curve in Fig. 2 (c). The latter has the typical shape of a Z-scan trace. The up-down curve implies a small positive on-axis phase shift . For small , one can fit the curve with the function where is the normalized distance from the focus and is the Rayleigh length. The above method for deriving from the measured data is applicable when the distortion of the phase front is small and the closed aperture is sufficiently narrow [15]. We also performed a full calculation of local nonlinear effects across the graphene layer and its subsequent propagation, and then fitted Fig. 2 (b) directly. Both approaches provide comparable results. Additional measurements carried out in cw regime with similar average power as in the pulsed regime ( mW) show that our Z-scan measurements are not affected by cumulative thermal effects (see Fig. 2(c)). This is presumably due to the very high thermal diffusion coefficient of graphene.
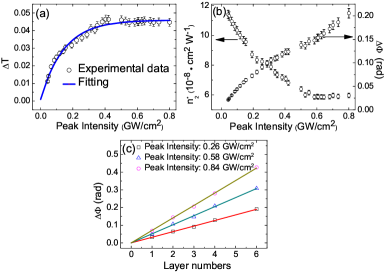
Z-scan measurements under variable optical power were performed. Closed-aperture measurement results show that the transmittance difference , which is the difference between the peak and the background in Fig. 2 (a), has a power dependence characteristic of saturable absorption. We fitted the transmittance difference by , see Fig. 3 (a), yielding the estimate , which is of the same order of magnitude as the value reported in [17], but an order of magnitude smaller than the values reported in [5]. From this value of , we can calculate the nonlinear absorption coefficient that appears in [13]. The maximum transmittance difference for 3-layer graphene is , indicating almost complete saturation of the absorption. Measurement of the maximal transmittance difference shows that it scales linearly with the number of layers (not shown).
The nonlinear phase is plotted on Fig. 3 (b), with respect to the input power. The Kerr refractive index can be deduced from the slope of this curve at low intensities, using where and is the sample thickness, assumed equal to 1 nm. A value of is obtained, which is approximately times larger than that of bulk dielectrics. When the intensity is increased, starting from , the change in the nonlinear phase saturates. In this high intensity regime, the exact modelling of the nonlinear response requires to take into account and higher order odd terms, such as However, from the experimental data, an effective nonlinear index can be defined by . One sees that decreases with increasing , and then reaches a constant value for . We also measured the nonlinear phase as a function of the number of graphene layers and found that at fixed powerit scales linearly with the number of layers, see Fig. 3 (c). The real part of the complex nonlinear refractive index of loosely stacked graphene is found to be independent of the number of layers.
Note that the value of based on four-wave mixing experiments reported in [11] corresponds to an equivalent of , which is forty times smaller than our value. We attribute this discrepancy to the fact that the third order susceptibility of graphene probably has multiple origins. The parametric process of four wave mixing measured in [11] arises from the coherent electronic response and the massless bandgap structure of graphene, as explained in Refs. \citenMikhailov2006,Mikhailov2008,Mikhailov2011. In addition there is a strong non-parametric process that gives rise to saturable absorption, and which presumably also gives rise to a strong non-parametric contribution to . For a general discussion of these processes, see [18, p. 13] The Z-scan measurements reported here measure the sum of all contributions to .
In conclusion, the characterization of the nonlinear optical properties of loosely stacked graphene was performed on a Z-scan setup. Measurements of the saturable absorption are in agreeement with previously reported values. Measurements of the nonlinear phase yield a nonlinear coefficient , where is defined in [13]. The measured value of the effective nonlinear refractive index decreases with increasing input power. Interestingly it remains large when the absorption is saturated. This suggests that at high power () the figure of merit of graphene for nonlinear optics applications may be highly favorable (high nonlinear phase, low absorption per layer).
This work is funded by the Belgian Science Policy Office (BELSPO) Interuniversity Attraction Pole (IAP) programme under grant no. IAP-6/10 (HZ, SM, PK), by the LKY Postdoctoral Fellowship (QLB), by the NRF-CRP Graphene Related Materials and Devices (KPL), and by the National Science and Engineering Research Council of Canada (SV, NG).
References
- [1] A. K. Geim, Science 324, 1530-1534 (2009).
- [2] A. H. C. Neto,et al. Rev. Mod. Phys. 81, 109-162 (2009).
- [3] R. R. Nair, et al. Science 320, 1308 (2008).
- [4] Q. L. Bao, et al. Adv. Func. Mat. 19, 3077-3083 (2009).
- [5] G. Xing, H. Guo, X. Zhang, T. C. Sum, C. Hon, and A. Huan, Opt. Express 18, 4564-4573 (2010).
- [6] F. Bonaccorso, Z. Sun, T. Hasan, and A. C. Ferrari, Nature Photon. 4, 611-622 (2010).
- [7] Z. Sun, et al. ACS Nano 4, 803-810 (2010).
- [8] S. A. Mikhailov, Europhysics Lett. 79, 27002 (2007).
- [9] S. A. Mikhailov and K. Ziegler, J. Phys.: Condens. Matter 20, 384204 (2008).
- [10] S. A. Mikhailov, Frequency Mixing Effects in Graphene chapt. 25 in Physics and Applications of Graphene, InTech 2011.
- [11] E. Hendry, P. J. Hale, J. Moger, A. K. Savchenko, and S. A. Mikhailov, Phys. Rev. Lett. 105, 097401 (2010).
- [12] B. Xu, A. Martinez, K. Fuse, and S. Yamashita, Generation of Four Wave Mixing in Graphene and Carbon Nanotubes Optically Deposited onto Fiber Ferrules, Proceedings of OSA/CLEO 2011, CMAA6.
- [13] R. del Coso and J. Solis, J. Opt. Soc. Am. B 21, 640-644 (2004).
- [14] X. Li, et al. Science 324, 1312-1314 (2009).
- [15] M. Sheikbahae, A. A. Said, T. H. Wei, D. J. Hagan , and E. W. Vanstryland, IEEE Journal of Quantum Electron. 26, 760-769 (1990).
- [16] I. Moreels, Z. Hens, P. Kockaert, J. Loicq, and D. V. Thourhout, Appl. Phys. Lett. 89, 193106 (2006).
- [17] A. Martinez, K. Fuse, and S. Yamashita, Appl. Phys. Lett. 99, 121107 (2011).
- [18] Robert W. Boyd, Nonlinear optics, 3rd ed., Academic Press (2008).
Informational Fourth Page
In this section, please provide full versions of citations to assist reviewers and editors (OL publishes a short form of citations) or any other information that would aid the peer-review process.
References
- [1] A. K. Geim, Graphene: Status and Prospects, Science 324, 1530-1534 (2009).
- [2] A. H. C. Neto, F. Guinea, N. M. R. Peres, K. S. Novoselov, and A. K. Geim, The electronic properties of graphene, Rev. Mod. Phys. 81, 109-162 (2009).
- [3] R. R. Nair, P. Blake, A. N. Grigorenko, K. S. Novoselov, T. J. Booth, T. Stauber, N. M. R. Peres and A. K. Geim, Fine structure constant defines visual transparency of graphene, Science 320, 1308 (2008).
- [4] Q. L. Bao, H. Zhang, Y. Wang, Z. H. Ni, Z. X. Shen, K. P. Loh, and D. Y. Tang, Atomic-Layer Graphene as a Saturable Absorber for Ultrafast Pulsed Lasers, Adv. Func. Mat., 19, 3077-3083 (2009).
- [5] G. Xing, H. Guo, X. Zhang, T. C. Sum, C. Hon, and A. Huan, The Physics of ultrafast saturable absorption in graphene, Opt. Express 18, 4564-4573 (2010).
- [6] F. Bonaccorso, Z. Sun, T. Hasan, and A. C. Ferrari, Graphene photonics and optoelectronics, Nature Photon. 4, 611 - 622 (2010).
- [7] Z. Sun, T. Hasan, F. Torrisi, D. Popa, G. Privitera, F. Wang, F. Bonaccorso, D. M. Basko, and A. C. Ferrari, Graphene mode-locked ultrafast laser, ACS Nano 4, 803-810 (2010).
- [8] S. A. Mikhailov, Non-linear electromagnetic response of graphene, Europhysics Lett. 79, 27002 (2007).
- [9] S. A. Mikhailov and K. Ziegler, Nonlinear electromagnetic electromagnetic response of graphene: frequency multiplication and the selfconsistent- field effects, J. Phys.: Condens. Matter 20, 384204 (2008).
- [10] S. A. Mikhailov, Frequency Mixing Effects in Graphene, chapt. 25 in Physics and Applications of Graphene, InTech 2011.
- [11] E. Hendry, P. J. Hale, J. Moger, A. K. Savchenko, and S. A. Mikhailov, Coherent Nonlinear Optical Response of Graphene, Phys. Rev. Lett. 105, 097401 (2010).
- [12] B. Xu , A. Martinez , K. Fuse, and S. Yamashita, Generation of Four Wave Mixing in Graphene and Carbon Nanotubes Optically Deposited onto Fiber Ferrules, Proceedings of OSA/CLEO 2011, CMAA6.
- [13] R. del Coso and J. Solis, Relation between nonlinear refractive index and third-order susceptibility in absorbing media, J. Opt. Soc. Am. B 21, 640-644 (2004).
- [14] X. Li, W. Cai, J. An, S. Kim, J. Nah, D. Yang, R. Piner, A. Velamakanni, I. Jung, E. Tutuc, and S. K. Banerjee, Large-area synthesis of high-quality and uniform graphene films on copper foils, Science 324, 1312-1314 (2009).
- [15] M. Sheikbahae, A. A. Said, T. H. Wei, D. J. Hagan , and E. W. Vanstryland, Sensitive measurement of optical nonlinearities using a single beam, IEEE J. of Quantum Electron. 26, 760-769 (1990).
- [16] I. Moreels, Z. Hens, P. Kockaert, J. Loicq , and D. V. Thourhout, Spectroscopy of the nonlinear refractive index of colloidal PbSe nanocrystals, Appl. Phys. Lett. 89, 193106 (2006).
- [17] A. Martinez, K. Fuse, and S. Yamashita, Mechanical exfoliation of graphene for the passive mode-locking of fiber lasers, Appl. Phys. Lett. 99, 121107 (2011).
- [18] Robert W. Boyd, Nonlinear optics, 3rd ed., Academic Press (2008).