The remnant of Supernova 1987A resolved at 3 mm wavelength
Abstract
Context. The proximity of core-collapse Supernova 1987A (SN 1987A) in the Large Magellanic Cloud (LMC) and its rapid evolution make it a unique case study of the development of a young supernova remnant.
Aims. We aim at resolving the remnant of SN 1987A for the first time in the 3-mm band (at 94 GHz).
Methods. We observed the source at 3-mm wavelength with a 750-m configuration of the Australia Telescope Compact Array (ATCA). We compare the image with a recent 3-cm image and with archival X-ray images.
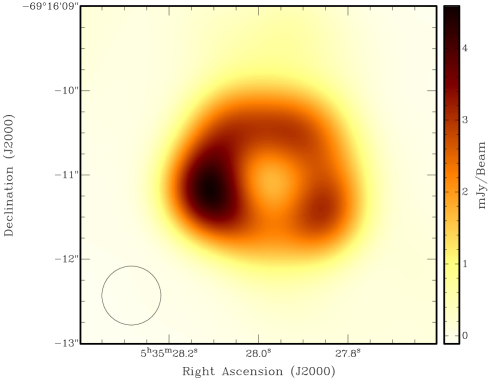
Results. We present a diffraction-limited image with a resolution of , revealing the ring structure seen at lower frequencies and at other wavebands. The emission peaks in the eastern part of the ring. The 3-mm image bears resemblance to early X-ray images (from 1999–2000). We place an upper limit of 1 mJy (2 ) on any discrete source of emission in the centre (inside of the ring). The integrated flux density at 3 mm has doubled over the six years since the previous observations at 3 mm.
Conclusions. At 3 mm – i.e. within the operational domain of the Atacama Large Millimeter/submillimeter Array (ALMA) – SN 1987A appears to be dominated by synchrotron radiation from the inner rim of the equatorial ring, characterised by moderately-weak shocks. There is no clear sign of emission of a different nature, but the current limits do not rule out such component altogether.
Key Words.:
circumstellar matter – supernovae: SN 1987A – ISM: supernova remnants – Magellanic Clouds – Radio continuum: ISM1 Introduction
Supernova 1987A, located in the Large Magellanic Cloud (LMC), was first observed on 1987 February 24. Since then the evolution of the supernova remnant (SNR) has been followed across the electro-magnetic spectrum, except for the far-infrared (FIR) and high radio frequencies. In the radio, since day 1200 the remnant has been continuously monitored in the 1.4–9 GHz frequency range with the Australia Telescope Compact Array (ATCA). At these frequencies, the flux density of the remnant has been steadily increasing over time (Manchester et al. 2002), in an exponential fashion since day 5000 (Zanardo et al. 2010). This reflects the propagation of shocks through the magnetised plasma resulting in synchrotron radiation. However, it is as yet unclear what is happening at the high-frequency end of the radio spectrum, where other emission may become apparent including possibly that associated with dust or an emerging pulsar.
Warm dust ( K) in an equatorial ring in diameter is linked to mass loss from the progenitor star (Bouchet et al. 2006; Dwek et al. 2010). Recently, Matsuura et al. (2011) detected a second dust component, of only K, which is also seen at 0.87 mm wavelength (Lakićević et al. 2011). Matsuura et al. argued that the cold dust had formed in the ejecta of SN 1987A. Their observations did not have sufficient angular resolution to prove this beyond doubt. While Lakićević et al. (2012) constrained the sub-mm emission to originate from within a few arcseconds from the explosion site, they also offer scenarios in which the dust might not reside in the ejecta.
The remnant of SN 1987A (hereafter SNR 1987A) was first successfully observed at 3 mm wavelength in 2005 with the ATCA on short baselines. The remnant was unresolved in the beam; the integrated flux density was mJy (Lakićević et al. 2011). We have now attempted to spatially resolve the remnant at this wavelength. Due to the combination of increased brightness and the ATCA upgrade with the Compact Array Broadband Backend (CABB; Wilson et al. 2011), the SNR has been resolved for the first time at 3 mm (94 GHz).
The ability to resolve the remnant at high radio frequencies is crucial in investigating the different sources of emission within the remnant, and as such the new ATCA observations are a useful complement to future observations with the Atacama Large Millimeter/submillimeter Array (ALMA).
2 Observations and data reduction
SNR 1987A was observed at 3-mm wavelength with the ATCA over three 12-hr sessions, on 2011 June 30, July 1 and August 2 (programme C2495; P.I. J.van Loon) – days 8892, 8893 and 8925 since explosion – with the five antennae equipped with receivers operating in the 3-mm band (85–105 GHz). The array was in the 750B array configuration on June 30 and July 1, with baselines between 61 and 765 m, and in the H168 array configuration on August 2, with baselines between 61 and 192 m. Observations were performed in 2-GHz wide bands centred on frequencies of 93 and 95 GHz. All three sessions were characterised by stable atmospheric conditions, with very low precipitable water vapour on June 30 and July 1.
The bandpass calibrator, PKS B1921293 was used on June 30 and August 2, while PKS B0637752 was used on July 1. The phase calibrator PKS B0530727 was observed for 1.5 min per 2 min integration time on the source, while the pointing calibrator PKS B0637752 was observed for 2 min at approximately hourly intervals. Uranus was used as flux density calibrator. Observations of SNR 1987A were centred on RA , Dec (J2000) as from Potter et al. (2009).
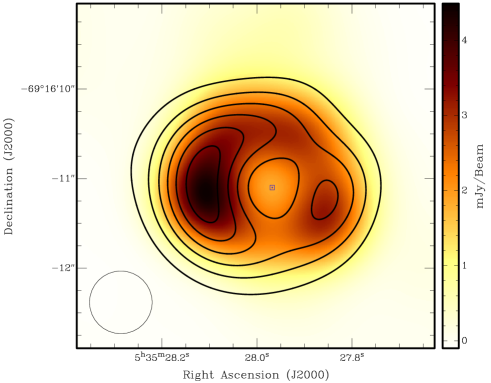
The data were processed using the miriad111http://www.atnf.csiro.au/computing/software/miriad package. The task atfix was first used to correct the system temperatures, instrumental phases and baseline lengths. The data were examined, and scans during poor atmospheric phase stability were rejected. To maximise the signal-to-noise (S/N) ratio, robust weighting was used to invert the calibrated data at both frequencies, with weighting parameter 0.5 (Briggs 1995). A preliminary clean model (Högbom 1974) was constructed by using a small number of iterations (viz. 200). The source had sufficient S/N for phase self-calibration, which was performed with a 2-min solution interval. Subsequently, deconvolution was performed using the maximum entropy method (MEM; Gull & Daniell 1978). For the final image the MEM model of the combined datasets was restored to a diffraction-limited circular beam with full-width at half-maximum (FWHM) – i.e. the synthesized beamsize of the 750B array – and regridded at a pixel scale of . Figure 1 shows the Stokes-I continuum image; the off-source r.m.s. noise is mJy beam-1 and we determine an integrated flux density of SNR 1987A of mJy.
To construct a spectral index image, we also reduced observations at 3 cm performed on 2011 January 25 (Ng et al., in preparation). The reduction procedures included application of uniform weighting, one iteration of phase self-calibration over a 5-min solution interval and MEM deconvolution. As for the 3-mm image, the 3-cm image was restored with a circular beam and regridded at a pixel scale of .
3 Discussion
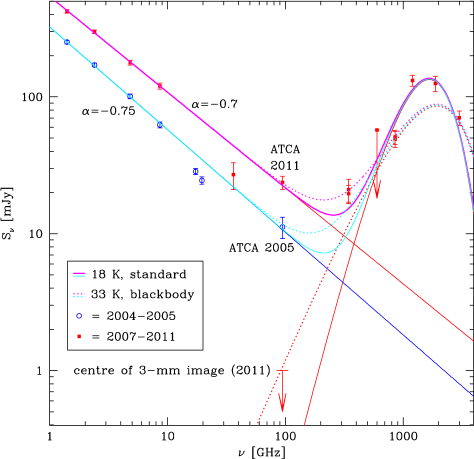
Compared to July 2005 (Lakićević et al. 2011), the flux density has increased times (Fig. 2). The new 3-mm measurement lies on the position expected from extrapolation of a power-law fit to data at cm of the form , with spectral index , just as the July 2005 measurement at 3 mm (cf. Lakićević et al. 2012) obeyed a power law with to the contemporary radio data. It is odd that the 7- and 12-mm band flux densities are lower than expected from the power law obeyed by the longer-wavelength data. Could this result from decay of the synchrotron mechanism? For a decay time yr (with magnetic field and relativistic factor) of yr, and happening around the characteristic frequency Hz of GHz, one would derive G (which is rather high) and (which is typical). However, this scenario would be hard to reconcile with the ever-increasing synchrotron flux, and would imply that the 3-mm flux is not due to synchrotron emission.
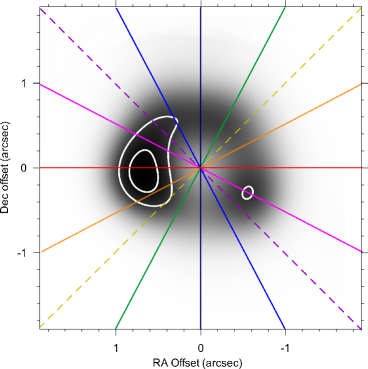
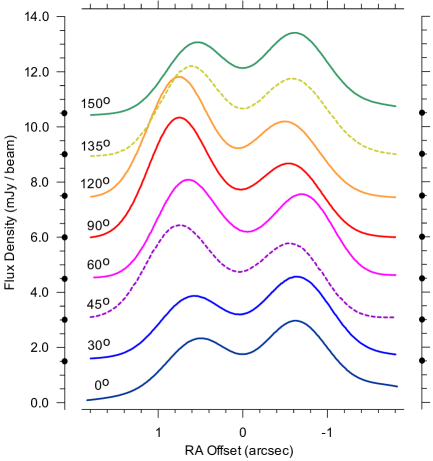
At resolution the 3-mm emission from SNR 1987A is clearly resolved (Fig. 1), making it the highest radio frequency at which this has now been accomplished. The 3-mm image shows similarities with the images at 7 and 12 mm (Manchester et al. 2005; Potter et al. 2009) and at 3 cm (Ng et al. 2008). The emission is broadly distributed along the equatorial ring, but unlike the optical images the radio appearance is asymmetric with the emission peaking in the eastern lobe (Fig. 3). The flux ratio between the eastern and western halves of the image is . By fitting an optically thin shell, this asymmetry was found to be at 7 mm (Potter et al. 2009) and at 3 cm (Ng et al. 2008). The maximum asymmetry with respect to the VLBI position in the 3-mm image occurs near position angle (i.e. due east–west), where it reaches a ratio of (Fig. 3).
The flux density in the centre is mJy, but this includes a contribution from surrounding emission due to beam smearing. The emission peaks at from the centre, at mJy beam-1 (Fig. 3). The central intensity level resulting from two identical Gaussians of peak intensity 3 mJy and FWHM separated by is 0.8 mJy. This leaves room for additional emission in the centre also at a level of mJy, which may be compared with the 2- r.m.s. noise of mJy. Given the crudeness of this estimate we settle on an upper limit of 1 mJy at 2- significance. This is below the upper limit of mJy placed on contributions from free–free emission to the mm emission by Lakićević et al. (2011). Those authors estimated that the cold dust ( K) seen at far-IR and sub-mm wavelengths would contribute only Jy at 3 mm. As the emissivity law is uncertain, Lakićević et al. (2012) considered alternatives, their most extreme model involving warmer grains ( K) behaving like perfect black bodies at long wavelengths – e.g., needles or fluffy aggregates. That model need only require M⊙ of dust, and would yield mJy at 3 mm (Fig. 2). Thus our current upper limits do not rule out such type of dust (and so little of it) to be present.
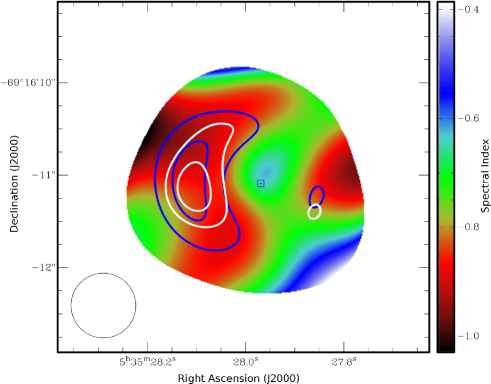
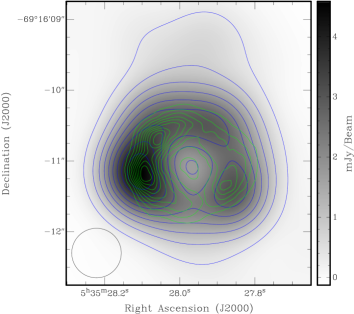
The 3-mm image is compared with the 3-cm image in Figure 4; these form the basis for the spectral index image (Fig. 5). The spectral index was determined from the ratio of the two images where the flux levels exceed 3- above zero – still, near the outer edge of the displayed area the low flux level combined with the inevitable imperfections in the image reconstruction can easily lead to large variations in the flux ratio between independent images. We observe the following: (1) the brightest radio emission is characterised by , and (2) the centre has a shallower spectrum, with , similar to the tentative result obtained at cm wavelengths (Potter et al. 2009).
Diffusive shock acceleration theory (Jones & Ellison 1991) yields , where is the power-law index of the momentum distribution of the accelerated electrons, and depends only on the shock compression ratio, , as . Supersonic shocks are easily established in SNRs, and lead to , i.e. ( is possible for relativistic and/or non-adiabatic shocks). We conclude that the strongest mm-emission, with , arises from moderately-weak shocks with . The central region could signify the emergence of a pulsar wind nebula with strong shocks (), or some non-synchrotronic emission – e.g., free-free emission with (indeed, the ejecta are clearly visible in Hubble Space Telescope images) or emission from grains with high emissivity at mm wavelengths (cf. Lakićević et al. 2012; Wickramasinghe & Wickramasinghe 1993), but the spectral index value in the image centre is uncertain.
There is a striking resemblance between the 3-mm image and the earliest, deconvolved X-ray images (Fig. 6), taken with the Chandra satellite in 1999 and 2000 (Burrows et al. 2000; Park et al. 2002; Racusin et al. 2009), when the blast wave had just reached the inner rim of the flash-ionized ring. In particular, the peaks in the mm emission in the east and south–west correspond to similar peaks in the X-ray emission at that time. The X-ray images are broad-band, 0.3–8 keV, and were averaged and aligned with the 3-mm image; the 1999 image was taken in order of the High Energy Transmission Grating, and biased towards higher energies than the 2000 images. The correspondence between the high-frequency radio structures and X-ray structures is remarkable given that radio synchrotron emission depends on the magnetic field strength and is highly anisotropic.
The resemblance between the mm emission and X-rays has diminished since 2000, as the X-ray images have become dominated by soft X-ray emission from hot gas behind the forward shock distributed more uniformly along the ring (Racusin et al. 2009; Zhekov et al. 2010a). The fact that the synchrotron emission seen in 2011 is linked to plasma through which the forward shock plowed more than a decade before suggests that particle acceleration in SNR 1987A is sustained at the interface between the ionized plasma of the fast wind from the blue supergiant progenitor of SN 1987A, and the denser circumstellar medium from the preceding red supergiant stage. A magnetised fast wind might also lie at the origin of the bipolar circumburst morphology – indeed, the radio emission extends in the north–south direction (Fig. 6; cf. the 7-mm images in Potter et al. 2009).
4 Conclusions
We have resolved the remnant of SN 1987A at 3 mm wavelength, at a resolution of . The image is dominated by synchrotron emission from just inside the equatorial ring, generated by moderately-weak shocks. We note correspondence between the 3-mm emission and structures in the hard X-ray emission recorded in 1999 and 2000, i.e. more than a decade earlier. These observations corroborate the idea proposed by Manchester et al. (2005) that the synchrotron emission arises from plasma behind the reverse shock (or reflected shock; cf. Zhekov et al. 2010b) which moves relatively slowly through relatively hot plasma resulting in a moderate Mach number and hence a moderate compression ratio. We set an upper limit on the emission from any dust or pulsar wind nebula in the centre, of mJy (2 ).
Acknowledgements.
We thank the staff at Narrabri, in particular our duty astronomer, Tui Britton, and David Burrows and Eveline Helder who kindly supplied us with the Chandra images. ML acknowledges studentships from ESO and Keele University. The Australia Telescope Compact Array is part of the Australia Telescope which is funded by the Commonwealth of Australia for operation as a National Facility managed by CSIRO. The Centre for All-sky Astrophysics is an Australian Research Council Centre of Excellence, funded by grant CE11E0090.References
- (1) Bouchet P., et al. 2006, ApJ, 650, 212
- (2) Briggs D.S. 1995, BAAS, 27, 1444
- (3) Burrows D.N., et al. 2000, ApJ, 543, L149
- (4) Dwek E., et al. 2010, ApJ, 722, 425
- (5) Gull S.F., Daniell G.J. 1978, Nature, 272, 686
- (6) Högbom J.A. 1974, A&AS, 15, 417
- (7) Jones F.C., Ellison D.C. 1991, Space Sci. Rev., 58, 259
- (8) Kjær K., Leibundgut B., Fransson C., Jerkstrand A., Spyromilio J. 2010, A&A, 517A, 51
- (9) Lakićević M., van Loon J.Th., Patat F., Staveley-Smith L., Zanardo G. 2011, A&A, 532, L8
- (10) Lakićević M., van Loon J.Th., Stanke T., De Breuck C., Patat F. 2012, A&A Letters, in press
- (11) Manchester R.N., Gaensler B.M., Wheaton V.C., Staveley-Smith L., Tzioumis A.K., Bizunok N.S., Kesteven M.J., Reynolds J.E. 2002, PASA, 19, 207
- (12) Manchester R.N., Gaensler B.M., Staveley-Smith L., Kesteven M.J., Tzioumis A.K. 2005, ApJ, 628, L131
- (13) Matsuura M., et al. 2011, Science, 333, 1258
- (14) Ng C.-Y., Gaensler B.M., Staveley-Smith L., Manchester R.N., Kesteven M.J., Ball L., Tzioumis A.K. 2008, ApJ, 684, 481
- (15) Park S., Burrows D.N., Garmire G.P., Nousek J.A., McCray R., Michael E., Zhekov S. 2002, ApJ, 567, 314
- (16) Potter T.M., et al. 2009, ApJ, 705, 261
- (17) Racusin J.L., Park S., Zhekov S., Burrows D.N., Garmire G.P., McCray R. 2009, ApJ, 703, 1752
- (18) Reynolds J.E., et al. 1995, A&A, 304, 116
- (19) Wickramasinghe N.C., Wickramasinghe A.N. 1993, Ap&SS, 200, 145
- (20) Wilson W.E., et al. 2011, MNRAS, 416, 832
- (21) Zanardo G., et al. 2010, ApJ, 710, 1515
- (22) Zhekov S.A., McCray R., Dewey D., Canizares C.R., Borkowski K.J., Burrows D.N., Park S. 2010a, ApJ, 692, 1190
- (23) Zhekov S.A., Park S., McCray R., Racusin J.L., Burrows D.N. 2010b, MNRAS, 407, 1157