Percolation and orientational ordering in systems of magnetic nanorods
Carlos E. Alvarez∗a and Sabine H. L. Klappa
Received Xth XXXXXXXXXX 20XX, Accepted Xth XXXXXXXXX 20XX
First published on the web Xth XXXXXXXXXX 200X
DOI: 10.1039/b000000x
Based on Monte Carlo (MC) computer simulations we study the structure formation of a system of magnetic nanorods. Our model particles consist of fused spheres with permanent magnetic dipole moments, as inspired by recent experiments. The resulting system behaves significantly different from a system of hard (non-magnetic) rods or magnetic rods with a single longitudinal dipole. In particular, we observe for the magnetic nanorods a significant decrease of the percolation threshold (as compared to non-magnetic rods) at low densities, and a stabilization of the high-density nematic phase. Moreover, the percolation threshold is tunable by an external magnetic field.
1 Introduction
††footnotetext: a Institut für Theoretische Physik, TU Berlin, Hardenbergstraße 36, D-10623 Berlin, Germany.††footnotetext: * E-mail: carlos.e.alvarez@tu-berlin.deMagnetic nanoparticles 1 play nowadays a key role in a number of technological contexts from storage media and design of new functional materials 2, 3, 4, 5, 6, to medical applications 7. In many cases, the magnetic particles are suspended in a non-magnetic carrier liquid such as water or oil, yielding a colloidal suspension often called ”ferrofluid”. The most prominent ferrofluids involve spherical particles with typical sizes of about 10 nanometers. These particles can be considered as single-domain ferromagnets; thus they have permanent magnetic dipole moments. The resulting anisotropic and long-range dipole-dipole interactions between the spheres play an important role for their cooperative behavior. Indeed, already in zero field (and small packing fractions) the energetic preference of head-to-tail configurations can lead to the formation of long chains and percolating (i.e., system-spanning) networks 8, 9, while at larger packing fractions, various ordered structures are observed 10. Application of an external (static) magnetic field on suspensions of magnetic spheres yields the formation of aligned chains and bundles 11, 12. As a ”byproduct” one observes drastic changes of the material properties, particularly the shear viscosity (”magnetoviscous effect”) and the thermal conductivity 13. Thus, magnetic suspensions are prime examples of complex fluids, whose internal structure, phase behavior and dynamic rheological properties can be efficiently controlled by external parameters 14, 15.
Within this area of research, much effort is currently devoted to the synthesis and characterization of magnetic particles with anisotropic shape, examples being magnetic rods 16, 17, 18, 19 and cubes 20. One key issue, e.g., in the case of rods, is to stabilize the chains (against shear) and thus, to enhance the magnetoviscous effect observed in ”simple” ferrofluids. Moreover, anisotropic magnetic particles enable per definition a broader variety of self-assembled structures and patterns. However, compared to the case of magnetic dipolar spheres, the collective behavior of anisotropic magnetic particles is much less understood.
In the present article, we investigate structure formation phenomena in suspensions of a special class of magnetic nanorods (MNR) by Monte Carlo (MC) computer simulations. Our model MNRs consist of dipolar spheres which are permanently linked (”fused”) into a stiff chain with internal head-to-tail alignement of the dipole moments. This model is inspired by recent experiments of Birringer et al. 16 who used a self-assembly (aerosol-synthesis) process to produce magnetic rods composed of aligned ironoxide spheres. The magnetic field created by one of these rods is a superposition of the dipolar fields of the individual spherical particles. This is in contrast to earlier models of rod-like particles with single longitudinal (or transversal) dipole moment. Indeed, models of that type have already been intensely studied more than a decade ago, both by theory and by simulations 21, 22, 23, 24. At that time, interest was mainly driven by the desire to understand the phase behavior of polar liquid crystals. However, as we will see in the present study, the structural behavior of our new model MNRs differs strongly from that of single-dipole rods.
One main goal of our study is to explore the percolation behavior of the MNRs. This is an interesting issue not only in the area of magnetic fluids (recall that already simple magnetic spheres display pronounced chain and network formation 8, 9). Indeed, the question of percolation is intensively discussed also for general rod-like, colloidal particles, including prominent examples such as carbon nanotubes 25, 26, 27. Research in this directions is generally driven by the desire to produce lightweight and, at the same time, highly connected materials with mechanical, thermal or electrical properties that are enhanced relative to their counterparts in the corresponding non-connected systems 28, 29, 30, 16, 13. Thus, a general aim of these efforts is explore conditions under which the percolation threshold, i.e., the volume fraction required for the formation of systems-spanning clusters, is decreased 31. It has already been shown that such as decrease can be realized by an increase of the aspect ratio 32 as well as by other (interaction-related) factors such as depletion effects 33, 34, 27. In the present study we show that the superpositioned magnetic interactions between our MNRs provide yet another mechanism that strongly enhances the tendency for percolation.
Further topics of this article concern the stability of long-range orientational order, as well as the impact of an external magnetic field 35. In particular, we show that the MNR interactions tend to stabilize the nematic phase in sufficiently long MNRs. However, contrary to what has been found in a recent analytical study of non-magnetic rods 36, the nematic transition does not surpress the percolation. Finally, we briefly report on the impact of an external magnetic field. It turns out that already small magnetic fields lead to a significant decrease of the percolation threshold.
The rest of this paper is organized as follows. In section 2.1 we begin by defining our MNR model, followed by the details of the MC simulations in section 2.2. In section 3 we present our numerical results, starting with the effect of the dipolar interaction on the cluster formation. We then proceed to a discussion of the percolation transition and the appearance of global orientational order in sections 3.2 and 3.3, respectively. In section 3.4 we show our results in presence of an external magnetic field. Our conclusions are summarized in section 4.
2 Model and Simulations
2.1 Model
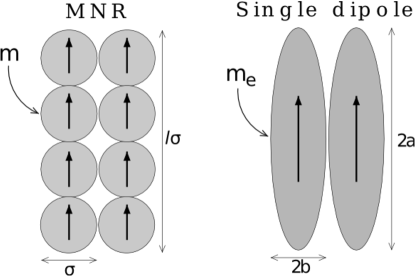
Our model system consists of stiff nanorods made out of several identical hard spheres of diameter with a point dipole at their center (see Fig. 1 left). The positions of the spheres are fixed with respect to the center of mass of the rod, and the orientations of the dipoles are always aligned with the symmetry axis of the rod. We will use to denote the number of magnetic spheres composing a nanorod, which is also its length in units of , therefore corresponds to the dipolar hard sphere (DHS) case. The interaction energy between two rods and is then the sum of the pair interactions between their respective interaction sites (magnetic spheres). That is
| (1) |
where is the vector joining the centers of rods and with orientations and . Each rod is composed of interaction sites, with denoting the position of site of particle , and is its magnetic moment. The interaction between sites is given by
| (2) |
with . The magnetic moment has the same strength for each sphere and is given by , where is the relative magnetic permeability of the solvent, and and are the volume of the particles and the magnetization, respectively. These parameters can, in principle, be extracted from experiments. Here we rather consider the reduced magnetic dipole moments , where with and being Boltzmann’s constant and the temperature, respectively. Common experimental values for (at room temperature) are of the order 16, 37. We also consider the effect of an constant external field () parallel to the axis of the simulation box. The interaction energy between the external field and a MNR is
| (3) |
The coupling strength (relative to ) then follows as . This expression suggests to define
| (4) |
Experimental values for the magnetic fields are of the order of 0.1 Tesla (implying at room temperature with ). MNR ferrofluids have been found to be susceptible already to small fields of T (see Ref. 16), implying .
In the present study we also compare the structure of the magnetic nanorods consisting of spheres (our MNRs) to the simpler, and well studied21, 38, 39, 40, 41, model of prolate hard spheroids with length , width , and a single longitudinal point dipole located at the center (”single dipole model”). We set the width to . Thus, the shape and volume of a spheroid is comparable to that of a MNR if . In order to compare the dipolar coupling strengths within the two models, we require that the pair interaction energies in the parallel side-by-side configuration depicted in Fig. 1 are the same. This is
| (5) |
Using the previous condition, and the expressions for the interaction energies
| (6) |
and
| (7) |
we find that the ”equivalent” dipole moment , as defined above, is given by
| (8) |
2.2 Monte Carlo simulations
We carried out MC simulations in the NVT ensemble with periodic boundary conditions for monodisperse systems of rods with lengths and , at several packing fractions (, where is the length of the simulation box). Dipolar long range interactions were taken into account by using Ewald summations with a conducting boundary 42.
Simulations were made with rods and rods for and respectively. In order to compare with the DHS case, we also simulate systems with and particles. The points in phase space studied were averaged for to MC cycles, depending on the strength of the interaction. This relatively small number of steps is sufficient for a first, exploratory study, which is the aim of this paper. To speed up the sampling of the phase space cluster moves and inversion moves (changing the sign of the orientation of the particle) were used in addition to single particle moves. Cluster algorithms that speed up the sampling of the phase space in Monte Carlo simulations are widely used 43, 44, 45, 46, 47, 48, 49, 50. Here we define the clusters using a simple proximity criteria approach, in which two particles are considered to be ”bonded” (and part of the same cluster) if the nearest distance between their surfaces is less than some value (see below).
The same cluster definition (which is based on a geometric, rather than an energetic criterion) is used to study the aggregation properties of the system. One important quantity in this context is the degree of polymerization 51, 52, defined as
| (9) |
where is the number of rods that belong to a cluster composed of more than one rod and is the total number of rods. Second, we consider the percolation probability defined as the probability of finding at least one ”infinite” cluster, that is, a cluster connected to its own periodic images.
For both properties, and , the choice of the parameter is in general arbitrary. From a physical point of view may be thought of as the ”hopping” distance for an excitation to go from the surface of one particle to another 31. Depending on the microscopic nature of this excitation, the hopping can be relevant for, e.g., the thermal or electrical conductivity of the material. Here we consider essentially as an adjustable parameter. Specifically, following previous studies on percolation of nanorods 33, 34, 27 we use a value for which is small with respect to the dimensions of the particles (). In addition, to get a somewhat less arbitrary measure of percolation, we also calculate the geometrical ”critical” distance . The latter is defined as the averaged minimum value of for which an infinite cluster appears 31, 32. From a physical point of view, can be interpreted as an inverse measure for the conductivity of the system 32.
For studying the structure of the system we computed some of the coefficients of the expansion of the pair correlation function in terms of rotational invariants 53. Here we present results for the projection 54
| (10) |
where is the reduced density, is the Legendre polynomial of degree , and and are the center-to-center distance and the angle between the orientations of rods and .
Finally, to investigate the degree of global orientational order we compute the degree of parallel ordering (”polarization”) and the nematic order parameters. The ”polarization” is defined as
| (11) |
with denoting the unit eigenvector associated with the largest eigenvalue of the matrix
| (12) |
where the denotes the particle and the indexes and denote the cartesian component of the orientation vector. The nematic order parameter () is defined as the largest eigenvalue of . When applying an external field to the systems we measure additionally the magnetization of the system, defined as
| (13) |
3 Results
3.1 Cluster formation
Our first goal is to investigate the type of clusters formed in our MNR system at low packing fractions , as well as the dependence of the clustering on the interaction strength (). The appearance of clusters in systems of MNRs is already suggested by the well-studied system of DHS (corresponding to the case in our model). Indeed, DHS particles are known to form long, head-to-tail chains at packing fractions and dipole moments 55.
Taking the DHS system as a reference, we here present results from MC simulations of rods with lengths , , and and dipole moments , , and , at a packing fraction . This packing fraction is comparable with typical experimental values () for MNR systems 16.
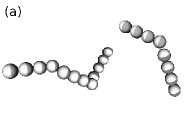
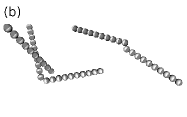
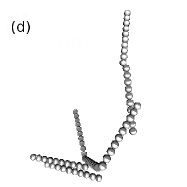
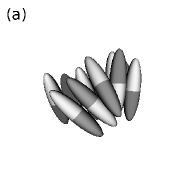
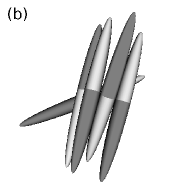
Corresponding MC results for the degree of polymerization [see eq. 9] are given in Table 1. At (non-magnetic rods), the value of is generally small and there is no formation of chains or other larger structures, regardless of the value of . This is expected since the packing fraction considered here is far below the percolation threshold of that system (see Section 3.2). At , about 30-40 percent of the rods are associated into clusters [see Table 1] which contain, however, typically less than three particles. Some representative snapshots of aggregates at and , are shown in Figs. 2 (a) and (b). It is seen that the rods already tend to form head-to-tail arrangements, despite of the still rather small interaction strength. Finally, at essentially all rods are associated into clusters, as seen from the fact that is close to one for all values of [see Table 1]. As expected, these clusters contain on the average more rods than those at . The resulting structures are illustrated by the snapshots in Figs. 2 (c) and (d). These snapshots also reveal that there are essentially three types of configurations which seem to be preferred by strongly coupled MNRs. Type I, which is the dominant one at [see Fig. 2 (c)], is given by head-to-tail chains or rings, similar to what is found in conventional DHS systems (). Type II, which is seen in the system, and, to less extent, also in the system, is a side-by-side configuration where the dipoles point in opposite (antiparallel) direction. Finally, Type III, which seems to be particularly important for long MNRs (), [see Fig. 2 (d)] consists of a configuration where the dipoles are oriented along the same direction (parallel), and the rods are close to side-by-side, but somewhat shifted against one another in longitudinal direction.
| 1 | 0.0 | 0.147 |
|---|---|---|
| 4 | 0.0 | 0.193 |
| 10 | 0.0 | 0.303 |
| 1 | 1.5 | 0.312 |
| 4 | 1.5 | 0.349 |
| 10 | 1.5 | 0.396 |
| 1 | 2.4 | 0.964 |
| 4 | 2.4 | 0.997 |
| 10 | 2.4 | 0.954 |
 |
 |
 |
 |
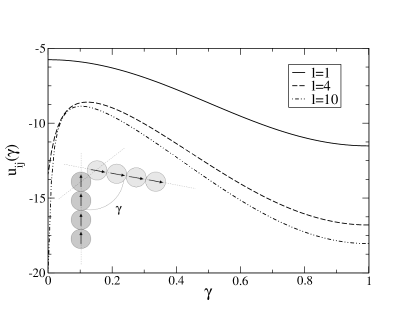
To better understand these configurations we take a closer look at the energetic landscape of interacting MNRs. A first useful insight is given by Fig. 3 which shows the interaction energy of a pair of MNRs as a function of the ”joint” angle (in units of ). The latter is defined such that and correspond to the Type I and Type II configurations, respectively. We see from Fig. 3 that for DHS () there is just one energy minimum with respect to , which corresponds to Type I. For and , on the other hand, there is a second pronounced minimum at . Moreover, this second minimum is separated from the first one by a large energy barrier which becomes the larger as is increased. This suggests that both, Type I and Type II configurations are quite stable against (thermal) fluctuations, a picture which is indeed confirmed in the actual MC simulations.
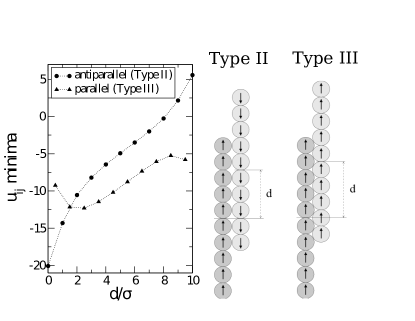
Further, especially for longer MNRs () it is interesting to compare the energies related to Type II and Type III configurations. This is done in Fig.4, where we plot the interaction energies of two adjacent rods (see sketch in the upper part of the figure) with parallel rod axes and either antiparallel (Type II) or parallel (Type III) orientation of the dipole moments as function of the ”longitudinal” distance (i.e., the displacement of the rod centers along the direction of the rod axes). Note that we have plotted only the minima of the interaction energies with respect to . For the antiparallel configurations, these minima occur at with being an integer, whereas for the parallel configurations, corresponding to shifted (Type III) arrangements. From the numerical values of the two interaction energies we can see that both type of configurations are stable (in the sense that the energies are negative) for a broad range of displacements. Moreover, for larger values of the energies related to Type III becomes even more attractive than those related to Type II. Finally, for the specific values of and the specific lateral distances considered in Fig. 4, the configurations with lowest energy are an antiparallel one with (i.e., no displacement at all) and a parallel one with .
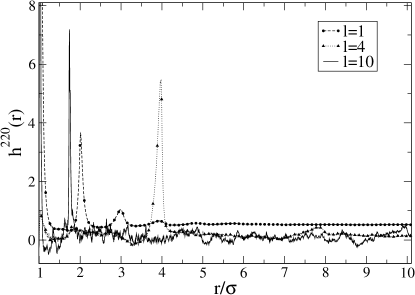
The presence of several types of preferred structures in strongly coupled MNR systems is also reflected by the correlation function plotted in Fig. 5. At , one observes the typical peaks at multiples of a particle diameter, reflecting the (head-to-tail) alignment of neighboring particles in the chains. The same type of (chain-like) structure is preferred by the system with , as indicated by the large peak of at . Note, however, that the system also has a peak at related to an antiparallel side-by-side (Type II) configuration. At , the highest peaks occur at and , whereas the (expected) peak at is already to small to be distinguished from statistical noise. The large heights of the first two peaks reflect the presence of both, Type II and Type III configurations.
To close this section, and to better acknowledge the specific type of clusters formed in the present model of MNRs, we show in Fig. 6 two typical clusters formed in systems of magnetic prolate spheroids with a single, longitudinal (point) dipole. For both aspect ratios considered in Fig. 6, the spheroids tend to align in an antiparallel side-by-side configurations, similar to the previously introduced Type II configurations with d=0. On the other hand, configurations of Type III are essentially non existent. The presence of antiparallel configurations in the single-dipole rods leads to quite compact clusters. This is consistent to findings in earlier MC studies 24 of such systems.
 |
 |
3.2 Percolation
As a next step we want to understand the influence of the magnetic interaction on the percolation properties of the MNRs. It is well known that percolation (i.e., formation of system-spanning clusters) already occurs in non-magnetic systems of prolate, hard-core particles, with the percolation density decreasing upon increase of the aspect ratio of the particles 56, 32. In Fig. 7 we plot our present MC results for the percolation probability of MNRs with and various values of as function of the packing fraction. All data in Fig. 7 have been obtained with a fixed value of the parameter determining our cluster criterion (see section 2.2).
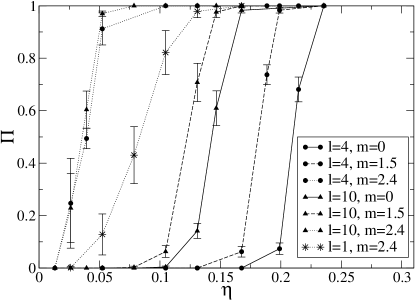
Considering first the non-magnetic case, we see that both the systems with and do have a percolation transition, as indicated by the steep increase of from values close to zero to values close to one (upon increase of ). A precise determination of the percolation transition would require calculations for different system sizes, which we did not perform in our present, more exploratory study. Nevertheless, we can estimate from the data in Fig. 7 that the percolation thresholds at , using , are at and . To check the effect of we performed calculations using and obtained and . When comparing the multiple-sphere rods with spherocylinders is important to remember two things: i) The length of our rods is related to the aspect ratio of the spherocylinderts via , where is the length of the cylinder and the diameter of the spherical cap of the spherocylinder. ii) At the same aspect ratio, the volume fraction of the multiple-sphere rod is lower than that of the spherocylinder. This means we have to multiply the volume fraction obtained for the multiple-sphere rod by a factor , where is the volume of the spherocylinder and is the volume of the multiple-sphere rod with . Taking into account these considerations, our results for are in agreement with those reported for hard spherocylinders 34. Coming back to the behaviour of MNRs, we note that the trend of longer rods percolating at lower densities, persists when we ”switch on” the magnetic interactions, as revealed by the data for . More importantly, we also see that the corresponding thresholds are smaller than those for , indicating that the magnetic interactions promote the percolation transition. This effect becomes even more pronounced for . For the latter case, we also see that the percolation thresholds seem to saturate for different rod length at .
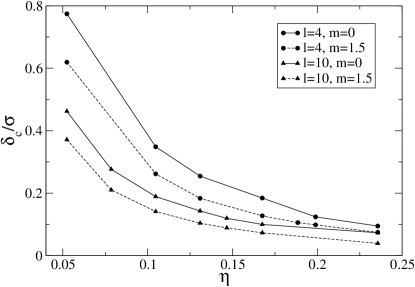
Having obtained the percolation transition(s) for a fixed value of the cluster parameter , it is interesting to look at the percolation phenomenon from a less ”biased” perspective, that is, without making any assumptions on particle distances within clusters. To this end we now consider the parameter , defined in section 2.2 as the minimum value of for which a percolating cluster appears in the system. Results for as function of are plotted in Fig. 8. As expected, all systems exhibit a decrease of as the density increases. More importantly, we see that already for , the values of for the shorter rods () are consistently larger than those for , indicating that the tendency for percolation is enhanced upon increasing the rod length. The same trend appears when we ”switch on” the magnetic interactions, as shown by the data for in Fig. 8, where the curves for fixed are shifted to the left (i.e., to lower packing fractions) relative to the corresponding ones at . Thus, the magnetic interactions have the same supportive effect on the percolation. These findings are qualitatively consistent to the ones obtained for fixed plotted in Fig. 7.
Finally, it is interesting to briefly compare the percolation behavior of MNRs system to that of systems of single-dipole spheroids. To this end, we consider the parameter
| (14) |
which measures, for fixed values of and , the value of obtained for magnetic (MNR or single-dipole) particles relative to the corresponding ones for (). Results for obtained for and a low density are given in Table 2. In this context, the simulations have been started from an initial configuration with randomly positioned and oriented rods. The systems have then been equilibrated for MC steps.
| (MNR) | (sing-dip) | |
|---|---|---|
| 4 | -87.8% | 16.3% |
| 10 | -83.4% | 24.5% |
We see from Table 2 that for the MNR model the magnetic interaction produces negative values of and thus, a decrease of relative to the non-magnetic case, consistent with the results plotted in Fig. 8. For the single-dipole model, one the other hand, is positive, meaning that the magnetic interactions rather hinder the percolation.
This remarkable difference in the behaviors of the two models can be attributed to the different structure of the corresponding clusters. Whereas the MNRs tend to form open, elongated structures [see Fig. 2], the single-dipole spheroids rather tend to compact clusters with antiparallel local ordering [see Fig. 6].
3.3 Nematic ordering
So far we have focused on the clustering and percolation behavior of the magnetic nanorods. However, given the non-spherical, elongated shape of the MNRs it is tempting to consider also the appearance of long-ranged orientational (i.e., liquid-crystalline) ordering in our model. Indeed, it is well established that fluids of non-spherical particles can display entropy-driven phase transitions into nematic, smectic, and plastic phases, as the packing fraction is increased 57. In particular, the phase diagram of hard spherocylinders has been mapped out in detail by Bolhuis and Frenkel 58 who performed MC simulations for a broad range of length-to-breadth ratios (where we recall that ). According to their results, rods with display both, a nematic and a smectic-A phase, the latter being characterized by the formation of layers in planes transversal to the global director. Moreover, there are MC results for dipolar hard spherocylinders with and a single longitudinal point dipole 23. According to this study, the (longitudinal) dipole tends to destabilize the nematic phase. Instead, one observes an enhanced tendency for smectic ordering. The stabilization of smectic-like ordering in these systems can be understood as a consequence of the strong energetic preference of antiparallel side-by-side configurations. Similar observations have been made for other model systems involving elongated particles with longitudinal dipole moments 22, 24.
In the present study we investigate the occurrence of liquid-crystalline (specifically, nematic) ordering via the orientational order parameter defined in section 2.2. Results for as function of the packing fraction are plotted in Fig. 9.
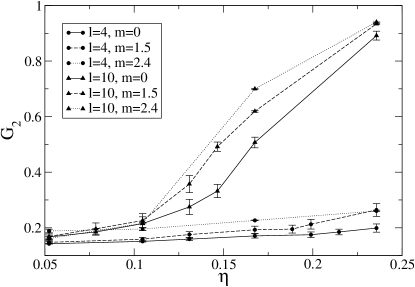
For the case , the order parameter has negligible values regardless of the dipole moment, indicating that there is no orientational ordering within the density range considered (). Indeed, for the particular case , this result is consistent with the MC study of Bolhuis and Frenkel 58 who showed that hard spherocylinders with do not present an isotropic to nematic phase transition.
On the other hand, we find from Fig. 9 that the systems with clearly do exhibit ordered phases, as reflected by the pronounced increase of (upon increasing ) towards values close to . At the same time, the corresponding values of the ”ferromagnetic” order parameter defined in eq. (11) are negligible, indicating that we indeed observe an ordering of the rod axes (rather than ordering of their dipole directions). Due to the relatively small systems sizes in our simulations, the -curves in Fig. 9 are rather rounded (in fact, a thorough determination of the packing fraction related to the ordering transition would require a systematic finite-size study). Nevertheless, we can extract two important findings from these curves. First, considering our model rods with and , the behavior of the corresponding appears to be consistent with the fact that the isotropic-nematic transition for pure hard spherocylinders (of aspect ratio ) occurs at 58 (indeed, taking into account the same considerations made in section 3.2 concerning the comparison of spherocylinders and multi-sphere rods, the packing fraction related to the onset of nematic ordering follows from Ref. 58 as ). The second, and in the present context more important, finding concerns the influence of magnetic interactions. Indeed, we see that the functions are shifted towards lower packing fractions when is increased from zero. In other words, the nematic phase is stabilized (relative to the isotropic phase) due to magnetic interactions. This is is strong contrast to the behavior found in systems of dipolar spherocylinders 23, 24 (and other elongated particles with single, longitudinal dipoles 22), where the nematic state is rather suppressed.
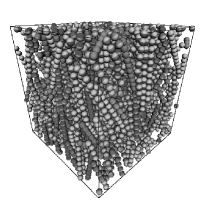
As an attempt to understand these differences, it is useful to consider the actual structure of the present MNR systems within their nematic state. A simulation snapshot is shown in Fig. 10 (left). Closer inspection reveals that there are both, antiparallel (Type II) configurations and shifted parallel (Type III) configurations, consistent with our considerations concerning the energy landscape in section 3.1. The ”coexistence” of these configurations is also illustrated by the sketch in the right part of Fig. 10. We suspect that it is particularly the presence of the shifted-parallel configurations, which could stabilize the nematic against the smectic-A phase formed in dense systems of (antiparallel oriented) single-dipolar elongated particles 23, 24.
 |
3.4 Effect of an external field
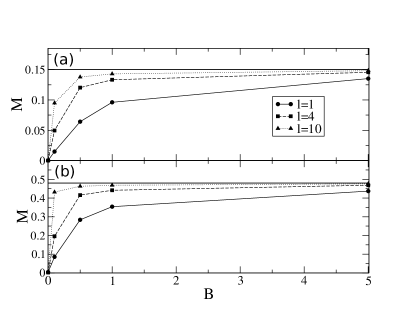
In this last section we briefly discuss the impact of a homogeneous, external magnetic field on the structure of our MNR systems. We start by considering the norm of the field-induced magnetization (M=, see eq. (13)). Results for the functions M at two packing fractions, various rod lengths and a fixed reduced dipole moment of are plotted in Fig. 11. For both values of considered, the longer rods are seen to be more susceptible than the shorter rods, in the sense that the magnetization rises more sharply with the field and reaches earlier its saturation value. We also see that a decrease of to zero leads to a vanishing of the magnetization in all cases considered, consistent with our result in section 3.3 that the order parameter is zero (no spontaneous magnetization).
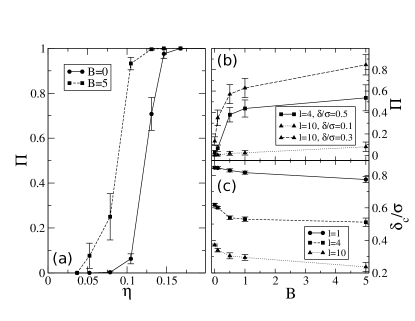
A further interesting question is to which extent the external field influences the percolation phase transition. Some representative results in this context are shown in Fig. 12. Specifically, in Fig. 12(a) we have plotted the percolation probability in a field of strength as a function of for rods of length and dipole moment . Comparing this curve with the corresponding zero-field result [, also included in Fig. 12(a)] we find that the percolation threshold is shifted towards lower packing fractions. In other words, the magnetic field supports the percolation transition in this system. In Fig. 12(b) we present data for the percolation probability as function of at a fixed packing fraction. An increase of enhances the percolation probability, consistent with our finding from Fig. 12(a). One also sees from Fig. 12(b) that the actual value of in presence of a field strongly depends on the rod length (consistent with the zero-field situation) as well as on the the parameter (determining our cluster criterion). To complement the discussion, we present in Fig. 12(c) results for the ”critical” distance as function of the field and different rod length, . For all lengths studied the value of decreases upon an increase of . This suggests that the percolation threshold is indeed reduced by the presence of an external field, regardless of the specific choice of .
Finally, it is worth to briefly comment on the particle structures observed in an external field. One general observation was that the structures of Type II (antiparallel local ordering) disappear, as expected from our results for the magnetization [see Fig. 11]. At the same time, structures of Type III become prevalent, along with a certain amount of Type I structures. The clusters that percolate under the effect of the external field do so in the direction of the field, that is, the system essentially percolates along one direction. This is in contrast to the zero-field situation, where the percolating clusters tend to span the simulation box in all three spatial directions. As a consequence, percolation in field leads to a strongly anisotropic network. This feature might become important e.g. for the design of systems with conductance anisotropy.
4 Conclusions
Based on MC computer simulations we have explored structure formation phenomena in systems of model magnetic nanorods composed of fused dipolar spheres. The particle model has been inspired by recent experiments 16, where MNRs have been produced via a self-assembly process. Compared to the experimental systems, we note that the longest rods considered in our simulations () have about half the length of their experimental counterparts (). This is because simulating longer rods would have required larger system sizes and thus much longer simulation (equilibration) times. Nevertheless, we are already in the realistic range. The same holds true for the range of reduced dipole moments () used in our simulations, which approaches the experimental value of (for rods composed of iron nanospheres at room temperature 16). Concerning the packing fractions, on the other hand, only the lowest value considered here () is close to current experiments 16 (). However, it is just the advantage of computer simulations that one can explore much larger parameter ranges.
Our simulation results generally reveal that the MNRs behave strongly different not only from systems of individual magnetic spheres, but also from non-magnetic rods or rod-like particles with single dipoles. Most of our results refer to systems in zero field. Compared to the case of magnetic spheres with central point dipoles (), we have found that the percolation threshold for is lowered towards significantly lower packing fractions. At the same time, the percolation thresholds are also much lower than those of non-magnetic rods of comparable lengths. These findings indicates that the MNRs could be promising candidates as building blocks of lightweight nanocomposites, i.e., connected materials with novel mechanical and conductivity properties. Moreover, for sufficiently large and densities beyond the percolation threshold, the MNRs display an isotropic-to-nematic transition, but no long-range ferromagnetic ordering, which is again in contrast to magnetic spheres. These differences regarding the percolation and ordering behavior can be explained, on a microscopic level, from the fact that the present MNRs display a larger variety of cluster structures. In particular, in addition to the usual head-to-tail ordering of dipolar spheres, we observe formation of local antiparallel ordering, as well as of parallel side-by-side ordering with shifted positions.
The presence of the latter type of clusters also represents one main difference to systems of rod-like particles with single (central, longitudinal) dipole moments. Indeed, this simpler model mainly exhibits compact clusters with local antiparallel ordering 24. As a consequence, these single-dipolar rods rather exhibit smectic (instead of nematic) phases 23, 24. From a more general perspective, our simulations results therefore suggest that the distribution of dipoles within the nanorods is of crucial importance for both, their percolation behavior and for the nature of ordered phases.
Finally, we have briefly discussed the impact of a static magnetic field. Our main conclusion in this context is that already relatively weak fields (with a strength of about mT) can again significantly lower the percolation threshold compared to the zero-field situation.
In the present paper we were concerned with the (interaction- or field-driven) structural behavior of the MNRs in thermal equilibrium. From an experimental point of view, it would be very interesting to explore the impact of these structural phenomena on the single-particle dynamics (e.g., the translational and rotational diffusion) and the rheological properties of the suspension (in particular its shear viscosity). Clearly, an investigation of these phenomena requires to supplement the MC simulations employed in the present work by computer simulations targeting the time-dependent behavior, such as Brownian dynamics. Work in these directions is in progress.
References
- Dormann et al. 1997 J. L. Dormann, D. Fiorani and E. Tronc, Adv. Chem. Phys., 1997, 98, 283.
- Biermann et al. 2007 M. J. Biermann, K. M. van Heuvelen, D. Schmeisser, T. C. Brunold and S. Jin, Adv. Mat., 2007, 19, 2677.
- Evans et al. 2007 B. A. Evans, A. R. Shields, R. L. Carroll, S. Washburn, M. R. Falvo and R. Superfine, Nano Lett., 2007, 7, 1428.
- Jung et al. 2003 S. W. Jung, W. I. Park, G.-C. Yi and M. Kim, Adv. Mat., 2003, 15, 1358.
- Shevchenko et al. 2006 E. V. Shevchenko, D. V. Talapin, N. A. Kotov, S. O. Brien and C. B. Murray, Nature, 2006, 439, 55.
- Kaiser et al. 2006 A. Kaiser, T. Gelbrich and A. M. Schmidt, J. Phys.: Condens. Matt., 2006, 18, S2563.
- Jurgons et al. 2006 R. Jurgons, C. Selinger, A. Hilpert, L. Trahms, S. Odenbach and C. Alexious, J. Phys.: Condens. Matt., 2006, 18, S2893.
- Weis and Levesque 1994 J.-J. Weis and D. Levesque, Phys. Rev. E, 1994, 49, 5131.
- Klokkenburg et al. 2006 M. Klokkenburg, R. P. A. Dullens, W. K. Kegel, B. H. Erna and A. P. Philipse, Phys. Rev. Lett., 2006, 96, 037203.
- De’Bell et al. 2000 K. De’Bell, A. B. MacIsaac and J. P. Whitehead, Rev. Mod. Phys., 2000, 72, 225.
- Jordanovic et al. 2011 J. Jordanovic, S. Jaeger and S. H. L. Klapp, Phys. Rev. Lett., 2011, 106, 038301.
- Heinrich et al. 2011 D. Heinrich, A. R. Goni, A. Smessaert, S. H. L. Klapp, L. M. C. Cerioni, T. M. Osan, D. J. Pusiol and T. C., Phys. Rev. Lett., 2011, 106, 208301.
- Philip et al. 2007 J. Philip, P. D. Shima and B. Raj, Appl. Phys. Lett., 2007, 91, 203108.
- Rosensweig 1985 R. E. Rosensweig, Ferrohydrodynamics, Cambridge University Press, Cambridge, 1985.
- Odenbach 2003 S. Odenbach, J. Phys.: Condens. Matt., 2003, 15, S1497.
- Birringer et al. 2008 R. Birringer, H. Wolf, C. Lang, A. Tschöpe and A. Michels, Z. Phys. Chem., 2008, 222, 229.
- Jemaire et al. 2002 B. J. Jemaire, P. Davidson, J. Ferre, J. P. Jamet, P. Panine, I. Dozov and J. P. Jolivet, Phys. Rev. Lett., 2002, 88, 125507.
- Vroege et al. 2006 G. J. Vroege, D. M. E. Thies-Weesie, A. V. Petukhov, B. J. Lemaire and P. Davidson, Adv. Mat., 2006, 18, 2565.
- Qi et al. 2003 Y. Qi, L. Zhang and W. Wen, Appl. Phys., 2003, 36, L10.
- Zhang et al. 2007 X. Zhang, Z. Zhang and S. C. Glotzer, J. Phys. Chem. C, 2007, 111, 4132.
- Zarragoicoechea et al. 1991 G. J. Zarragoicoechea, J.-J. Weis and D. Levesque, Mol. Phys., 1991, 74, 629.
- Levesque et al. 1993 D. Levesque, J.-J. Weis and G. J. Zarragoicoechea, Phys Rev E, 1993, 47, 496.
- Williamson and del Rio 1997 D. C. Williamson and F. del Rio, J. Chem. Phys., 1997, 107, 9549.
- McGrother et al. 1998 S. C. McGrother, A. Gil-Villegas and G. Jackson, Mol. Phys., 1998, 95, 657.
- Martel et al. 2001 R. Martel, V. Derycke, C. Lavoie, J. Appenzeller, K. K. Chan, J. Tersoff and P. Avouris, Phys. Rev. Lett., 2001, 87, 256805.
- Xueshen et al. 2009 W. Xueshen, L. Qunqing, X. Jing, J. Zhong, W. Jinyong, L. Yan, J. Kaili and F. Shoushan, Nano Lett., 2009, 9, 3137.
- Kyrylyuk et al. 2011 A. V. Kyrylyuk, M. C. Hermant, T. Schilling, B. Klumperman, C. E. Koning and P. van der Schoot, Nat. Nanotechnol., 2011, 6, 364.
- Coleman et al. 1998 J. N. Coleman, S. Curran, A. B. Dalton, A. P. Davey, B. McCarthy, W. Blau and R. C. Barklie, Phys. Rev. B, 1998, 58, R7492.
- Deng et al. 2009 Y. Deng, Y. Zhang, Y. Xiang, G. Wang and H. Xu, J. Mater. Chem., 2009, 19, 2058.
- Salvetat et al. 1999 J.-P. Salvetat, J.-M. Bonard, N. H. Thomson, A. J. Kulik, L. Forró, W. Benoit and L. Zuppiroli, Appl. Phys. A, 1999, 69, 255.
- Bug et al. 1985 A. L. R. Bug, S. A. Safran, G. S. Grest and I. Webman, Phys. Rev. Lett., 1985, 55, 1896.
- Ambrosetti et al. 2010 G. Ambrosetti, C. Grimaldi, I. Balberg, T. Maeder, A. Danani and P. Ryser, Phys. Rev. B, 2010, 81, 155434.
- Vigolo et al. 2005 B. Vigolo, C. Coulon, M. Maugey, C. Zakri and P. Poulin, Science, 2005, 309, 920.
- Schilling et al. 2007 T. Schilling, S. Jungblut and M. A. Miller, Phys. Rev. Lett., 2007, 98, 108303.
- Fang et al. 2007 W.-X. Fang, Z.-H. He, X.-Q. Xu, Z.-Q. Mao and H. Shen, Europhys. Lett., 2007, 77, 68004.
- Otten and van der Schoot 2012 R. H. J. Otten and P. van der Schoot, Phys. Rev. Lett., 2012, 108, 088301.
- De Las Cuevas et al. 2008 G. De Las Cuevas, J. Faraudo and J. Camacho, J. Phys. Chem. C, 2008, 112, 945.
- Zarragoicoechea et al. 1992 G. J. Zarragoicoechea, J.-J. Weis and D. Levesque, Mol. Phys., 1992, 75, 989.
- Satoh et al. 1996 K. Satoh, S. Mita and S. Kondo, Liq. Cryst., 1996, 20, 757.
- Houssa et al. 1998 M. Houssa, L. F. Rull and S. C. McGrother, J. Chem. Phys., 1998, 109, 9529.
- Satoh 2008 K. Satoh, Mol. Cryst. Liq. Cryst., 2008, 480, 202.
- de Leeuw et al. 1980 S. W. de Leeuw, J. W. Perram and E. R. Smith, Proc. R. Soc. London A, 1980, 373, 27.
- Orkoulas and Panagiotopoulos 1994 G. Orkoulas and A. Z. Panagiotopoulos, J. Chem. Phys., 1994, 101, 1452.
- Caillol et al. 1997 J.-M. Caillol, J.-J. Weis and D. Levesque, J. Chem. Phys., 1997, 107, 1565.
- Priezjeb and Pelcovitz 2001 N. B. Priezjeb and R. A. Pelcovitz, Phys. Rev. E, 2001, 63, 062702.
- Linse 2005 P. Linse, Adv. Polym. Sci., 2005, 185, 111.
- Liu and Luijten 2005 J. Liu and E. Luijten, Phys. Rev. E, 2005, 71, 066701.
- Whitelam and Geissler 2007 S. Whitelam and P. L. Geissler, J. Chem. Phys., 2007, 127, 154101.
- Mehrabi and Sahimi 2008 A. R. Mehrabi and M. Sahimi, J. Chem. Phys., 2008, 128, 234503.
- Almarza 2009 N. G. Almarza, J. Chem. Phys., 2009, 130, 184106.
- Das et al. 95 S. S. Das, A. P. Andrews and S. C. Greer, J. Chem. Phys., 95, 102, 2951.
- Schmidle et al. 2012 H. Schmidle, C. K. Hall, O. D. Velevb and S. H. L. Klapp, Soft Matter, 2012, 8, 1521.
- Blum and Torruella 1972 L. Blum and A. Torruella, J. Chem. Phys., 1972, 56, 303.
- Weis and Levesque 1993 J.-J. Weis and D. Levesque, Phys. Rev. E, 1993, 48, 3728.
- Weis and Levesque 1993 J.-J. Weis and D. Levesque, Phys. Rev. Lett., 1993, 71, 2729.
- Leung and Chandler 1991 K. Leung and D. Chandler, J. Stat. Phys., 1991, 63, 837.
- Allen et al. 1993 M. P. Allen, G. T. Evans, D. Frenkel and B. M. Mulder, Adv. Chem. Phys., 1993, 86, 1.
- Bolhuis and Frenkel 1997 P. Bolhuis and D. Frenkel, J. Chem. Phys., 1997, 106, 666.