Ground and excited states Gamow-Teller strength distributions of iron isotopes and associated capture rates for core-collapse simulations
Abstract
This paper reports on the microscopic calculation of ground and excited states Gamow-Teller (GT) strength distributions, both in the electron capture and electron decay direction, for 54,55,56Fe. The associated electron and positron capture rates for these isotopes of iron are also calculated in stellar matter. These calculations were recently introduced and this paper is a follow-up which discusses in detail the GT strength distributions and stellar capture rates of key iron isotopes. The calculations are performed within the framework of the proton-neutron quasiparticle random phase approximation (pn-QRPA) theory. The pn-QRPA theory allows a microscopic state-by-state calculation of GT strength functions and stellar capture rates which greatly increases the reliability of the results. For the first time experimental deformation of nuclei are taken into account. In the core of massive stars isotopes of iron, 54,55,56Fe, are considered to be key players in decreasing the electron-to-baryon ratio () mainly via electron capture on these nuclide. The structure of the presupernova star is altered both by the changes in and the entropy of the core material. Results are encouraging and are compared against measurements (where possible) and other calculations. The calculated electron capture rates are in overall good agreement with the shell model results. During the presupernova evolution of massive stars, from oxygen shell burning stages till around end of convective core silicon burning, the calculated electron capture rates on 54Fe are around three times bigger than the corresponding shell model rates. The calculated positron capture rates, however, are suppressed by two to five orders of magnitude.
Keywords pn-QRPA theory; GT strength distributions; weak interaction; electron and positron capture rates; presupernova evolution of massive stars
1 Introduction
Supernovae of Type Ia and Type II are considered to be the two major contributors to the production of elements in the universe (see for example, Arn96 ). Stars in mass range ( denotes the solar mass) end their life as white dwarfs. The ultimate destiny of more massive stars is even more interesting. Once the mass of the iron core exceeds the Chandrasekhar limit the Pauli principle applied to electrons cannot prevent further gravitational collapse to an even more exotic and denser form of matter than in a white dwarf star. A violent collapse of the core is initiated which ultimately leads to a spectacular supernova explosion (where the luminosity of the star becomes comparable to that of an entire galaxy containing around stars). The supernova leaves behind a compressed ball of hot neutrons – a neutron star. As the hot neutron star cools, any further collapse is prevented by the Pauli principle applied to the neutrons, unless the mass is so great that the star can become a black hole. The structure of the progenitor star has a vital role to play in the mechanism of the explosion. Core-collapse simulators, to-date, find it challenging to convert the collapse into a successful explosion. A lot many physical inputs are required at the beginning of each stage of the entire simulation process including but not limited to collapse of the core, formation, stalling and revival of the shock wave and shock propagation. It is highly desirable to calculate the presupernova stellar structure with the most reliable physical data and inputs.
A smaller precollapse iron core mass and a lower entropy should favor an explosion. A smaller iron core size implies less energy loss by the shock in photodisintegrating the iron nuclei in the overlying onion-like structure whereas a lower entropy environment can assist to achieve higher densities for the ensuing collapse generating a stronger bounce and in turn forming a more energetic shock wave Bet79 . A smaller entropy also helps in reducing the abundance of free protons thereby lowering the electron capture rates on these free protons and resulting in a much higher value of at the time of bounce (at this instant of time the iron core collapses to supranuclear density and rebounds creating a shock wave). As a result, the shock energy
| (1) |
is larger for larger final lepton fraction (prior to collapse) and larger difference of initial and final lepton fraction.
Electron/positron captures and -decays are amongst the most important nuclear physics inputs that determine both the and the entropy at the presupernova stage. These nuclear weak-interaction mediated reactions directly affect the lepton-to-baryon ratio. Further the neutrinos and antineutrinos produced as a result of these nuclear reactions are transparent to the stellar matter at presupernova densities and therefore assist in cooling the core to a lower entropy state. These weak-interaction rates are required not only in the accurate determination of the structure of the stellar core but also bear significance in (explosive) nucleosynthesis and element abundance calculations. As such it is imperative to follow the evolution of the presupernova collapse stage with a sufficiently detailed and reliable (microscopically calculated taking into account the nuclear structure details of the individual nuclei) nuclear reaction network that include these weak-interaction mediated rates. Weak interactions in presupernova stars are known to be dominated by allowed Fermi and Gamow-Teller (GT) transitions Bet79 . The exact r-process yields from Type II SNe are not known and are related to the complete understanding of the mechanism of these supernova explosions. Electron capture process is one of the essential ingredients involved in the complex dynamics of core-collapse supernovae and a reliable estimate of these rates can certainly contribute in a better understanding of the explosion mechanism.
SNe Ia are thought to be the explosions of white dwarfs that accrete matter from binary companions and are intensively investigated for their accurate calibration as the cosmological standard candles (one needs to predict the SN Ia peak luminosity at least with a 10 precision). These explosions are also important for stellar nucleosynthesis and are strongly contested to be the main producers of Fe peak elements in the Galaxy Iwa99 . The abundance of the Fe group, in particular of neutron rich species, is highly sensitive to the electron captures taking place in the central layers of SNe Ia explosions Iwa99 . These captures drive the matter to larger neutron excesses and thus strongly influence the composition of ejected matter and the dynamics of the explosion. It is highly probable that electron capture occurs in the burning front driving the matter to large neutron excess. In particular, GT properties of nuclei in the region of medium masses around A=56 are of special importance because they are the main constituents of the stellar core in presupernova conditions.
The GT transition is one of the most important nuclear weak processes of the spin-isospin () type. This charge exchange transition is not only subject of interest in nuclear physics but also of great importance in astrophysics. The GT transitions are involved in many weak processes occurring in nuclei, e.g. nucleosynthesis and stellar core collapse of massive stars preceding the supernova explosion. In the early stages of the collapse, the electron capture and -decay are important processes. These reactions are dominated by GT (and also by Fermi) transitions. Electron (positron) capture rates are very sensitive to the distribution of the GT+ (GT-) strength. In the GT+ strength, a proton is changed into a neutron (the plus sign is for the isospin raising operator (), present in the GT matrix elements, which converts a proton into a neutron). On the other hand the GT- strength is responsible for transforming a neutron into a proton (the minus sign is for the isospin lowering operator () which converts a neutron into a proton). The total GT+ strength is proportional to the electron capture strength Roe93 .
GT+ strength distributions on nuclei in the mass range A = 50 – 65 have been studied experimentally mainly via (n,p) charge exchange reactions at forward angles (e.g. Roe93 ; Vet89 ; Elk94 ). Similarly GT- strength distributions were studied keenly using the (p,n) reactions (e.g. Vet89 ; Rap83 ; And90 ). It has been shown that for (p,n) and (n,p) reactions the 00 cross sections for such transitions are proportional to the squares of the matrix elements for the GT decay between the same states (e.g. Goo80 ). Results of these measurements show that, in contrast to the independent particle model, the total GT strength is quenched and fragmented over many final states in the daughter nucleus. Both these effects are caused by the residual interaction among the valence nucleons and an accurate description of these correlations is essential for a reliable evaluation of the stellar weak interaction rates due to the strong phase space energy dependence, particularly of the stellar electron capture rates.
Fuller, Fowler and Newman (FFN) Ful82 performed the first-ever extensive calculation of stellar weak rates including the capture rates, neutrino energy loss rates and decay rates for a wide density and temperature domain. They performed this detailed calculations for 226 nuclei in the mass range . They stressed on the importance of the Gamow-Teller (GT) giant resonance strength in the capture of the electron and estimated the GT centroids using zeroth-order ( ) shell model. Both the decay and capture rates are exponentially sensitive to the location of the GT centroid Auf96 . The location of the GT resonance affects the stellar rates exponentially, while the total strength affects them linearly Auf96 . Few years later Aufderheide et al. Auf94 extended the FFN work for heavier nuclei with A 60 and took into consideration the quenching of the GT strength neglected by FFN. They tabulated the 90 top electron capture nuclei averaged throughout the stellar trajectory for (see Table. 25 therein). Later the experimental results of Refs. Roe93 ; Vet89 ; Elk94 ; Rap83 ; And90 revealed the misplacement of the GT centroid adopted in the parameterizations of Ref. Ful82 . Since then theoretical efforts were concentrated on the microscopic calculations of GT strength distributions and associated weak-interaction mediated rates specially for iron-regime nuclide. Large-scale shell model (LSSM)(e.g. Lan00 ) and the proton-neutron quasiparticle random phase approximation theory (pn-QRPA) (e.g. Nab04 ) were used extensively and with relative success for the microscopic calculation of stellar weak rates. Monte Carlo shell-model is an alternative to the diagonalization method and allows calculation of nuclear properties as thermal averages (e.g. Joh92 ). However it does not allow for detailed nuclear spectroscopy and has some restrictions in its applications for odd-odd and odd-A nuclei.
The pn-QRPA theory is an efficient way to generate GT strength distributions. These strength distributions constitute a primary and nontrivial contribution to the capture rates among iron-regime nuclide. The usual RPA was formulated for excitations in the same nucleus. Halbleib and Sorenson Hal67 generalized this model to describe charge-changing transitions of the type and pn-QRPA first came into existence more than 40 years ago. The model was extended to deformed nuclei (using Nilsson-model wave functions) by Krumlinde and Möller Kru84 . Extension of the model to treat odd-odd nuclei and transitions from nuclear excited states was done by Muto and collaborators Mut92 .
Nabi and Klapdor-Kleingrothaus used the pn-QRPA theory to calculate the stellar weak interaction rates over a wide range of temperature and density scale for sd- Nab99 and fp/fpg-shell nuclei Nab04 in stellar matter (see also Ref. Nab99a ). These included the weak interaction rates for nuclei with A = 40 to 44 (not yet calculated by shell model). Since then these calculations were further refined with use of more efficient algorithms, computing power, incorporation of latest data from mass compilations and experimental values, and fine-tuning of model parameters Nab05 ; Nab07 ; Nab07a ; Nab07b ; Nab08 ; Nab08a ; Nab08b ; Nab09 ; Nab10 ; Nab10a . There is a considerable amount of uncertainty involved in all types of calculations of stellar weak interactions. The uncertainty associated with the microscopic calculation of the pn-QRPA model was discussed in detail in Ref. Nab08b . The reliability of the pn-QRPA calculations was discussed in length by Nabi and Klapdor-Kleingrothaus Nab04 . There the authors compared the measured data (half lives and B(GT±) strength) of thousands of nuclide with the pn-QRPA calculations and got fairly good comparison.
Three key isotopes of iron, 54,55,56Fe, were selected for the calculation of GT± strength distributions and associated stellar electron and positron capture rates in this phase of the project. Whereas sufficient experimental data are available for the even-even 54,56Fe isotopes to test the model, 55Fe has low-lying excited states which have a finite probability of occupation in stellar conditions and a microscopic calculation of GT± strengths from these excited states is desirable. Aufderheide and collaborators Auf94 ranked 54,55,56Fe amongst the most influential nuclei with respect to their importance for the electron capture process for the early presupernova collapse. Later Heger et al. Heg01 studied the presupernova evolution of massive stars (of masses and ) and rated 54,55,56Fe amongst top seven nuclei considered to be most important for decreasing in and stars. In stars these isotopes of iron were ranked as the top three key nuclei that play the biggest role in decreasing . These isotopes of iron are mainly responsible for decreasing the electron-to-baryon ratio during the oxygen and silicon burning phases. Besides, 55Fe was also found to be in the top five list of nuclei that increase via positron capture and electron decay during the silicon burning phases. This paper presents the detailed analysis of the improved microscopic calculation of GT± strength distributions. Details of calculation of stellar electron and positron capture rates for these three isotopes of iron using the pn-QRPA model are also furnished in this manuscript. Comparisons against previous calculations are also presented. These improved calculations were introduced recently in Ref. Nab09 where it was reported that the betterment resulted mainly from the incorporation of measured deformation values for these nuclei. The idea is to present an alternate microscopic and accurate estimate of weak interaction mediated rates to the collapse simulators which may be used as a reliable source of nuclear physics input to the simulation codes.
The next section briefly describes the theoretical formalism used to calculate the GT strength distributions and the associated electron positron capture rates. The calculated GT± strength distributions are presented and compared with measurements and against other calculations in Sec. 3. The pn-QRPA calculated electron and positron capture rates for iron isotopes (54,55,56Fe) are presented and explored in Sec. 4. The main conclusions of this work are finally presented in Sec. 5.
2 Model Description
The Hamiltonian for the pn-QRPA calculations was taken to be of the form
| (2) |
where is the single-particle Hamiltonian (single particle energies and wave functions were calculated in the Nilsson model, which takes into account nuclear deformations), is the pairing force (pairing was treated in the BCS approximation), is the particle-hole (ph) GT force, and is the particle-particle (pp) GT force. The proton-neutron residual interactions occurred as particle-hole and particle-particle interaction. The interactions were given separable form and were characterized by two interaction constants and , respectively. In this work, the values of and was taken as 0.15 MeV and 0.07 MeV, respectively. Details of choice of these GT strength parameters in the pn-QRPA model can be found in Refs. Sta90 ; Hir93 . Other parameters required for the calculation of weak rates are the Nilsson potential parameters, the pairing gaps, the deformations, and the Q-values of the reactions. Nilsson-potential parameters were taken from Ref. Nil55 and the Nilsson oscillator constant was chosen as (the same for protons and neutrons). The calculated half-lives depend only weakly on the values of the pairing gaps Hir91 . Thus, the traditional choice of was applied in the present work. The deformation parameter is recently argued to be one of the most important parameters in pn-QRPA calculations Ste04 and as such rather than using deformations calculated from some theoretical mass model (as used in earlier calculations of pn-QRPA capture rates) the experimentally adopted value of the deformation parameters for 54,56Fe, extracted by relating the measured energy of the first excited state with the quadrupole deformation, was taken from Raman et al. Ram87 . The incorporation of experimental deformations lead to an overall improvement in the calculation as discussed earlier in Ref. Nab09 . For the case of 55Fe (where measurement lacks) the deformation of the nucleus was calculated as
| (3) |
where and are the atomic and mass numbers, respectively and is the electric quadrupole moment taken from Ref. Moe81 . Q-values were taken from the recent mass compilation of Audi et al. Aud03 .
Capture rates on for the following two processes mediated by charge weak interaction were calculated:
-
1.
Electron capture
-
-
2.
Positron capture
-
The electron capture (ec) and positron capture (pc) rates of a transition from the state of the parent to the state of the daughter nucleus are given by
| (4) |
The value of D was taken to be 6295s Yos88 . are the sum of reduced transition probabilities of the Fermi B(F) and GT transitions B(GT). Whereas for 54,56Fe phonon transitions contribute, in the case of 55Fe (odd-A case) two kinds of transitions are possible. One are the phonon transitions, where the odd quasiparticle acts as spectator and the other is the transitions of the odd quasiparticle itself. In the later case phonon correlations were introduced to one-quasiparticle states in first-order perturbation Mut89 . The are the phase space integrals. Details of the calculations of phase space integrals and reduced transition probabilities can be found in Ref. Nab99 . In Eq. (4) is the effective ratio of axial and vector coupling constants and takes into account the observed quenching of the GT strength Ost92 . For this project was taken (from Ref. Gaa83 ) as:
| (5) |
with = -1.254 Rod06 . Interestingly, Vetterli and collaborators Vet89 and Rönnqvist et al. Roe93 predicted the same quenching factor of 0.6 for the RPA calculation in the case of 54Fe when comparing their measured strengths to RPA calculations.
The total electron (positron) capture rate per unit time per nucleus was then calculated using
| (6) |
The summation over all initial and final states was carried out until satisfactory convergence in the rate calculations was achieved. Here is the probability of occupation of parent excited states and follows the normal Boltzmann distribution. The pn-QRPA theory allows a microscopic state-by-state calculation of both sums present in Eq. (6). This feature of the pn-QRPA model greatly increases the reliability of the calculated rates in stellar matter where there exists a finite probability of occupation of excited states.
In order to further increase the reliability of the calculated capture rates experimental data were incorporated in the calculation wherever possible. In addition to the incorporation of the experimentally adopted value of the deformation parameter, the calculated excitation energies (along with their log values) were replaced with an experimental one when they were within 0.5 MeV of each other. Missing measured states were inserted and inverse and mirror transitions (if available) were also taken into account. No theoretical levels were replaced with the experimental ones beyond the excitation energy for which experimental compilations had no definite spin and/or parity. A state-by-state calculation of GT± strength was performed for a total of 246 parent excited states in 54Fe, 297 states for 55Fe and 266 states for 56Fe. For each parent excited state, transitions were calculated for 150 daughter excited states using the pn-QRPA model. The band widths of energy states were chosen according to the density of states to cover an excitation energy of (15-20) MeV in parent and daughter nuclei. The summation in Eq. (6) was done to ensure satisfactory convergence. The use of a separable interaction assisted in the incorporation of a luxurious model space of up to 7 major oscillator shells which in turn made possible to consider these many excited states both in parent and daughter nuclei.
3 GT± strength distributions
The isovector response of nuclei may be studied using the nucleon charge-exchange reactions or ; by other reactions such as He,t), (d,2He) or through heavy ion reactions. The GT cross sections ( excitations) are proportional to the analogous beta-decay strengths. Charge-exchange reactions at small momentum transfer can therefore be used to study beta-decay strength distributions when beta-decay is not energetically possible. The reactions probes the GT- strength (corresponding to beta-minus decay) and the reactions gives the strength for -decay, i.e. GT+ strength. The study of reactions has the advantage over -decay measurements in that the GT- strength can be investigated over a large region of excitation energy in the residual nucleus. On the other hand the reactions populates only states in all nuclei heavier than 3He. This means that other final states (including the isobaric analog resonance) are forbidden and GT+ transitions can be observed relatively free of background. The study of these reactions suggest that a reduction in the amount of GT strength is observed relative to theoretical calculations. The GT quenching is on the order of 30-40 Vet89 .
In a sense both -decay and capture rates are very sensitive to the location of the GT+ centroid. An experiment on a nucleus shows where in the GT+ centroid corresponding to the ground state of resides. Each excited state of has its own GT+ centroid in and all of these resonances must be included in the stellar rates. We do not have the ability to measure these resonances. Turning to theory we see that the pioneer calculation done by FFN Ful82 had to revert to approximations in the form of Brink’s hypothesis and ”back resonances” to include all resonances in their calculation. Brink’s hypothesis states that GT strength distribution on excited states is identical to that from ground state, shifted only by the excitation energy of the state. GT back resonances are the states reached by the strong GT transitions in the inverse process (electron capture) built on ground and excited states. Even the microscopic large-scale shell model calculations Lan00 had to use the Brink assumption to include all states and resonances. On the other hand the pn-QRPA model provides a microscopic way of calculating the GT+ centroid and the total GT+ strength for all parent excited states and can lead to a fairly reliable estimate of the total stellar rates.
| Models | ||||
|---|---|---|---|---|
| pn-QRPA | 7.56 | 4.26 | 10.74 | 3.71 |
| Experiment | 7.5 | 3.5 | 9.9 | 2.9 |
| LSSM | 7.11 | 3.56 | 9.80 | 2.70 |
As a starting point, the model was tested for the case of 54,56Fe where measurements of total GT± strength are available. As mentioned earlier an overall quenching factor of 0.6 Gaa83 was adopted in the calculation of GT strength in both directions for all isotopes of iron. There is a considerable amount of uncertainties present in all calculations of stellar rates. The associated uncertainties in the pn-QRPA model was discussed in Ref. Nab08b . Keeping in mind the uncertainties present also in measurements where various energy cutoffs are used as a reasonable upper limit on the energy at which GT strength could be reliably related to measured cross-sections, Table 1 presents the comparison of the total GT± strengths against measurements and large-scale shell model calculations Lan00 (referred to as LSSM throughout this and proceeding sections) for the case of 54,56Fe. Throughout this paper all energies are given in units of MeV. For the case of 54Fe the value of the total GT+ was taken from Ref. Roe93 whereas the total measured GT- was taken from Ref. And90 . The total GT- strength calculated using the pn-QRPA model matches very well with the measured strength (Vetterli and collaborators Vet89 also reported a value of 7.5 1.2 as the total measured GT- strength for 54Fe). The calculated total GT+ strength lies close to the upper bound of the measured value and are higher than the corresponding LSSM calculated strength. For the case of 56Fe, the measured values of the total GT+ was taken from the latest measurement by El-Kateb and collaborators Elk94 . The total measured GT- was taken from Ref. Rap83 . In this case the calculated strengths are relatively more enhanced as compared to LSSM calculated strengths.
As mentioned earlier the calculated rates are sensitive to the location of the GT+ centroid. For the case of 54Fe, the calculated centroid of 4.06 MeV Nab09 is much higher than the LSSM centroid of 3.78 MeV. The numbers are to be compared to the experimental value of 3.7 0.2 MeV which was calculated from the measured data presented in Ref. Roe93 . For 56Fe, the pn-QRPA model calculated the centroid at an excitation energy of 3.13 MeV Nab09 in the daughter nucleus 56Mn whereas LSSM calculated it at an excitation energy of 2.60 MeV. The centroid extracted from the experimental data of El-Kateb et al. Elk94 comes out to be 2.9 0.2 MeV. Experimental (p,n) data are also available for 54,56Fe. According to Anderson and collaborators And90 a large uncertainty exists in the (p,n) measurements and the authors were able to perform measurements on 54Fe at 135 MeV with significantly better energy resolution than the earlier measurements. Further whereas the GT strength in the discrete peaks were extracted accurately, it was reported that the amount of GT strength in the background and continuum remained highly uncertain. For the sake of completeness a comparison of GT- centroids is also discussed below. The centroid of the data of discrete peaks (presented in Table I of Ref. And90 ) was calculated to be 7.63 for 54Fe which is to be compared with the much lower pn-QRPA calculated value of 5.08. For the case of 56Fe, the calculated centroid from the data reported by Rapaport et al. Rap83 comes out to be 8.27. The corresponding pn-QRPA calculated value is 5.61. Despite greater experimental certainties in the (p,n) data one notes that the pn-QRPA calculates the centroid at much lower energies in daughter nuclei as compared to measurements. However it is to be noted that the total strengths (in both direction) compares very well with the measured values. Also the location of GT+ centroid is in very good agreement with the measured data which is mainly responsible for the calculation of electron capture rates on iron isotopes. For reasons not known to the author, LSSM did not present the location of GT- centroids in their paper.
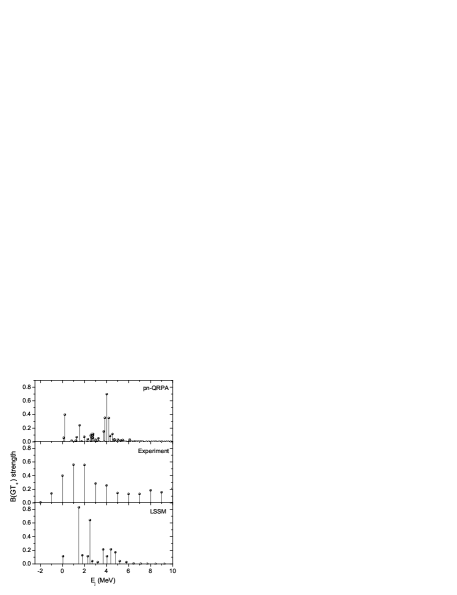
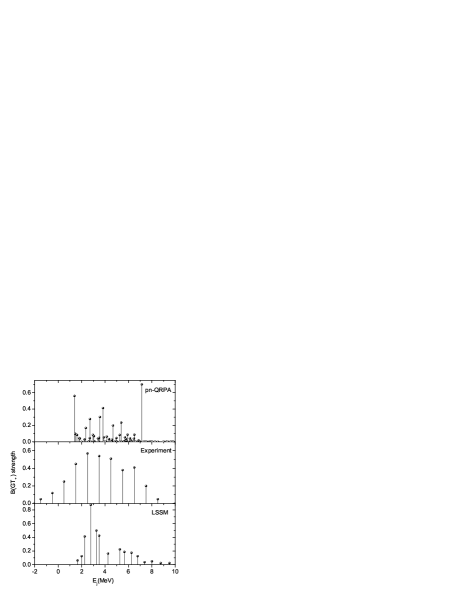
The GT+ strength distribution for 54Fe and 56Fe are depicted in Fig. 1 and Fig. 2, respectively. The upper panel displays the calculated GT+ distribution using the pn-QRPA model. The middle panel shows the measured data and the bottom panel gives the corresponding LSSM strength distributions. One notes that an appreciable measured strength lies in the daughter excitation energies up to around 10 MeV. The LSSM strength peaks at much lower excitation energy. The pn-QRPA distribution spreads over higher excitation energies akin to measured strength with a peak around 7.1 MeV for the case of 54Fe. For the case of 56Fe the pn-QRPA calculated spread is not as good as in case of 54Fe. Nonetheless the pn-QRPA calculates its peak around 4 MeV much higher in energy than the LSSM peak accumulating all the measured higher lying strength in a narrow resonance region.
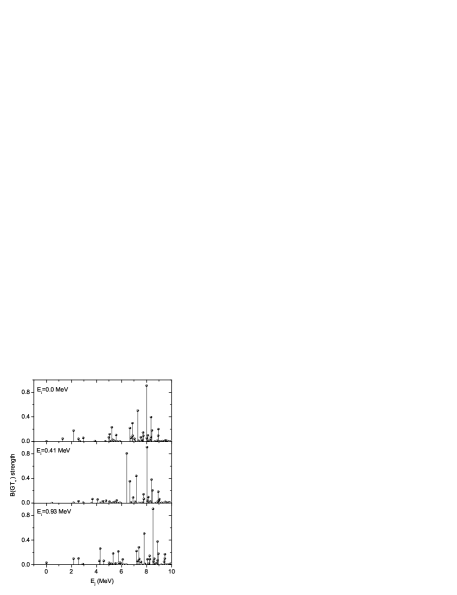
Fig. 3 shows the calculated GT+ strength distribution for 55Fe. Here no experimental GT distribution was available for comparison. Instead the calculated strength for ground and first two excited states of 55Fe (at 0.41 MeV and 0.93 MeV, respectively) is displayed. It may be seen from Fig.3 that the GT strength is fragmented over many daughter excited states and peaks at relatively high excitation energies (around 8 MeV) in the daughter 55Mn.
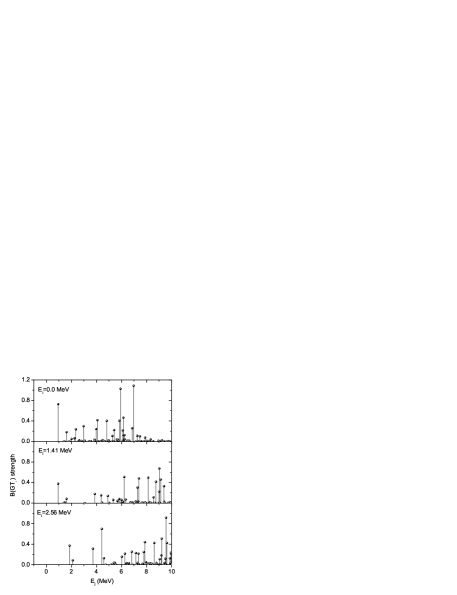
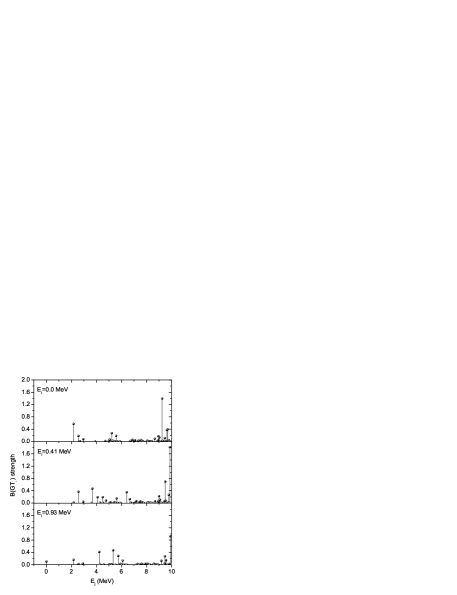
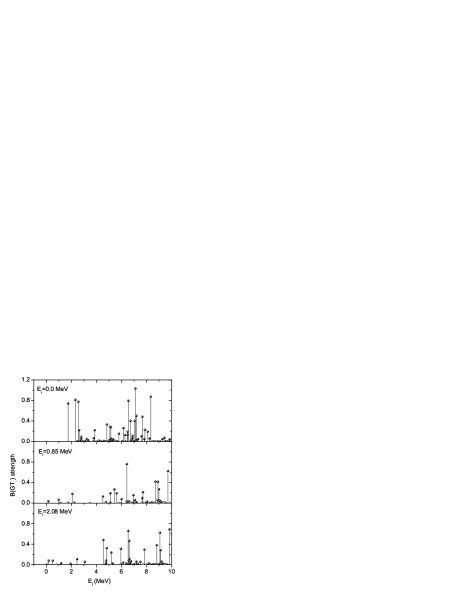
Figs. 4, 5 and 6 display the GT- strength distributions for the ground and first two calculated excited states of 54Fe, 55Fe and 56Fe, respectively. One notes the enhancement in the total strength in the GT- direction. For the case of 54Fe the peaks shift to higher excitation energy in daughter for parent excited states. Correspondingly the energy centroids shift to higher energy for these excited states. For the case of 55Fe one notes that bulk of the strength resides in a narrow resonance region around 10 MeV in daughter. In the case of 56Fe the low-lying peaks become considerably small in magnitude for the parent excited states. Figs. 1, 2, 3, 4, 5, and 6 confirm that the calculated strength is fragmented and well spread. At low temperatures and densities these low-lying discrete strengths may very well dominate the rates and play an important role in the state-by-state evaluation of both sums (see Eq. (6)).
The ground and excited states strength functions calculated within the framework of the pn-QRPA model are required in the microscopic calculation of stellar capture rates. The ASCII files of the GT± strength distributions for all parent excited states are available and can be requested from the author.
4 Electron and positron capture rates
This section presents and explores the results of the calculated electron and positron capture rates on 54,55,56Fe in stellar environment and also compare the pn-QRPA capture rates with the LSSM calculation and against the pioneering calculation of FFN Ful82 . As discussed earlier ground and excited states GT strengths calculated earlier contribute in the state-by-state calculation of electron and positron capture rates (via Eq. 4).
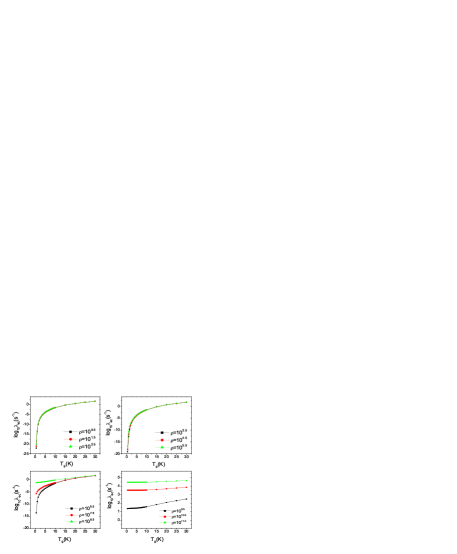
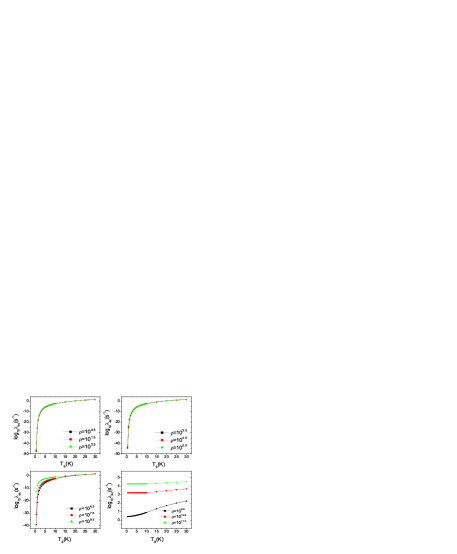
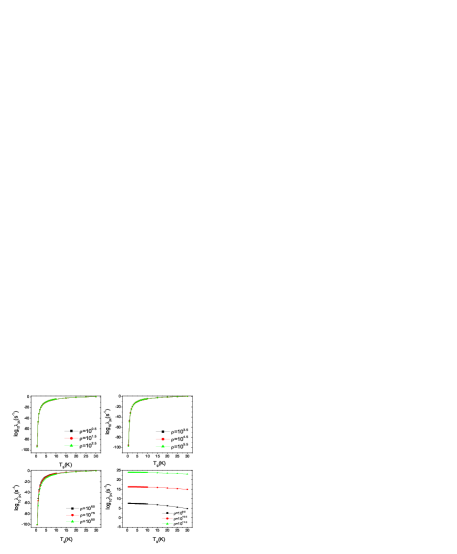
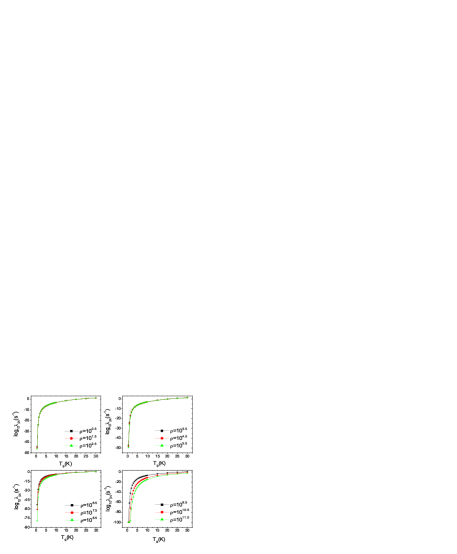
Figs. 7, 8 and 9 show the calculated electron capture rates on 54,55,56Fe. These figures show four panels depicting the calculated electron capture rates at selected temperature and density domain. The upper left panel shows the electron capture rates in low-density region ( and ), the upper right in medium-low density region ( and ), the lower left in medium-high density region ( and ) and finally the lower right panel depicts the calculated electron capture rates in high density region ( and ). The electron capture rates are given in logarithmic scales (to base 10) in units of . T9 gives the stellar temperature in units of K. Figs. 7 and 9 are similar in nature depicting the electron capture rates on even-even isotopes of iron. The rates are relatively enhanced for the case of 55Fe by orders of magnitude (for the first three panels). It can be seen from these figures that in the low density regions the capture rates, as a function of temperature, are more or less superimposed on one another. This means that there is no appreciable change in the rates when increasing the density by an order of magnitude. However as one goes from the medium-low density region to high density region these rates start to ’peel off’ from one another. Orders of magnitude difference in rates are observed (as a function of density) in high density region. For a given density the rates increase monotonically with increasing temperatures. For all three isotopes of iron, the calculated electron capture rates are noticeably bigger than the competing decay rates and dominate the weak rates for charge-decreasing nuclear transitions in stellar matter.
| (10,1) | 2.89E-18 | 1.61E-03 | 3.32E-51 | 2.83E-04 |
|---|---|---|---|---|
| (10,3) | 7.49E-08 | 4.10E-01 | 5.44E-18 | 1.71E-01 |
| (10,10) | 1.16E-02 | 4.69E-01 | 1.53E-05 | 2.69E-01 |
| (10,30) | 2.89E+00 | 5.77E-02 | 3.03E-01 | 5.22E-02 |
| (,1) | 4.88E-18 | 1.61E-03 | 1.97E-51 | 2.83E-04 |
| (,3) | 7.51E-08 | 4.10E-01 | 5.44E-18 | 1.71E-01 |
| (,10) | 1.16E-02 | 4.69E-01 | 1.53E-05 | 2.69E-01 |
| (,30) | 2.89E+00 | 5.77E-02 | 3.03E-01 | 5.22E-02 |
| (,1) | 3.22E-12 | 7.91E-02 | 2.97E-57 | 2.83E-04 |
| (,3) | 3.90E-06 | 4.96E-01 | 1.05E-19 | 1.71E-01 |
| (,10) | 1.45E-02 | 4.71E-01 | 1.22E-05 | 2.69E-01 |
| (,30) | 2.92E+00 | 5.77E-02 | 3.01E-01 | 5.22E-02 |
| (,1) | 2.56E+04 | 1.00E+00 | 7.98E-172 | 2.83E-04 |
| (,3) | 2.56E+04 | 9.95E-01 | 3.49E-58 | 1.71E-01 |
| (,10) | 1.93E+04 | 7.12E-01 | 1.49E-17 | 2.69E-01 |
| (,30) | 3.14E+03 | 7.06E-02 | 4.12E-05 | 5.20E-02 |
| (10,1) | 3.85E-10 | 9.98E-01 | 1.71E-32 | 2.48E-08 |
|---|---|---|---|---|
| (10,3) | 6.85E-07 | 3.56E-01 | 1.47E-12 | 2.01E-02 |
| (10,10) | 2.93E-03 | 1.53E-01 | 1.72E-04 | 2.35E-01 |
| (10,30) | 1.51E+00 | 2.56E-02 | 3.61E-01 | 2.34E-02 |
| (,1) | 6.51E-10 | 9.98E-01 | 1.01E-32 | 2.48E-08 |
| (,3) | 6.86E-07 | 3.56E-01 | 1.47E-12 | 2.01E-02 |
| (,10) | 2.93E-03 | 1.53E-01 | 1.72E-04 | 2.35E-01 |
| (,30) | 1.51E+00 | 2.56E-02 | 3.62E-01 | 2.34E-02 |
| (,1) | 1.22E-05 | 9.99E-01 | 1.53E-38 | 2.48E-08 |
| (,3) | 2.90E-05 | 4.28E-01 | 2.83E-14 | 2.01E-02 |
| (,10) | 3.68E-03 | 1.54E-01 | 1.37E-04 | 2.35E-01 |
| (,30) | 1.52E+00 | 2.56E-02 | 3.59E-01 | 2.34E-02 |
| (,1) | 2.25E+04 | 9.92E-01 | 4.11E-153 | 2.48E-08 |
| (,3) | 1.83E+04 | 8.07E-01 | 9.44E-53 | 2.01E-02 |
| (,10) | 8.43E+03 | 3.35E-01 | 1.67E-16 | 2.35E-01 |
| (,30) | 2.08E+03 | 4.03E-02 | 4.94E-05 | 2.33E-02 |
| (10,1) | 8.33E-27 | 4.70E-01 | 6.49E-37 | 7.01E-08 |
|---|---|---|---|---|
| (10,3) | 1.59E-10 | 5.69E-01 | 2.26E-13 | 1.77E-02 |
| (10,10) | 1.60E-03 | 4.07E-01 | 3.80E-04 | 3.21E-01 |
| (10,30) | 1.52E+00 | 5.33E-02 | 9.90E-01 | 5.77E-02 |
| (,1) | 1.41E-26 | 4.70E-01 | 3.84E-37 | 7.01E-08 |
| (,3) | 1.59E-10 | 5.69E-01 | 2.25E-13 | 1.77E-02 |
| (,10) | 1.60E-03 | 4.07E-01 | 3.80E-04 | 3.21E-01 |
| (,30) | 1.52E+00 | 5.33E-02 | 9.91E-01 | 5.77E-02 |
| (,1) | 9.30E-21 | 4.77E-01 | 5.82E-43 | 7.01E-08 |
| (,3) | 8.28E-09 | 5.71E-01 | 4.34E-15 | 1.77E-02 |
| (,10) | 2.01E-03 | 4.07E-01 | 3.03E-04 | 3.20E-01 |
| (,30) | 1.53E+00 | 5.33E-02 | 9.83E-01 | 5.77E-02 |
| (,1) | 1.80E+04 | 1.00E+00 | 1.56E-157 | 7.01E-08 |
| (,3) | 1.74E+04 | 9.64E-01 | 1.45E-53 | 1.77E-02 |
| (,10) | 1.14E+04 | 6.03E-01 | 3.70E-16 | 3.18E-01 |
| (,30) | 2.13E+03 | 6.35E-02 | 1.35E-04 | 5.74E-02 |
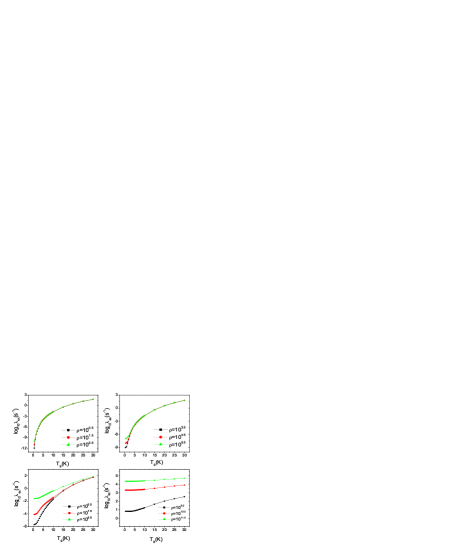
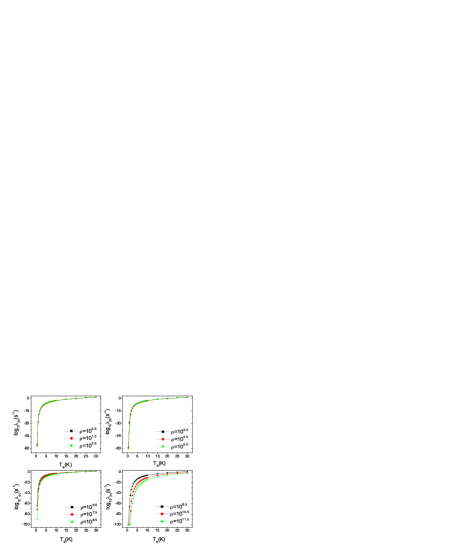
The effects of positron capture are estimated to be smaller for stars in the mass range and could be greater for more massive stars Heg01 . The positron capture rates are normally bigger than the competing rates for all isotopes of iron specially at high temperatures. Figs. 10, 11 and 12 again show four panels depicting the calculated positron capture rates at selected temperature and density domain. The upper left panel shows the positron capture rates in low-density region ( and ), the upper right in medium-low density region ( and ), the lower left in medium-high density region ( and ) and finally the lower right panel depicts the calculated positron capture rates in high density region ( and ). The positron capture rates are given in logarithmic scales in units of . T9 gives the stellar temperature in units of K. One should note the order of magnitude enhancement in positron capture rates as the stellar temperature increases. Around presupernova temperatures the positron capture rates are very slow as compared to the corresponding electron capture rates. When the temperature of the stellar core increases further the positron capture rates shoot up. The positron capture rates decrease with increasing densities, in contrast to the electron capture rates which increase as density increases. As temperature rises or density lowers (the degeneracy parameter is negative for positrons), more and more high-energy positrons are created leading in turn to higher capture rates. It is worth mentioning that the positron capture rates are very small numbers and can change by orders of magnitude by a mere change of 0.5 MeV, or less, in parent or daughter excitation energies and are more reflective of the uncertainties in the calculation of energies.
In order to present an estimate of the contribution of excited states to the total capture rate, the ground state capture rate and the ratio of this rate to the total rate were computed at selected points of stellar temperature and density. These contributions vary for different isotopes and lead to interesting consequences as presented below.
Tables 2, 3, and 4 show the contribution of excited states in the calculation of total capture rates on 54,55,56Fe. In all tables the capture rates and the ratios are calculated at selected points of density and temperature shown in first column. Within the parenthesis the first number gives the density in units of and the second number denotes the stellar temperature in units of K. In the second column gives the ground state electron capture rates whereas denotes the ratios of the ground-state electron capture rate to the total rate. The ground state positron capture rates, , and the ratios of the ground-state positron capture rate to the total rate, , are given in the fourth and fifth column, respectively. All capture rates are given in units of .
The results for 54Fe are very interesting and are depicted in Table 2. The total electron capture rate increases with increasing temperatures and densities. At low temperatures and densities (T and ) one notes that almost all of the contribution to the total electron capture rate comes from the excited states. At a first glance this might look odd. To explain this result one has to go back to Eq. (4) which tells that the partial capture rate is a product of three factors: a constant, phase space integrals (which are functions of temperature and density) and reduced transition probabilities. For a particular parent state () all such transitions are summed over daughter states () and then multiplied by the probability of occupation of that parent excited state. These partial capture rates are finally summed over all parent excited states to calculate the total capture rate as a function of stellar temperature and density (Eq. (6)). For the given physical conditions, the ground state electron capture rate . Probability of occupation of ground state is essentially at such low temperatures. However for the first excited state (at 1.41 MeV) the partial rate increases roughly by 10 orders of magnitude to around . This increase is attributed to a simultaneous increase in phase space (= where = -0.697 MeV Aud03 ) as well as an increase in the total GT+ strength from 4.26 units to 5.12 units (refer to Table 2 of Ref. Nab09 ). Even after multiplying by the much smaller probability of occupation of parent excited state () the partial capture rate from the first excited state is around 3 orders of magnitude bigger than that from ground state at low temperatures. As density increases the phase space from excited states decreases resulting in a larger contribution to total rate from ground state. In the limiting case of densities around all the contribution to the total rate comes from ground state. At higher temperatures () and densities () the contribution of ground state to total rate is roughly 50. At still higher temperatures (T) the ground state contributes around 6–7 at all densities. At T, the partial capture rates are significant also for higher lying excited states (as probability of occupation of these high-lying states then becomes appreciably high) and contribute effectively to the total capture rate. For the corresponding contribution of excited states to total positron capture rate, one sees that these contributions are essentially dependent on stellar temperatures and independent of stellar densities. Further one notes that the contribution of excited states dominate in total positron capture rates. These features are reflective of the fact that the positron capture rates are dominated by phase space integrals. For a given temperature the total positron capture rate increases by a constant factor of the corresponding ground state rate independent of the densities. At low temperatures the ground state contribution is almost negligible for reasons mentioned above. As the stellar temperature increases so does the ground state contribution until it reaches a maximum around T of the order of 27. At T roughly 95 of the contribution comes from excited states.
For the case of 55Fe the story is much different (Table 3). Even though the first excited state is at 0.41 MeV (as against 1.41 MeV for the case of 54Fe) resulting in a much bigger probability of occupation, the partial electron capture rate from first excited state is around 7 orders of magnitude smaller than the corresponding ground state electron capture rate (the total GT+ strength decreases for the first excited state from 4.68 units to 4.43 units Nab09 ). As a result the total electron capture rate is determined almost entirely from ground state rate at low temperatures. This is in sharp contrast to the previous case. The low-lying excited states do play their role at higher temperatures and densities. The behavior of ground state contribution to the total electron capture rate is as per expectation and decreases appreciably as the stellar temperature increases. Again at T almost 97 of the contribution is from the parent excited states at all densities akin to the case of 54Fe. The excited states contribution to the total positron capture rate follows a similar trend as in previous case with a maximum contribution of around 25 from ground state at T. At T the ground state contributes (as against 17 in the case of 54Fe). At much higher temperature (T) this contribution is again around 2.
The excited states contribution to total electron capture rate on 56Fe at low temperatures and densities falls roughly in between the two extreme cases of 54Fe and 55Fe (Table 4). Here roughly 50 contribution comes from the excited states at low temperatures and densities. Example giving at T and , the total ground state electron capture rate is around . The contribution from first excited state (0.85 MeV) is around . This is again attributed partly to the increased total GT+ strength of 5.15 units as against 3.71 units (for ground state) Nab09 . This rate when multiplied with the occupation probability of around gives a partial electron capture rate of roughly equal magnitude as that from ground state. The excited states contribution increases at higher temperatures with roughly 95 of the contribution coming from parent excited states at T. One also notes that the ground state contribution to the total electron capture rates increases at . Specially at low temperatures it is almost totally dictated by ground state rates. This is because ground and excited state rates are of comparable magnitudes at this density. However the probability of occupation of excited states is smaller by orders of magnitude at lower temperatures. The excited states contribution to total positron capture rate follows a similar trend as in previous cases with a maximum contribution of around 30 from ground state at T. Tables 2, 3, and 4 highlight the contribution of partial capture rates from parent excited states to the total capture rate and show disparate behavior of these contributions for all three cases. This analysis further stresses on the fact that a microscopic calculation of GT strength function from excited states is indeed required for a reliable estimate of the total capture rates.
One relevant question would then be to ask how the calculated rates compare with other prominent calculations. For the comparison two important calculations of capture rates were taken into consideration: the pioneer calculation of FFN Ful82 which is still used in many simulation codes and the microscopic calculation of LSSM.
| QRPA/SM | QRPA/FFN | QRPA/SM | QRPA/FFN | QRPA/SM | QRPA/FFN | QRPA/SM | QRPA/FFN | |
|---|---|---|---|---|---|---|---|---|
| 1 | 4.49E+00 | 1.04E-01 | 4.49E+00 | 1.05E-01 | 3.05E+00 | 1.31E-01 | 8.59E-01 | 3.00E-01 |
| 3 | 2.50E+00 | 1.93E-01 | 2.50E+00 | 1.93E-01 | 2.38E+00 | 2.36E-01 | 8.59E-01 | 2.99E-01 |
| 10 | 9.95E-01 | 4.36E-01 | 9.93E-01 | 4.36E-01 | 9.95E-01 | 4.37E-01 | 8.45E-01 | 2.99E-01 |
| 30 | 1.14E+00 | 4.00E-01 | 1.14E+00 | 4.00E-01 | 1.14E+00 | 4.00E-01 | 1.05E+00 | 3.62E-01 |
The comparisons are presented in a tabular form. Tables 5, 6, and 7 show the comparison of calculated electron capture rates with those of FFN and LSSM for 54Fe, 55Fe and 56Fe, respectively. Here the ratios of the calculated electron capture rates to those of FFN and LSSM are presented at selected temperature and density points. For the case of 54Fe, the calculated electron capture rates are in good agreement with the LSSM results specially at high temperatures and densities.
At low temperatures and densities the reported electron capture rates are bigger than the LSSM capture rates by around a factor of four (Table 5). During the oxygen shell burning and silicon core burning of massive stars (as per the simulation results of Heg01 ) the pn-QRPA calculated rates are enhanced roughly by a factor of three as compared to LSSM rates. Whereas the individual discrete transitions between initial and final states matter at low temperatures and densities, it is the total GT strength that counts at high temperatures and densities. It is again reminded that Brink’s hypothesis is not assumed in this calculation (which was adopted in LSSM calculation of weak rates). (Also see the discussion on contribution of excited state partial rates above.) The ground state pn-QRPA centroid is placed at much higher energy in 54Mn as compared to LSSM centroid Nab09 . However, pn-QRPA calculates a much bigger total strength. FFN rates are up to around an order of magnitude enhanced compared to pn-QRPA rates at low temperatures and densities. FFN did not take into effect the process of particle emission from excited states and their parent excitation energies extended well beyond the particle decay channel. These high lying excited states begin to show their effect specially at high temperatures and densities. Also one notes that FFN neglected the quenching of the total GT strength. The LSSM electron capture rates were smaller than the FFN rates by, on average, an order of magnitude Heg01 .
| QRPA/SM | QRPA/FFN | QRPA/SM | QRPA/FFN | QRPA/SM | QRPA/FFN | QRPA/SM | QRPA/FFN | |
|---|---|---|---|---|---|---|---|---|
| 1 | 1.01E+00 | 1.00E+00 | 1.01E+00 | 9.98E-01 | 1.02E+00 | 1.01E+00 | 9.04E-01 | 2.04E-01 |
| 3 | 1.45E+00 | 3.72E-01 | 1.44E+00 | 3.72E-01 | 1.44E+00 | 3.58E-01 | 8.91E-01 | 2.04E-01 |
| 10 | 1.12E+00 | 1.12E-01 | 1.12E+00 | 1.12E-01 | 1.12E+00 | 1.12E-01 | 9.23E-01 | 2.19E-01 |
| 30 | 1.72E+00 | 3.50E-01 | 1.72E+00 | 3.51E-01 | 1.72E+00 | 3.50E-01 | 1.44E+00 | 3.53E-01 |
The electron capture rates on 55Fe are most effective during the oxygen shell burning till around the ignition of the first stage of convective silicon shell burning of massive stars Heg01 . For the corresponding temperatures and densities, the pn-QRPA rates are in very good agreement with the LSSM rates at all temperatures and densities (Table 6). This excellent agreement is attributed to the fact that the total rates for 55Fe are commanded by ground state contribution (see Table 3) and both pn-QRPA and LSSM perform a microscopic calculation of the ground-state GT strength function. The comparison with FFN is good at low temperatures only (T). At higher temperatures FFN rates are bigger than the LSSM and pn-QRPA rates by an order of magnitude for reasons mentioned before.
| QRPA/SM | QRPA/FFN | QRPA/SM | QRPA/FFN | QRPA/SM | QRPA/FFN | QRPA/SM | QRPA/FFN | |
|---|---|---|---|---|---|---|---|---|
| 1 | 8.87E-01 | 2.77E-01 | 8.87E-01 | 2.78E-01 | 1.01E+00 | 3.37E-01 | 1.13E+00 | 3.37E-01 |
| 3 | 1.12E+00 | 2.63E-01 | 1.12E+00 | 2.63E-01 | 1.17E+00 | 2.77E-01 | 1.10E+00 | 3.33E-01 |
| 10 | 1.02E+00 | 4.80E-01 | 1.02E+00 | 4.80E-01 | 1.02E+00 | 4.80E-01 | 1.07E+00 | 3.25E-01 |
| 30 | 1.29E+00 | 5.04E-01 | 1.29E+00 | 5.04E-01 | 1.29E+00 | 5.02E-01 | 1.37E+00 | 4.14E-01 |
The average comparison of calculated electron capture rates is again very good against the LSSM rates for the case of 56Fe (Table 7). However at low temperatures and densities the LSSM electron capture rates is around 10 enhanced as compared to pn-QRPA numbers. As mentioned above the comparison of the reported and LSSM electron capture rates may be traced back to the calculation of excited state partial capture rates (Tables 2, 3, and 4). One notes that at T and the electron capture rates were dominated by excited state contributions for the case of 54Fe. For the case of 55Fe it was entirely dominated by ground state contribution and the case of 56Fe had a 50-50 contribution. Correspondingly the comparison with LSSM rates is excellent for the case of 55Fe. The pn-QRPA rates are enhanced by a factor of 4 for 54Fe and some fluctuations in rate comparison can be seen for the case of 56Fe. The electron capture rates on 56Fe are very important for the pre-supernova phase of massive stars. FFN rates are again enhanced by up to an order of magnitude as compared to pn-QRPA and LSSM rates.
| QRPA/SM | QRPA/FFN | QRPA/SM | QRPA/FFN | QRPA/SM | QRPA/FFN | QRPA/SM | QRPA/FFN | |
|---|---|---|---|---|---|---|---|---|
| 1 | 3.50E-05 | 3.53E-05 | 3.50E-05 | 3.53E-05 | 3.50E-05 | 3.52E-05 | 9.98E-01 | 9.98E-01 |
| 3 | 2.91E-02 | 3.18E-02 | 2.91E-02 | 3.17E-02 | 2.91E-02 | 3.18E-02 | 2.90E-02 | 3.18E-02 |
| 10 | 6.97E-01 | 8.47E-01 | 6.97E-01 | 8.47E-01 | 6.97E-01 | 8.43E-01 | 6.89E-01 | 8.24E-01 |
| 30 | 7.59E+00 | 8.51E-01 | 7.60E+00 | 8.53E-01 | 7.62E+00 | 8.55E-01 | 7.41E+00 | 8.38E-01 |
Tables 8, 9, and 10 show the corresponding comparison for the calculated positron capture rates. Again the pn-QRPA calculated positron capture rates are compared with the LSSM and FFN rates. It is reminded that the positron capture rates are smaller than the corresponding electron capture rates by orders of magnitude and these small numbers can change appreciably by a mere change of 0.5 MeV in phase space and are actually more reflective of the uncertainties in calculation of the energy eigenvalues (for both parent and daughter states). Further it is also evident from Tables 8, 9, and 10 that positron capture rates have a dominant contribution from parent excited states (the ground state contributes at the maximum by one third). Looking at Table 8 for the case of 54Fe one notes that the pn-QRPA calculated positron capture rates are suppressed by up to 5 orders of magnitude as compared to LSSM and FFN rates at low temperatures and densities. The comparison improves as the temperature and density increases. At T the reported rates are in fact enhanced by a factor of 8 as compared to LSSM calculated rates and are in reasonable agreement with FFN rates.
| QRPA/SM | QRPA/FFN | QRPA/SM | QRPA/FFN | QRPA/SM | QRPA/FFN | QRPA/SM | QRPA/FFN | |
|---|---|---|---|---|---|---|---|---|
| 1 | 1.85E-03 | 1.57E-03 | 1.85E-03 | 1.57E-03 | 1.85E-03 | 1.57E-03 | 9.98E-01 | 9.98E-01 |
| 3 | 4.73E-01 | 4.12E-02 | 4.73E-01 | 4.12E-02 | 4.72E-01 | 4.06E-02 | 4.69E-01 | 4.06E-02 |
| 10 | 1.45E+00 | 1.34E-01 | 1.45E+00 | 1.34E-01 | 1.44E+00 | 1.34E-01 | 1.40E+00 | 1.31E-01 |
| 30 | 1.15E+01 | 8.39E-01 | 1.15E+01 | 8.41E-01 | 1.15E+01 | 8.39E-01 | 1.12E+01 | 8.24E-01 |
The comparison follows a similar trend for the case of 55Fe (Table 9). Here the pn-QRPA calculated rates are suppressed by as much as 3 orders of magnitude compared with the other calculations at low temperatures. The comparison improves as the density of stellar core stiffens. The reported rates are enhanced at higher temperatures by as much as an order of magnitude as compared to LSSM numbers. FFN rates are again in reasonable agreement with reported rates at T.
| QRPA/SM | QRPA/FFN | QRPA/SM | QRPA/FFN | QRPA/SM | QRPA/FFN | QRPA/SM | QRPA/FFN | |
|---|---|---|---|---|---|---|---|---|
| 1 | 4.12E-02 | 5.32E-04 | 4.12E-02 | 5.32E-04 | 4.11E-02 | 5.32E-04 | 9.98E-01 | 9.98E-01 |
| 3 | 2.36E+00 | 7.05E-02 | 2.36E+00 | 7.06E-02 | 2.35E+00 | 7.03E-02 | 2.33E+00 | 7.03E-02 |
| 10 | 1.84E+00 | 1.07E-01 | 1.84E+00 | 1.07E-01 | 1.84E+00 | 1.06E-01 | 1.81E+00 | 1.03E-01 |
| 30 | 8.15E+00 | 4.79E-01 | 8.17E+00 | 4.80E-01 | 8.15E+00 | 4.79E-01 | 7.96E+00 | 4.67E-01 |
The comparison with LSSM rates improves as one matches the results from 54Fe to 55Fe and finally to 56Fe. In the case of 56Fe the reported positron capture rates are suppressed by around 2 orders of magnitude at T (Table 10). At higher densities and temperatures the rates are in very good comparison. The FFN rates are enhanced by roughly 4 orders of magnitude at low temperatures and densities. The comparison improves as the density and temperature of stellar core increases.
5 Summary and conclusions
The microscopic calculation of Gamow-Teller strength distributions (GT±) of three key isotopes of iron of astrophysical importance was presented. The calculated strengths were in good comparison to the measured strengths (for the case of 54,56Fe). The pn-QRPA calculated total GT strengths were greater in magnitude as compared to those using LSSM. The results also highlighted the fact that the Brink’s hypothesis and back resonances may not be a good approximation to use in stellar calculation of weak rates.
The pn-QRPA model was also used to calculate the associated electron and positron capture rates of these isotopes of iron with astrophysical importance. Deformations of nuclei were taken into account and for the first time the reported calculation took into consideration the experimental deformations. The rates are calculated on an extensive temperature-density grid point suitable for interpolation purposes that might be required in collapse simulations. The electronic versions of these files may be requested from the author.
During the oxygen and silicon core burning phase of massive stars the pn-QRPA electron capture rates on 54Fe are around three times bigger than those calculated by LSSM. The comparison with LSSM gets better for proceeding pre-supernova and supernova phases of stars. The pn-QRPA calculated electron capture rates on 55,56Fe are in overall excellent agreement with the LSSM rates. The calculated positron capture rates are generally smaller (by as much as five orders of magnitude) at low temperatures and densities. The calculation further discourages any noticeable contribution of positron capture rates on iron isotopes for the physics of core-collapse.
Due to the weak interaction processes (capture and decay rates) the value of lepton-to-baryon () ratio for a massive star changes from 1 (during hydrogen burning) to roughly 0.5 (at the beginning of carbon burning) and finally to around 0.42 just before the collapse to a supernova explosion. The temporal variation of within the core of a massive star has a pivotal role to play in the stellar evolution and a fine-tuning of this parameter at various stages of presupernova evolution is the key to generate an explosion. The electron capture tends to reduce this ratio whereas the positron capture increases it. This paper reported on the microscopic calculation of electron and positron capture rates on iron isotopes and also highlighted the differences with previous key calculations. What affect the calculated rates may have on the simulation result is difficult to predict at this stage. Core-collapse simulators are urged to check the affect of incorporating pn-QRPA rates in their simulation codes for possible interesting outcome.
Acknowledgements The author would like to acknowledge the kind hospitality provided by the Abdus Salam ICTP, Trieste, where part of this project was completed. The author wishes to acknowledge the support of research grant provided by the Higher Education Commission, Pakistan through the HEC Project No. 20-1283.
References
- (1) Arnet D.: Supernovae and Nucleosynthesis. Princeton University Press, Princeton, New Jersey. (1996)
- (2) Bethe H.A., Brown G.E., Applegate J., Lattimer J.M.: Equation Of State In The Gravitational Collapse Of Stars. Nucl. Phys. A324, 487 (1979)
- (3) Iwamoto K., Brachwitz F., Nomoto K., Kishimoto N., Umeda H., Hix W.R., Thielemann F.-K.: Nucleosynthesis in Chandrasekhar mass models for type IA supernovae and constraints on progenitor systems and burning-front propagation. Astrophys. J. Suppl. Ser.125, 439 (1999)
- (4) Rönnqvist T., Condé H., Olsson N., Ramström E., Zorro R., Blomgren J., Håkansson A., Ringbom A., Tibell G., Jonsson O., Nilsson L., Renberg P.-U., van der Werf S.Y., Unkelbach W., Brady F.P.: The 54,56Fe(n,p)54,56Mn Reactions at En = 97 MeV. Nucl. Phys. A563, 225, (1993)
- (5) Vetterli M.C., Häusser O., Abegg R., Alford W.P., Celler A., Frekers D., Helmer R., Henderson R., Hicks K.H., Jackson K.P., Jeppesen R.G., Miller C.A., Raywood K., Yen S.: Gamow-Teller Strength Deduced from Charge Exchange Reactions on 54Fe at 300 MeV. Phys. Rev. C40, 559, (1989)
- (6) El-Kateb S., Jackson K.P., Alford W.P., Abegg R., Azuma R.E., Brown B.A., Celler A., Frekers D., Häusser O., Helmer R., Henderson R.S., Hicks K.H., Jeppesen R., King J.D., Raywood K., Shute G.G., Spicer B.M., Trudel A., Vetterli M., Yen S.: Spin-Isospin Strength Distributions for fp Shell Nuclei: Results for the 55Mn(n,p), 56Fe(n,p), and 58Ni(n,p) Reactions at 198 MeV. Phys. Rev. C49, 3128, (1994)
- (7) Rapaport J., Taddeucci T., Welch T.P., Gaarde C., Larsen J., Horen D.J., Sugarbaker E., Koncz P., Foster C.C., Goodman C.D., Goulding C.A., Masterson T.: Excitation Of Giant Spin Isospin Multipole Vibrations In Fe-54,Fe-56 And Ni-58,Ni-60. Nucl. Phys. A410, 371, (1983)
- (8) Anderson B.D., Lebo C., Baldwin A.R., Chittrakarn T., Madey R., Watson J.W.: Gamow-Teller Strength in the 54Fe(p,n)54Co Reaction at 135 MeV, Phys. Rev. C41, 1474 (1990)
- (9) Goodman C.D., Goulding C.A., Greenfield M.B., Rapaport J., Bainum D.E., Foster C.C., Love W.G., Petrovich F.: Gamow-Teller Matrix-Elements From O-0 (P,N) Cross-Sections. Phys. Rev. Lett.44, 1755 (1980)
- (10) Fuller G.M., Fowler W.A., Newman M.J.: Stellar Weak-Interaction Rates for sd-Shell Nuclei. I. Nuclear Matrix Element Systematics with Application to 26Al and Selected Nuclei of Importance to the Supernova Problem. Astrophys. J. Suppl. Ser.42, 447 (1980); Stellar Weak Interaction Rates for Intermediate Mass Nuclei. III. Rate Tables for the Free Nucleons and Nuclei with A = 21 to A = 60. Astrophys. J. Suppl. Ser. 48, 279 (1982); Stellar Weak Interaction Rates for Intermediate Mass Nuclei. II. A = 21 to A = 60. Astrophys. J. 252, 715 (1982); Stellar Weak Interaction Rates for Intermediate Mass Nuclei. IV. Interpolation Procedures for Rapidly Varying Lepton Capture Rates Using Effective log (ft)- Values. Astrophys. J. 293, 1 (1985)
- (11) Aufderheide M.B., Bloom S. D., Mathews G. J., Resler D. A.: Importance of (n,p) reactions for stellar beta decay rates. Phys. Rev. C53, 3139 (1996)
- (12) Aufderheide M.B., Fushiki I., Woosley S.E., Stanford E., Hartmann D.H.: Search for Important Weak Interaction Nuclei in Presupernova Evolution. Astrophys. J. Suppl. Ser.91, 389 (1994)
- (13) Langanke K., Martínez-Pinedo G.: Shell-Model Calculations of Stellar Weak Interaction Rates: II. Weak Rates for Nuclei in the Mass Range A = 45-65 in Supernovae Environments. Nucl. Phys. A673, 481, (2000)
- (14) Nabi J.-Un, Klapdor-Kleingrothaus H.V.: Microscopic Calculations of Stellar Weak Interaction Rates and Energy Losses for fp- and fpg-Shell Nuclei. At. Data Nucl. Data Tables 88, 237 (2004)
- (15) Johnson C.W., Koonin S.E., Lang G.H., Ormand W.E.: Monte-Carlo Methods For The Nuclear Shell-Model. Phys. Rev. Lett.69, 3157 (1992)
- (16) Halbleib J. A., Sorensen R. A.: Gamow-Teller beta decay in heavy spherical nuclei and the unlike particle-hole rpa. Nucl. Phys. A98, 542 (1967)
- (17) Krumlinde J., Möller P.: Calculation of Gamow-Teller -strength functions in the rubidium region in the rpa approximation with Nilsson-model wave functions. Nucl. Phys. A417, 419 (1984)
- (18) Muto K., Bender E., Oda T., Klapdor-Kleingrothaus H. V.: Proton-neutron quasiparticle RPA with separable Gamow-Teller forces. Z. Phys. A 341, 407 (1992)
- (19) Nabi J.-Un, Klapdor-Kleingrothaus H.V.: Weak Interaction Rates of sd-Shell Nuclei in Stellar Environments Calculated in the Proton-Neutron Quasiparticle Random-Phase Approximation. At. Data Nucl. Data Tables 71, 149 (1999)
- (20) Nabi J.-Un, Klapdor-Kleingrothaus H.V.: Microscopic Calculations of Weak Interaction Rates of Nuclei in Stellar Environment for A = 18 to 100. Eur. Phys. J. A 5, 337 (1999)
- (21) Nabi J.-Un, Rahman M.-Ur.: Gamow-Teller Strength Distributions and Electron Capture Rates for 55Co and 56Ni. Phys. Lett. B612, 190 (2005)
- (22) Nabi J.-Un, Rahman M.-Ur.: Gamow-Teller Transitions from 24Mg and Their Impact on the Electron Capture Rates in the O+Ne+Mg Cores of Stars. Phys. Rev. C75, 035803 (2007)
- (23) Nabi J.-Un, Sajjad M., Rahman M.-Ur.: Electron Capture Rates on Titanium Isotopes in Stellar Matter. Acta Phys. Pol. B 38, 3203 (2007)
- (24) Nabi J.-Un, Sajjad M.: Comparative Study of Gamow-Teller Strength Distributions in the Odd-odd Nucleus 50V and its Impact on Electron Capture Rates in Astrophysical Environments. Phys. Rev. C76, 055803 (2007)
- (25) Nabi J.-Un, Rahman M.-Ur, Sajjad M.: Gamow-Teller (GT±) Strength Distributions of 56Ni for Ground and Excited States. Acta Phys. Pol. B 39, 651 (2008)
- (26) Nabi J.-Un, Sajjad M.: Expanded Calculations of Proton-Neutron Quasiparticle Random Phase Approximation (pn-QRPA) Electron Capture Rates on 55Co for Presupernova and Supernova Physics. Can. J. Phys. 86, 819 (2008)
- (27) Nabi J.-Un, Sajjad M.: Neutrino Energy Loss Rates and Positron Capture Rates on 55Co for Presupernova and Supernova Physics. Phys. Rev. C77, 055802 (2008)
- (28) Nabi J.-Un.: Weak-Interaction-Mediated Rates on Iron Isotopes for Presupernova Evolution of Massive Stars. Eur. Phys. J. A 40, 223 (2009)
- (29) Nabi J.-Un.: Expanded calculation of neutrino cooling rates due to 56Ni in stellar matter. Phys. Scr.81, 025901 (2010)
- (30) Nabi J.-Un.:Neutrino and antineutrino energy loss rates in massive stars due to isotopes of titanium. Int. J. Mod. Phys. E 19, 1 (2010)
- (31) Heger A., Woosley S.E., Martínez-Pinedo G., Langanke K.: Presupernova Evolution with Improved Rates for Weak Interactions. Astrophys. J. 560, 307 (2001)
- (32) Staudt A., Bender E., Muto K., Klapdor-Kleingrothaus H.V.: Second-Generation Microscopic Predictions of Beta-Decay Half-lives of Neutron-Rich Nuclei. At. Data Nucl. Data Tables 44, 79 (1990)
- (33) Hirsch M., Staudt A., Muto K., Klapdor-Kleingrothaus H.V.: Microscopic Predictions of /EC-Decay Half-Lives. At. Data Nucl. Data Tables 53, 165 (1993)
- (34) Nilsson S.G.: Binding States of Individual Nucleons in Strongly Deformed Nuclei. Mat. Fys. Medd. Dan. Vid. Selsk 29, 16 (1955)
- (35) Hirsch M., Staudt A., Muto K., Klapdor-Kleingrothaus H.V.: Microscopic Calculation of /EC-Decay Half-Lives with Atomic Numbers Z = 10-30. Nucl. Phys. A535, 62 (1991)
- (36) Stetcu I., Johnson C.W.: Gamow-Teller Transitions and Deformation in the Proton-Neutron Random Phase Approximation. Phys. Rev. C69, 024311 (2004)
- (37) Raman S., Malarkey C.H., Milner W.T., Nestor, Jr. C.W., Stelson P.H.: Transition Probability, B(E2), from the Ground to the First-Excited 2+ State of Even-Even Nuclides. At. Data Nucl. Data Tables 36, 1 (1987)
- (38) Möller P., Nix J.R.: Atomic Masses and Nuclear Ground-State Deformations Calculated with a New Macroscopic-Microscopic Model. At. Data Nucl. Data Tables 26, 165 (1981)
- (39) Audi G., Wapstra A.H., Thibault C.: The AME2003 Atomic Mass Evaluation (II). Tables, Graphs and References. Nucl. Phys. A729, 337 (2003)
- (40) Yost G.P., Barnett R.M., Hinchliffe I., et al. (Particle Data Group), Review of Particle Properties, Phys. Lett. B204, 1 (1988)
- (41) Muto K., Bender E., Klapdor H.V.: Proton-Neutron Quasiparticle RPA and Charge-Changing Transitions. Z. Phys. A 333, 125 (1989)
- (42) F. Osterfeld.: Nuclear-Spin And Isospin Excitations. Rev. Mod. Phys. 64, 491 (1992)
- (43) Gaarde C.: Gamow-Teller and M1 Resonances. Nucl. Phys. A396, 127c (1983)
- (44) Rodin V., Faessler A., Simkovic F., Vogel P.: Uncertainties in the 0-Decay Nuclear Matrix Elements, Czech. J. Phys 56, 495 (2006)