Now at]TRIUMF, Vancouver, BC V6T 2A3, Canada Now at]TRIUMF, Vancouver, BC V6T 2A3, Canada
Mass measurements near the -process path using the Canadian Penning Trap mass spectrometer
Abstract
The masses of 40 neutron-rich nuclides from Z = 51 to 64 were measured at an average precision of using the Canadian Penning Trap mass spectrometer at Argonne National Laboratory. The measurements, of fission fragments from a 252Cf spontaneous fission source in a helium gas catcher, approach the predicted path of the astrophysical process. Where overlap exists, this data set is largely consistent with previous measurements from Penning traps, storage rings, and reaction energetics, but large systematic deviations are apparent in -endpoint measurements. Differences in mass excess from the 2003 Atomic Mass Evaluation of up to keV are seen, as well as systematic disagreement with various mass models.
pacs:
21.10.Dr, 27.60.+j, 27.70.+q, 26.30.HjI Introduction
Neutron-rich isotopes have become increasingly more accessible to experiments requiring accelerated beams or trapped ions in recent years, and regions long unexplored are now being probed. Penning trap mass spectrometers are taking advantage of stopped fission and reaction products from gas catchers Savard_IJMS ; SHIPTRAP-146 and ISOL facilities 99Am05 ; ISOL-Cs08 ; Jyfl_Sr ; Jyfl_Tc ; ISOL-Xe09 ; TITAN-12Be to give direct measurements of these nuclidic masses to high precision. The masses of nuclides far from stability are of interest for a variety of fields, including astrophysics and nuclear structure Bollen-review ; Blaum-review .
In particular, the rapid neutron-capture process ( process) B2FH ; Cowan-rev ; Arnould-rev path is predicted to lie mostly in the region of unmeasured neutron-rich nuclides which is beginning to come into reach of precision study. Determination of neutron separation energies () from nuclear masses is critical for establishing the path of the process, which is thought to lie near the line MeV, and is important for numerical simulations of -process dynamics in different environments Arcones_simulation ; Farouqi_simulation ; Wanajo_simulation . Much of the path is still inaccessible to experiment, but extending mass measurements closer to it provides information to better constrain mass models and extrapolations to the proposed -process path and further still to the neutron dripline. Additionally, the appearance of neutron sub-shells, regions of deformation deformation ; Jyfl_Sr , and shell quenching quench could be discovered via examination of trends.
Continuing a previous program of fission fragment mass measurements Savard_IJMS , the Canadian Penning Trap (CPT) at Argonne National Laboratory has measured the masses of 40 neutron-rich nuclides from Z=51 to 64 near the target precision of , or keV/. This paper reports on the results and techniques of those measurements, and compares the results to previous measurements and the mass models on which -process simulations depend.
II Experimental Procedure
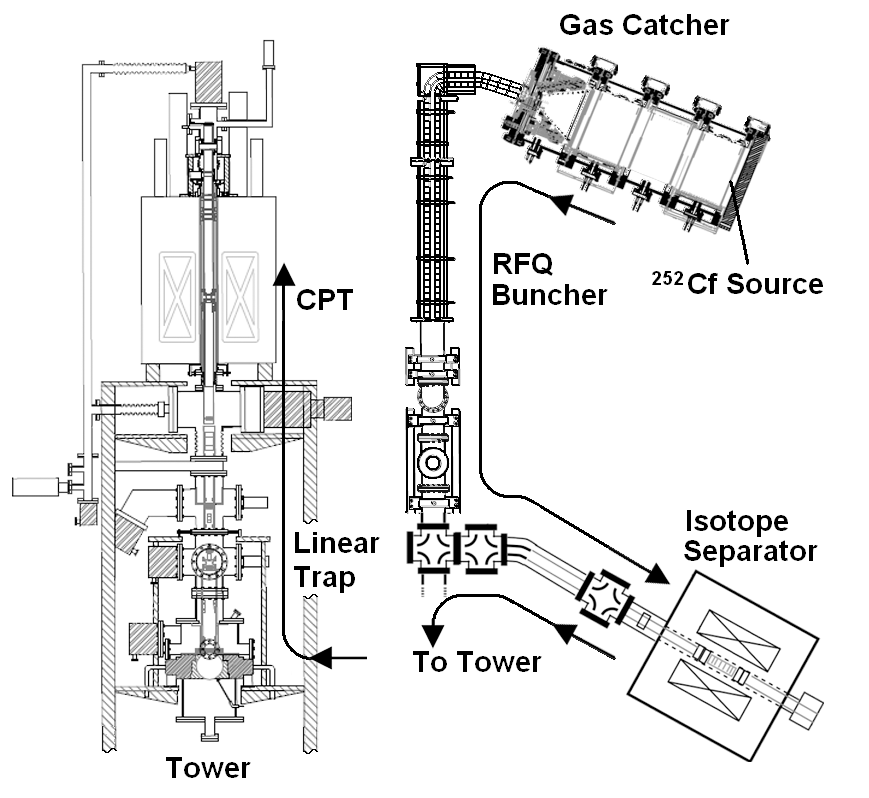
The CPT and associated equipment have been described elsewhere Savard_IJMS ; Fallis_thesis , but details emphasizing recent additions relevant to these measurements will be presented here. The system, illustrated in Fig. 1, consists of a gas catcher for stopping reaction products, a radio frequency quadrupole (RFQ) cooler and buncher, an isotope separator Penning trap, and a linear Paul trap for accumulation and staging of ions before injection in the precision Penning trap. Upgrades since the last CPT measurements in the neutron-rich region Savard_IJMS include a larger-volume gas catcher with a stronger fission source and a higher-resolution isotope separator in a superconducting magnet.
The gas catcher Savard_catcher was designed to stop and cool ions produced either from an internal spontaneous fission source or from reactions using beams from the Argonne Tandem-Linac Accelerator System (ATLAS). This work was performed with fission fragments from a -Ci 252Cf source placed behind a gold degrader foil with thickness optimized for collection of fragments in the heavy peak. The m-length cylindrical gas catcher is filled with – torr of purified helium gas which stops the fission products through collision and ionization. A large fraction, roughly –%, of these fission products stop as singly- or doubly-charged ions in the helium gas. An electrostatic gradient placed along the catcher axis pushes the ions toward the exit nozzle, while an RF ion guide Wada keeps the ions from touching the walls and neutralizing. At the downstream end the ion guide forms an RF funnel leading to the exit nozzle, where gas flow pushes the ions into the next stage.
Ions are carried away from the gas catcher nozzle by an RFQ ion guide Herfurth , and are separated from the helium gas by the combined effects of electric fields and differential pumping. The ions are accumulated and bunched in a linear Paul trap at the end of the RFQ, where they are cooled further in torr room-temperature helium gas. For these measurements, after ms of accumulation the ion bunch is ejected from the trap into the beamline to the rest of the system.
Next, the ions are transferred to the isotope separator, where the ion bunches are purified. The isotope separator is a gas-filled cylindrical Penning trap Savard_gas with a -T superconducting magnet. Penning traps allow two orbital motions of the trapped ions: the modified cyclotron motion with frequency and the much slower magnetron motion with frequency , which are coupled by a cyclotron excitation . In the isotope separator, all ions are pushed outward by a mass-insensitive RF dipole field driven at while the ions of interest are re-centered in the trap by the application of a mass-sensitive RF quadrupole field at the frequency of those ions. The result is the accumulation of a purified sample of the desired ions with a mass resolving power of approximately over the mass range studied here. This is sufficient to remove ions of different mass number as well as any hydrocarbon contaminants that may be at the same mass number. In cases where remaining molecular contamination is suspected, a strong dipole excitation at the reduced cyclotron frequency is applied to break up the molecules via gas collisions during the cleaning process. After cleaning, ions are transferred to a second linear Paul trap where multiple bunches from the isotope separator are accumulated and cooled before transfer to the precision Penning trap.
The CPT mass spectrometer consists of a hyperbolic Penning trap Geonium in a highly stable -T magnetic field and ultra-high vacuum, where masses are measured using the time-of-flight technique Bollen_TOF . The main electrodes approximate hyperboloids of revolution, with apertures in the endcaps for ion entry and ejection and a splitting of the ring electrode into quadrants so that quadrupole excitations may be applied. Additional electrodes are placed between the endcaps and the ring to correct for the finite extent of the trap, and correction electrodes placed outside the endcaps prevent field penetration through the endcap apertures Bollen_TOF .
After an ion bunch is captured in this trap, the highest energy ions are evaporated away by briefly lowering the voltage of a correction tube and allowing them to escape. This is done both to keep only those ions which are in the region of the trap with the most homogeneous magnetic field and to decrease the ion time-of-flight spread. Any contaminants suspected to survive the isotope separator are then removed by a - to -ms dipole excitation at the of those ions. Next, a dipole excitation at is applied for ms to position the ions in an orbit with the desired radius.
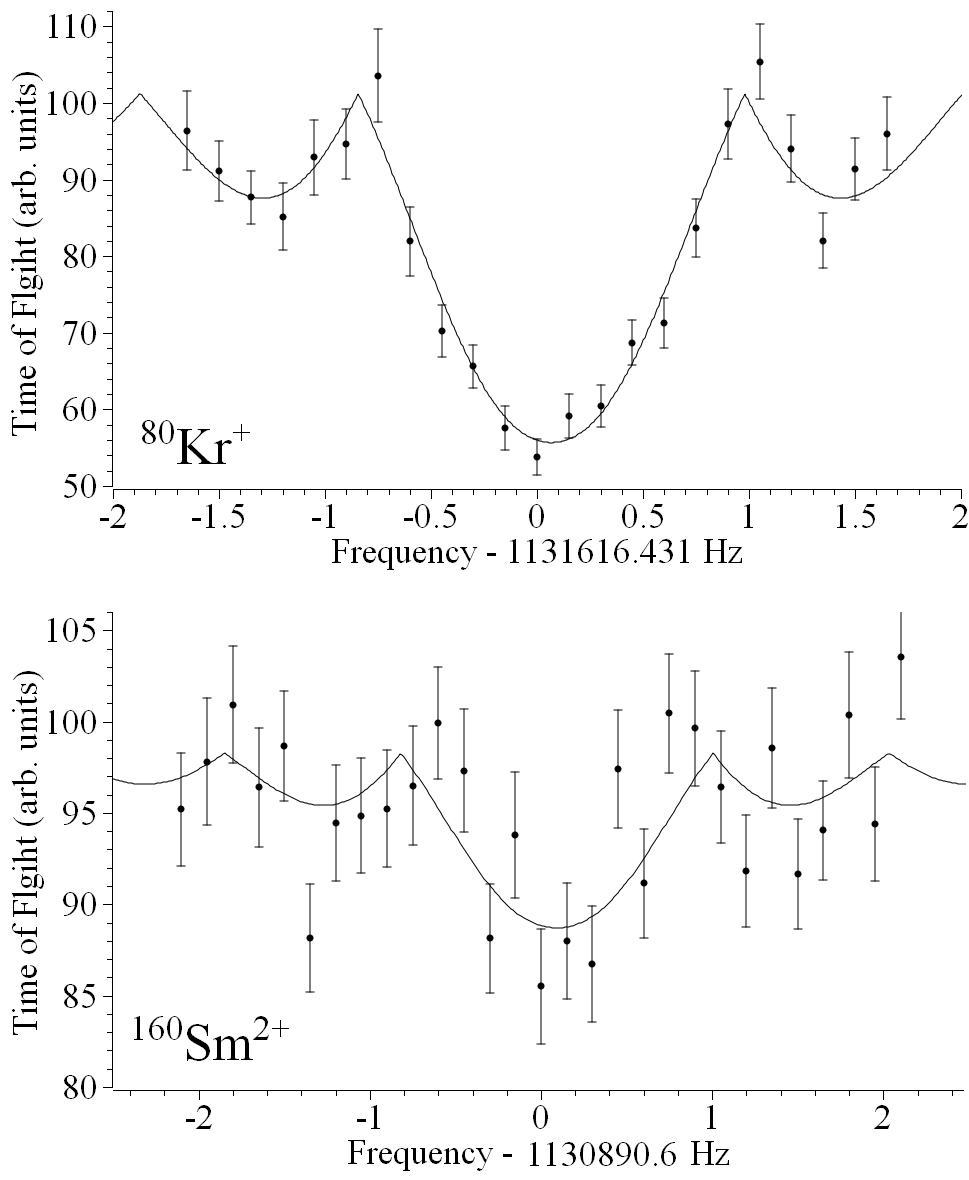
The last step inside the Penning trap is the application of a quadrupole excitation at a candidate cyclotron frequency for to ms. If the frequency applied matches the actual cyclotron frequency, the slow magnetron motion previously induced is converted to the much faster modified cyclotron motion at the same orbital radius Konig . A typical ratio is , thus the orbital kinetic energy increases by a factor of . After this final excitation the ion bunch is ejected from the trap and drifts down a -m long beam line to either an MCP or channeltron time-of-flight detector outside the magnet. As the ions travel through the gradient of the main magnetic field, the orbital motion is converted adiabatically to linear motion, accelerating the ions down the line. Thus an application of a quadrupole field closer to the ion’s true will result in a lower time of flight than a frequency farther away. By scanning frequencies over successive bunches of ions, the minimum in time of flight can be found, and a measurement of the the ion’s made. Because the frequency is applied with a square amplitude envelope, the time-of-flight spectrum reflects that envelope’s Fourier transform: a sinc function. The cyclotron frequency of a calibrant ion of well-known mass is measured in the same manner, and the ratio of the frequencies is taken to cancel out the magnetic field term. The mass of the neutral atom is then given by the calibrant mass and frequency ratio, with additional terms to compensate for the charge states and the masses of electrons not present given the charge states:
where the subscript ‘cal’ refers to the calibrant, is the integer charge state, and is the mass of the electron. Alternatively, if multiple calibrant species are used, those frequency measurements can be combined as a single magnetic field strength measurement via , which can then be used to determine the unknown masses from their cyclotron frequency measurements. In either case, the calibrations need to be taken only as frequently as is required to monitor magnetic field drift, rather than after every measurement of an unknown ion. Atomic binding energies are small enough to be neglected for these measurements. Example time-of-flight scans are shown in Fig. 2.
III Measurements
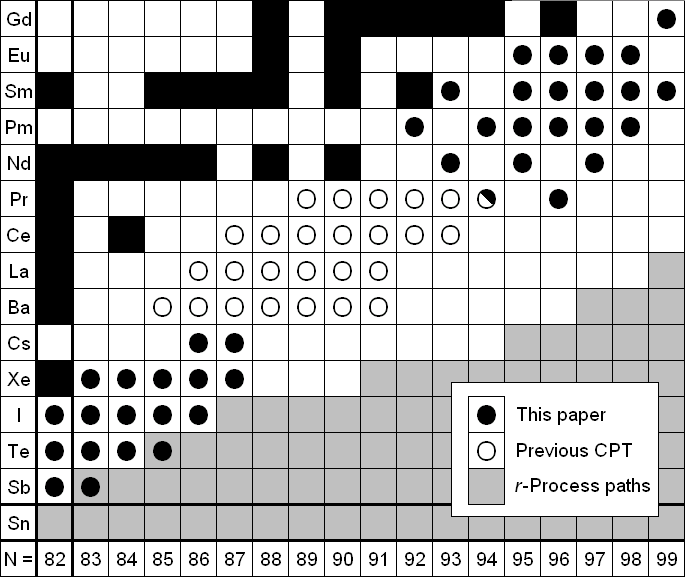
Following fission-fragment measurements made with a smaller gas catcher and source and a previous isotope separator Savard_IJMS , a new series of measurements in the 252Cf fission heavy peak began in April 2008. The nuclides studied, identified in Fig. 3, can be divided into two components: the heaviest nuclides, from Pr to Gd, were measured in the charge state over weeks from April to July 2008; the lighter nuclides in the heavy peak, from Sb to Cs, were measured in the charge state over 4 weeks in February and March 2009. High charge states are advantageous for mass measurements because their higher cyclotron frequencies lead to lower uncertainties in mass for the same uncertainty in frequency. However, due to interactions with the helium gas used to stop and cool the ions in preparation for the precision Penning trap, they are limited to only or in practice. The division of charge states in these measurements is due to the high ionization potential at the Xe electron shell closure, which allows the fission fragments with to survive as , but not those with .
Excitation times used for candidate cyclotron frequencies range from 200 to 2000 ms, depending on the lifetime of the nuclide being studied and the conditions inside the trap. The total duration of each measurement—typically 1 to 30 h—was dictated by the target precision of one part in , the yield of ions out of the gas catcher, and the ultimate purity of the sample in the Penning trap. To calibrate the measurements, which range in mass-to-charge ratio from to , the cyclotron frequencies of 12CH, 80Kr+, and 86Kr+ were measured approximately once per measurement week, and all of the calibration measurements were combined to give a single value for the magnetic field. For the measurements, 136Xe+ was measured at least once per measurement week. In all weeks but one, at least one calibration resonance was taken with identical excitation time as used in that period to determine the fitting-function parameters to be used. For 136I, no calibration was taken with the same excitation time as the measurement because of an unplanned interruption in the experiment. To calibrate this 2000-ms measurement, the results of a 1000-ms calibration were used, and the width of the resonance was scaled from that calibration fit. Table 1 lists the mass values used for each calibrant, and Tables 2 and 3 list the cyclotron frequency ratios of each measured ion to each calibration ion.
| Calibrant | Mass Used (u) | Source | Relative weight | |
|---|---|---|---|---|
| 136Xe+ | 135. | 907 214 484(11) | FSU_Xe | 100% |
| 12CH | 76. | 031 300 085 82(43) | AME03 ; Benzyne_heat ; Benzyne_ion ; Chem_ref | 18% |
| 80Kr+ | 79. | 916 3790(16) | AME03 | 49% |
| 86Kr+ | 85. | 910 610 73(11) | AME03 | 33% |
After the first week of measurements, an electrical discharge occurred in or near the precision Penning trap. A lasting result of this discharge was an additional trap imperfection, possibly due to some surface charge deposited on a trap electrode. Resonances taken under these conditions show an asymmetry, the effect of which had to be mitigated in the analysis as described below. A study undertaken with various stable Xe isotopes Scielzo_Te found a systematic effect of only under these conditions, which is well below the statistical uncertainties in these measurements.
Most time-of-flight spectra were fit with a modified sinc function, which includes a parameter accounting for the possible over- or under-conversion from the to motions Clark_thesis . For the data taken in the week following the discharge the time-of-flight spectrum showed an asymmetry in the side bands, pulling the modified sinc fit to the low-frequency side. A Gaussian function was used to fit that week’s data to minimize this problem, and the uncertainties were appropriately inflated due to the increased of these fits. In all cases cuts were placed on the number of detected ions from a single ion bunch to minimize systematic effects discussed below.
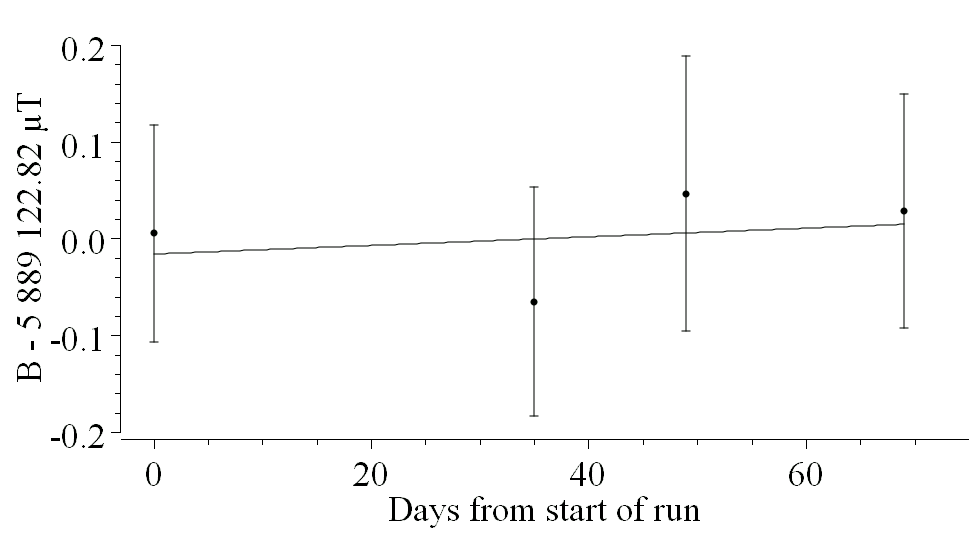
There are several possible sources of systematic error, the largest of which are listed here. As the magnetic field drifts, will change, but the -T superconducting magnet is extremely stable (Fig. 4), with the field drift measured to be ppb/day over a two-month period. Effects of trap misalignment and electric field imperfections are suppressed to high order Gabby . In the weeks following the aforementioned discharge, the measured value for 136Xe+ drifted up ppb/day as the trap recovered. This small potential source of error during this time was mitigated by using a calibration taken within one week of each measurement to calculate the mass. The ion cloud’s charge alters the electric field of the trap, but the effect on the value has been measured to be ppb per detected ion under normal conditions Scielzo_Te , and ppb per detected ion with the post-discharge effect during these measurements. This effect will be suppressed if the trap population during measurement and calibration are kept low, as was the case here with the average number of detected ions per ejection ranging from 0.03 to 3.1 for the ions of interest, and below 7 for the calibration ions. Contaminant ions of similar mass can have a separate effect as the ion motions interfere with each other. Based on a 100 ppb limit at 15 ions Bollen_isomer , we estimate the effect to have an upper limit of ppb for the 3-ion maximum rate here. The reference frequency used by the signal generator was compared to a Rb frequency standard and measured to be stable to ppb over a two-week period. Mass-dependent effects in the precision Penning trap were investigated as part of a very high precision study of Xe isotopes Scielzo_Te . A frequency-dependent attenuation of the applied amplitude was found at /kHz over the frequency range corresponding to from 113 to 165. This, combined with a measured centroid dependence on amplitude due to the dodecapole moment of the trap, gives a variation of , which is again mitigated by using calibrants of similar mass. Because these potential sources of error are much smaller than our statistical uncertanties of at least 32 ppb, or more typically 100 ppb, no systematic uncertainty was added to the quoted results.
| Ion | Ratio | Excitation |
| Time (ms) | ||
| 133Sb+ | 1.022 510 200(79) | 1000 |
| 134Sb+ | 1.014 832 72(27) | 500 |
| 134Te+ | 1.014 904 071(49) | 1000 |
| 135Te+ | 1.007 342 824(75) | 1000 |
| 136Te+ | 0.999 905 180(37) | 1000 |
| 137Te+ | 0.992 562 30(13) | 1000 |
| 135I+ | 1.007 391 356(62) | 1000 |
| 136I+ | 0.999 944 000(36) | 2000 |
| 137I+ | 0.992 617 351(65) | 1000 |
| 138I+ | 0.985 386 600(46) | 1000 |
| 139I+ | 0.978 266 90(22) | 1000 |
| 137Xe+ | 0.992 664 183(83) | 1000 |
| 138Xe+ | 0.985 447 843(42) | 1000 |
| 139Xe+ | 0.978 321 228(81) | 1000 |
| 140Xe+ | 0.971 309 239(75) | 1000 |
| 141Xe+ | 0.964 381 577(69) | 1000 |
| 141Cs+ | 0.964 427 61(15) | 1000 |
| 142Cs+ | 0.957 603 370(75) | 1000 |
| Ratios | Excitation | |||
| Ion | CH | 80Kr+ | 86Kr+ | Time (ms) |
| 153Pr2+ | 0.994 302 50(26) | 1.045 110 12(27) | 1.123 500 53(29) | 200 |
| 155Pr2+ | 0.981 425 59(20) | 1.031 575 21(22) | 1.108 950 41(23) | 500 |
| 153Nd2+ | 0.994 342 931(34) | 1.045 152 616(32) | 1.123 546 210(39) | 500 |
| 155Nd2+ | 0.981 472 30(11) | 1.031 624 31(11) | 1.109 003 19(12) | 500 |
| 157Nd2+ | 0.968 925 46(29) | 1.018 436 35(30) | 1.094 826 04(32) | 200 |
| 153Pm2+ | 0.994 366 01(15) | 1.045 176 87(16) | 1.123 572 28(17) | 500 |
| 155Pm2+ | 0.981 503 965(56) | 1.031 657 596(57) | 1.109 038 971(63) | 500 |
| 156Pm2+ | 0.975 190 689(43) | 1.025 021 719(42) | 1.101 905 358(48) | 1000 |
| 157Pm2+ | 0.968 964 141(81) | 1.018 477 002(84) | 1.094 869 742(92) | 500 |
| 158Pm2+ | 0.962 807 82(15) | 1.012 006 10(16) | 1.087 913 48(17) | 500 |
| 159Pm2+ | 0.956 733 59(11) | 1.005 621 48(12) | 1.081 049 97(13) | 500 |
| 155Sm2+ | 0.981 526 10(15) | 1.031 680 86(16) | 1.109 063 98(17) | 500 |
| 157Sm2+ | 0.968 993 178(51) | 1.018 507 523(52) | 1.094 902 552(58) | 500 |
| 158Sm2+ | 0.962 848 141(58) | 1.012 048 482(58) | 1.087 959 039(65) | 1000 |
| 159Sm2+ | 0.956 770 122(65) | 1.005 659 884(67) | 1.081 091 252(74) | 200 & 500 |
| 160Sm2+ | 0.950 775 181(67) | 0.999 358 608(69) | 1.074 317 338(76) | 1000 |
| 161Sm2+ | 0.944 844 874(74) | 0.993 125 271(77) | 1.067 616 458(84) | 500 |
| 158Eu2+ | 0.962 861 30(15) | 1.012 062 31(16) | 1.087 973 91(17) | 500 |
| 159Eu2+ | 0.956 794 898(63) | 1.005 685 926(64) | 1.081 119 248(71) | 500 |
| 160Eu2+ | 0.950 795 89(10) | 0.999 380 38(11) | 1.074 340 74(12) | 500 |
| 161Eu2+ | 0.944 877 14(11) | 0.993 159 19(12) | 1.067 652 92(13) | 500 |
| 163Gd2+ | 0.933 275 822(91) | 0.980 965 055(94) | 1.054 544 14(10) | 500 |
| Mass (u) | Mass Excess (keV) | ||||||
| Nuclide | CPT | CPT | AME03 | ISOLTRAP | FRS-ESR | ||
| 133Sb | 132.915 277(10) | -78 918.7(9.5) | -78 943(25) | 24 | (27) | -78 986(120) | |
| 134Sb∗ | 133.920 812(35) | -73 763(33) | -74 170(40) | 407 | (52) | ||
| 134Te | 133.911 3976(65) | -82 532.6(6.0) | -82 559(11) | 26 | (13) | -82 758(121) | |
| 135Te | 134.916 550(10) | -77 733.2(9.3) | -77 830(90) | 97 | (90) | -77 725(123) | |
| 136Te | 135.920 1024(50) | -74 424.2(4.6) | -74 430(50) | 6 | (50) | ||
| 137Te | 136.925 622(18) | -69 282(17) | -69 560(120) | 280 | (120) | -69 290(120) | |
| 135I | 134.910 0503(82) | -83 787.6(7.7) | -83 790(7) | 2 | (10) | ||
| 136I∗ | 135.914 8257(49) | -79 339.3(4.5) | -79 500(50) | 161 | (50) | ||
| 137I | 136.918 0282(90) | -76 356.2(8.3) | -76 503(28) | 147 | (29) | -76 518(121) | |
| 138I | 137.922 7265(64) | -71 979.8(6.0) | -72 330(80) | 350 | (80) | ||
| 139I | 138.926 506(31) | -68 460(29) | -68 840(30) | 380 | (42) | -68 527(121) | |
| 137Xe | 136.911 569(11) | -82 373(11) | -82 379(7) | 6 | (13) | -82 382.2(1.8) | |
| 138Xe | 137.914 1550(59) | -79 964.1(5.5) | -80 150(40) | 186 | (40) | -79 975.1(3.3) | |
| 139Xe | 138.918 791(11) | -75 645(11) | -75 644(21) | -1 | (24) | -75 644.6(2.1) | |
| 140Xe | 139.921 658(11) | -72 976(10) | -72 990(60) | 14 | (61) | -72 986.5(2.3) | -72 870(121) |
| 141Xe | 140.926 785(10) | -68 199.5(9.4) | -68 330(90) | 130 | (90) | -68 197.3(2.9) | -68 521(127) |
| 141Cs | 140.920 058(21) | -74 466(19) | -74 477(11) | 11 | (22) | -74 475(15)‡ | |
| 142Cs | 141.924 303(11) | -70 511(10) | -70 515(11) | 4 | (15) | -70 521(15)‡ | |
| 153Pr† | 152.933 895(15) | -61 576(14) | -61 630(100) | 54 | (100) | ||
| 155Pr | 154.940 508(32) | -55 416(30) | -55 780(300) | 360 | (300) | ||
| 153Nd | 152.927 7156(47) | -67 332.5(4.4) | -67 349(27) | 16 | (27) | ||
| 155Nd | 154.933 134(17) | -62 285(16) | -62 470(150) | 190 | (150) | ||
| 157Nd | 156.939 383(46) | -56 464(43) | -56 790(200) | 330 | (200) | ||
| 153Pm | 152.924 167(24) | -70 638(22) | -70 685(11) | 47 | (25) | ||
| 155Pm | 154.928 1350(85) | -66 941.8(7.9) | -66 970(30) | 28 | (31) | ||
| 156Pm | 155.931 1155(64) | -64 165.5(5.9) | -64 220(30) | 54 | (31) | ||
| 157Pm | 156.933 119(13) | -62 299(12) | -62 370(110) | 70 | (110) | ||
| 158Pm | 157.936 563(24) | -59 091(23) | -59 090(130) | 0 | (130) | ||
| 159Pm | 158.939 284(19) | -56 557(17) | -56 850(200) | 290 | (200) | ||
| 155Sm | 154.924 642(24) | -70 196(22) | -70 197.2(2.6) | 1 | (22) | ||
| 157Sm | 156.928 4166(80) | -66 679.5(7.4) | -66 730(50) | 50 | (51) | ||
| 158Sm | 157.929 9497(91) | -65 251.5(8.5) | -65 210(80) | -42 | (80) | ||
| 159Sm | 158.933 215(10) | -62 209.6(9.7) | -62 210(100) | 0 | (100) | ||
| 160Sm | 159.935 333(11) | -60 237(10) | -60 420(200) | 180 | (200) | ||
| 161Sm | 160.939 158(12) | -56 674(12) | -56 980(300) | 310 | (300) | ||
| 158Eu | 157.927 791(25) | -67 262(23) | -67 210(80) | -52 | (83) | ||
| 159Eu | 158.929 100(10) | -66 043.2(9.5) | -66 053(7) | 10 | (12) | ||
| 160Eu | 159.931 849(17) | -63 482(16) | -63 370(200) | -110 | (200) | ||
| 161Eu | 160.933 662(19) | -61 793(18) | -61 780(300) | 0 | (300) | ||
| 163Gd | 162.934 175(16) | -61 316(15) | -61 490(300) | 170 | (300) | ||
| ∗: Identity of measured state is ambiguous due to the possible presence of an isomer. | |||||||
| : Combined CPT result with value from Savard_IJMS . See Sec. IV.1.5 for details. | |||||||
| : Result has been adjusted due to a change in the calibration value since the publication of 99Am05 . | |||||||
| See Sec. IV.1.5 for details. | |||||||
| : Extrapolated mass value. | |||||||
IV Discussion
Of the 40 nuclides measured, 8 had been measured previously by Penning traps, 20 by -endpoint only, and 3 had no previous mass measurement of any kind. Measurement uncertainties in the CPT results range from 5 to 46 u, with most below or near the target fractional uncertainty. Isomers with lifetimes long enough to be captured in the trap are not expected for any of the measured nuclides except 134Sb 02Ko53 ; Shergur and 136I 80KeZQ , for which the identities of the measured states are unclear.
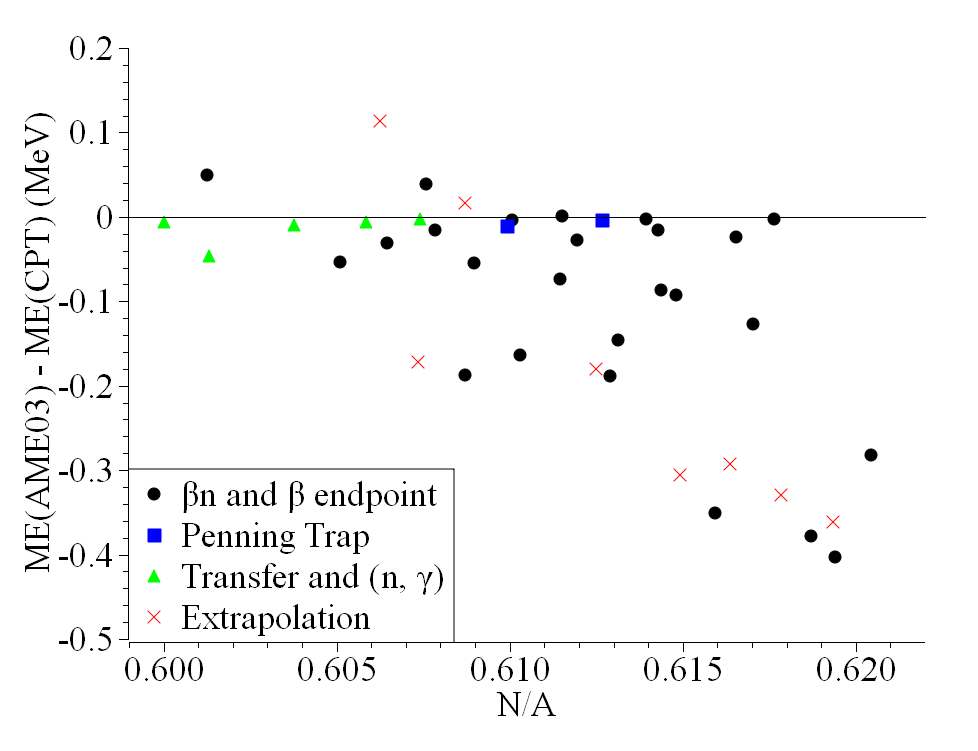
Table 4 shows the new CPT measurements and compares them to the 2003 Atomic Mass Evaluation (AME03) AME03 as well as some more recent measurements 99Am05 ; ISOL-Xe09 ; GSI_08 . The overall trend of these measurements versus the AME03 is of increasing mass as distance from stability increases, as seen in Fig. 5. This effect was also seen in the CPT’s previous measurements of Ba, La, Ce, and Pr fission fragments Savard_IJMS , proton-rich nuclides of Nb to Rh Fallis_90 , as well as measurements by other Penning traps Jyfl_Sr ; Jyfl_Tc ; ISOL-Xe09 . Because the source data for the AME and its extrapolations are mostly from -endpoint measurements, the observed deviations suggest an unaddressed systematic problem with that technique. The frequency of such disagreement suggests that -endpoint results as a whole should not be trusted as a reliable source of data for extrapolations.
IV.1 Comparison with past measurements
The trends evident in Fig. 5 demand separate comparisons between the CPT and literature mass values for different measurement techniques. Four categories have been selected for individual discussion below, grouped so that systematic trends in differences may be identified and each method evaluated for accuracy. Following these is a brief comparison of each new CPT measurement with the literature values for that nuclide.
IV.1.1 Penning Traps
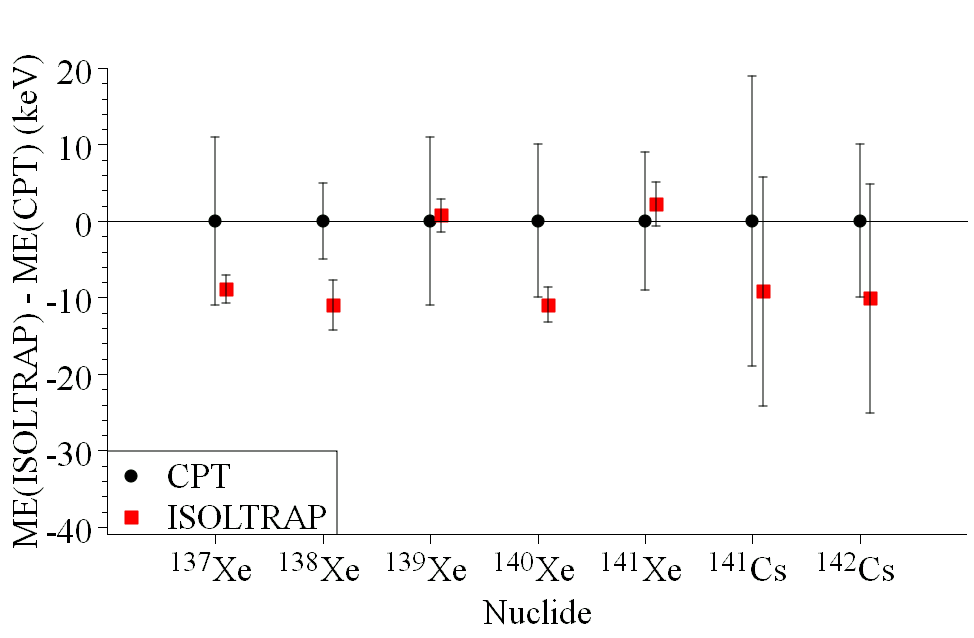
Some of the masses measured here have been previously measured in the ISOLTRAP or CPT Penning traps. These are ideal checks on the accuracy of the experiment as a whole. The CPT had previously measured and published the mass of 153Pr Savard_IJMS , and the present measurement is in agreement. ISOLTRAP has measured isotopic chains of Cs 99Am05 and Xe ISOL-Xe09 from proton-induced fission at ISOLDE to neutron numbers beyond the current reach of the CPT for these elements. Fig. 6 shows a comparison between the seven nuclides measured by both traps, and there is no evidence of any systematic or isolated differences, with . On average, the reported ISOLTRAP masses are lower than the CPT masses.
IV.1.2 Storage Rings
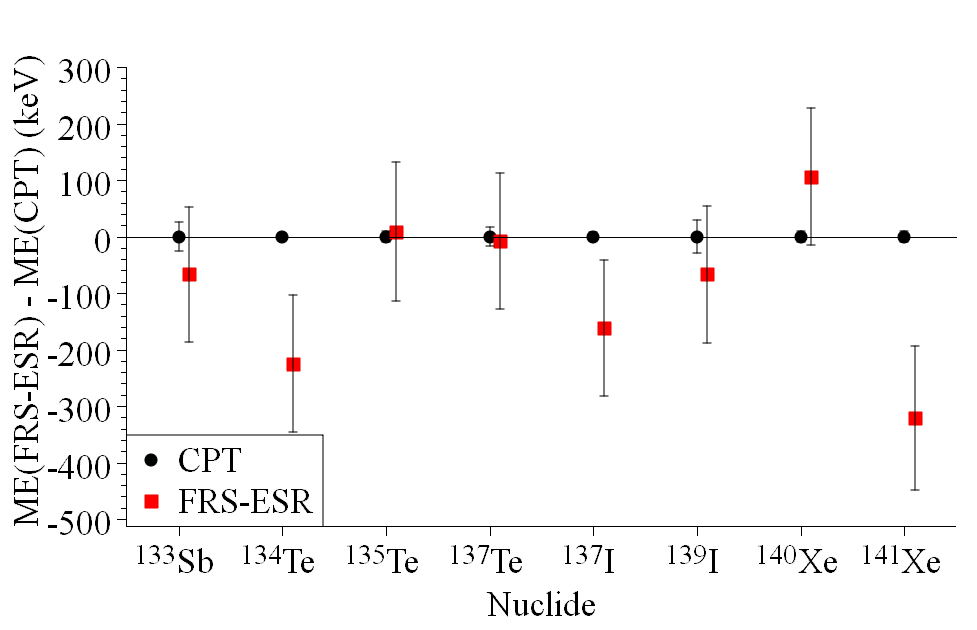
The FRS-ESR GSI_08 cooler-storage ring at GSI uses isochronous mass spectrometry to measure masses of fission products in a radioactive beam via time of flight. Eight nuclides of Sb, Te, I, and Xe have been measured at both the FRS-ESR and the CPT, and are compared in Fig. 7. The two methods are in rough agreement but there is some scatter with an RMS difference of keV, despite the -keV uncertainty typical of the FRS-ESR results. Comparing the two data sets yields , giving a statistical -value of .
If this large scatter is a real effect, then—given the strong consistency of the Penning traps discussed above—it may be due to a flaw in either the FRS-ESR experiment or calibrant mass values. This last possibility is a significant one, given that some of those calibrant masses are largely determined via -endpoint. Unfortunately, not enough information is given in the FRS-ESR publication GSI_08 to accurately recalculate new mass values with updated calibrant masses and compare to the CPT results.
IV.1.3 Transfer and Capture Reactions
Five of the masses presented here had previously been established from nucleon-transfer or neutron-capture experiments. The reaction offers an opportunity for exquisitely precise neutron-separation energy () measurements due to the monoenergetic gamma rays and the state of gamma-ray absorption detector technology. (137Xe) has been measured to a precision of eV by this method Tecdoc , in agreement with the CPT result. (155Sm) has twice been measured to sub-keV precision 82Ba15 ; 82Sc03 and these are consistent, both with each other and with the CPT result.
Transfer reactions offer similar benefits, and four such measurements have been made on nuclides presented here. The mass of 135I has been measured via 136XeHe 71Wi04 , 153Pm via 154SmHe 76Sh.B and 154Sm 78Bu18 , and 159Eu via 160Gd 79Bu05 , to precisions of , , , and keV/, respectively. The differences between these and the CPT measurements, using AME03 mass values for the Sm and Gd parent nuclides, are , , , and , respectively, confirming the accuracy and reliability of transfer reaction measurements.
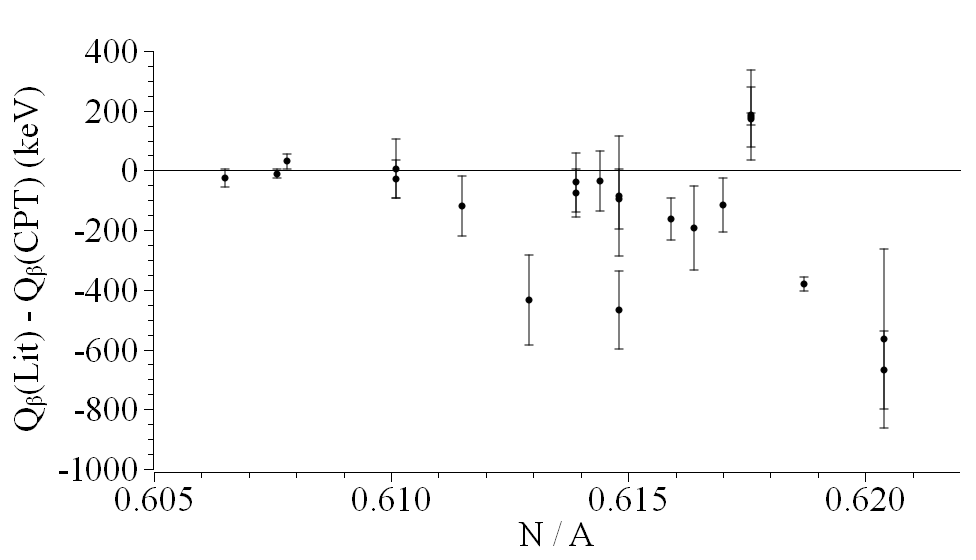
IV.1.4 -Endpoint Measurements
-endpoint measurements dominate the AME03 on the neutron-rich side of stability because of the applicability of that kind of measurement with a small number of nuclei. For 15 of the nuclides presented here where isomeric states are not suspected, the -decay -values can be calculated entirely from these CPT measurements, and a total of 22 -endpoint measurements exist of these nuclides. A comparison of these data sets shows a systematic problem with the -endpoint method, as illustrated in Fig. 8. Of the 22 measurements, 10 are within and another 6 within , but a long tail exists up to . Comparison of the data sets gives , which has a statistical -value of . Of the 22 -endpoint measurements, 17 had values of smaller than the CPT results, which gives support to the notion that feeding to higher-lying states is erroneously pushing these measurements to lower masses.
Two recent sets of measurements demonstrate the importance of considering systematic uncertainties in -endpoint experiments. Hayashi et al. Hayashi give new measurements for some of the Eu and Gd nuclides presented here and a new analysis of that group’s earlier Pm and Sm 02Sh.A ; Shibata03 measurements, and Fogelberg et al. 07Fo02 measured for neutron-rich Te and I isotopes. The CPT results have good statistical agreement with the Hayashi et al. results, but less so with Fogelberg et al., where deviations up to are seen. However, Fogelberg et al. report only a statistical uncertainty, and if the -keV systematic uncertainty suggested by Shibata et al. Shibata_unc and used by Hayashi et al. for the root-plot analysis method is applied, the disagreements decrease to less than .
IV.1.5 Discussion by Nuclide
What follows is a comparison to previous measurements of each nuclide presented here, ordered by element:
133Sb: The AME03 cites a single experiment for the mass of 133Sb, a -endpoint measurement 99Fo01 . The value of in that paper is MeV, leading to an evaluated mass excess of MeV. This is consistent with the CPT value of MeV. A more recent experiment by the FRS-ESR facility measured 133Sb via time of flight, and reported a mass excess of MeV GSI_08 , which is also consistent with the CPT value.
134Sb: There is a metastable state of 134Sb with a 10-s lifetime and excitation energy estimated at keV 02Ko53 , and with a measurement from coincidence at 279 keV Shergur . Only one resonance was observed with the CPT in the expected mass region, so the state of the measured ions is unclear. If the two states are within 400 keV of each other they would not be separately resolved in the CPT given the excitation time of 500 ms, so the observed resonance may be some weighted average of the two states.
The AME03 cites two -endpoint measurements for the mass determination of 134Sb: MeV 95Me16 and MeV 87Gr.A , both of which are significantly lower (6.9 and 2.8 ) than the CPT value of MeV. If the measured state is assumed to be the metastable state, then a combination of the CPT measurement and the -endpoint measurements above gives an excitation energy of keV. We do not offer an assignment of the measured state.
134Te: A single -endpoint measurement is cited by the AME03 with MeV 99Fo01 , leading to a mass excess of MeV. This is marginally consistent with our result of MeV. The FRS-ESR measurement gives MeV GSI_08 , a difference from the CPT.
135Te: Two -endpoint measurements were used in the AME03 to calculate the mass excess of 135Te: MeV 87Gr.A , and MeV 85Sa15 . These are combined in the AME03 to give MeV, consistent with the value from CPT measurements of MeV. The recent FRS-ESR result gives a mass excess of MeV GSI_08 , which is consistent with the CPT value of MeV.
A -endpoint result by Fogelberg et al. 07Fo02 more recent than the AME03 gives MeV, a 9.4 difference from the CPT. It is important to note that there was no systematic uncertainty assigned to that measurement, only a statistical one. Other authors Shibata_unc suggest a 100-keV systematic uncertainty for the root-plot method employed in that study. Increasing the Fogelberg et al. uncertainty to 100 keV reduces the disagreement to .
136Te: Three measurements are used by the AME03 to determine this mass. The determination is dominated by a beta-delayed neutron-emission -value measurement of MeV 84Kr.B , which agrees with the CPT value of MeV. The other citations are of beta-decay -value measurements of MeV 87Gr.A and MeV 77Sc21 . Assuming the CPT 136I measurement is of the ground state (see discussion below) both of these are somewhat higher than the CPT result of MeV.
Since the AME03 publication, a new -endpoint measurement has been made with MeV 07Fo02 , a disagreement of 171 keV and with the CPT result. Adding a -keV systematic uncertainty to the -endpoint method as discussed above decreases the inconsistency to .
137Te: Two -endpoint experiments are cited in the AME03 for 137Te: MeV 85Sa15 and MeV 87Gr.A . These are combined in the AME03 to MeV, marginally consistent with the CPT result of . The AME03 mass excess value of MeV is 278 keV lower than our value of MeV. Over half of this difference, 147 keV, comes from the difference between the mass of 137I used by the AME03 and that determined in our experiment, discussed below. The recent FRS-ESR measurement agrees with the CPT, with mass excess MeV GSI_08 .
135I: In the AME03, two different methods primarily constrain the 135I mass: a -endpoint measurement of MeV 99Fo01 and a (136Xe(,3He)135I) measurement of MeV 71Wi04 . The CPT 135I measurement gives Xe MeV, in excellent agreement with the AME03 input value. There is also a slight contribution to the 135I mass in the AME03 from a 136Te measurement 84Kr.B of MeV, consistent with CPT’s MeV. The CPT results cannot be directly compared to the measurement.
136I: There is a metastable state of 136I 80KeZQ which, with the ground state, is expected to be produced in fission. Only one resonance was clearly measured during this experiment, and its identity is uncertain. If the states lie within 100 keV of each other they would not have been resolved given the excitation time of 2000 ms. The determination of the number of states trapped by the CPT was made difficult by the possible presence of 135Xe1H+ less than 1 Hz (200 keV) away from the observed 136I or 136Im resonance. Because the mass of 135Xe1H+ is well known we can be certain that the resonance measured is not that molecule. The mass excess of the observed 136I state is found to be MeV, and is MeV.
The AME03 cites three papers for a total of four measurements of 136I and its metastable state, each a -endpoint measurement. The most recent of those 87Gr.A gives MeV and MeV for the two states. An older paper 76Lu04 was disregarded for its measurement of the ground-state value, but its measurement of MeV assigned to the isomer state was included in the evaluation. A third paper 59Jo37 gives only the ground state value at MeV. The adopted AME03 values are MeV for the ground state and MeV for the metastable state.
These suggest that it is the ground state which was measured here, however, a paper published since the AME03 claims -endpoint measurements of both the ground and metastable states, with and MeV 07Fo02 , respectively. This is the same paper discussed above which did not include systematic uncertainties. Given the conflicting measurements it is difficult to assign a state to the measured ion.
137I: The AME03 cites a -delayed neutron study for this mass determination, with MeV 84Kr.B . The CPT measurement gives MeV, which disagrees by . Disregarded by the AME03 is a -endpoint measurement of MeV 87Gr.A , which is inconsistent with the CPT result of MeV. The recent FRS-ESR measurement gave a mass excess of MeV GSI_08 , which differs from the CPT result of MeV by .
138I: Only one experiment is cited in the literature for 138I, a -endpoint measurement of MeV 87Gr.A , a difference from our value of MeV. The AME03 mass excess value of MeV disagrees with the CPT value of MeV, a larger -, 350-keV difference. Of this difference, 186 keV is accounted for by our disagreement on the mass of 138Xe discussed below.
139I: A single previous measurement was available for the AME03, a -endpoint measurement that gives MeV 92Gr06 , a 379-keV, - difference from the CPT result of MeV. Curiously, both the 139Xe and 139I measurements that the AME03 relies upon are in this same paper but have wildly different agreement with our results. The recent FRS-ESR mass excess result of MeV GSI_08 agrees with the CPT result of MeV.
137Xe: By virtue of the adjacency of 137Xe to the stable 136Xe, the mass of 137Xe can be derived quite precisely from () measurements. The AME03 cites such a measurement in a draft IAEA Technical Document. That document has since been published, with keV Tecdoc , consistent with the CPT result of keV.
Another Penning trap, ISOLTRAP, recently measured all xenon isotopes from to with similar precision as these measurements ISOL-Xe09 . The reported ISOLTRAP mass excess for 137Xe of MeV is in agreement with the CPT value of MeV.
138Xe: Two -endpoint measurements are used for the mass determination by the AME03. Those results are MeV 72Mo33 and MeV 78Wo15 . These are combined in the AME03 to give the adopted value of MeV. As the mass of 138Cs was not measured in our experiment, a calculation of entirely from CPT data is not possible. It was previously measured by ISOLTRAP, however, with an adjusted mass excess of MeV 99Am05 (see 141Cs, below, for adjustment). Combining these two Penning-trap measurements gives MeV: a 183-keV, - disagreement.
ISOLTRAP’s recent measurement of 138Xe with mass excess MeV ISOL-Xe09 differs from the CPT value of MeV by .
139Xe: Two experiments have measured for this nuclide and are used by the AME03: 78Wo15 and MeV 92Gr06 , averaged in the AME03 to MeV. Using the adjusted mass excess value of 139Cs from ISOLTRAP of MeV 99Am05 (see 141Cs, below, for adjustment), our MeV is consistent. The recent ISOLTRAP measurement of the 139Xe mass excess is MeV ISOL-Xe09 , which is also consistent with the CPT value of MeV.
140Xe: There is only one existing measurement for 140Xe, of MeV 78Wo15 . Using the adjusted ISOLTRAP 140Cs mass excess result of MeV 99Am05 (see 141Cs, below, for adjustment), the CPT MeV agrees. The CPT mass excess of MeV is consistent with both the ISOLTRAP measurement of MeV ISOL-Xe09 and FRS-ESR measurement of MeV GSI_08 .
141Xe: This xenon isotope also has a single measurement, with MeV 78Wo15 . The CPT result of MeV differs by . The CPT mass excess result of MeV is consistent with ISOLTRAP’s result of MeV ISOL-Xe09 . The recent FRS-ESR measurement disagrees by , with mass excess MeV GSI_08 .
141Cs: Neutron-rich cesium isotopes up to 142Cs 99Am05 as well as 145,147Cs ISOL-Cs08 have already been measured quite precisely in ISOLTRAP, and to 148Cs with the Orsay double-focusing mass spectrometer 86Au02 , also at ISOLDE. Therefore cesium was not investigated extensively in this experiment, with only 141,142Cs measured as a consistency check.
For 141Cs, the AME03 quotes three measurements. Most heavily weighted is the ISOLTRAP measurement of the mass 99Am05 , which used 133Cs as the calibrant. The accepted mass of that calibrant had increased between the original paper and the AME03 by keV. Taking this into account the ISOLTRAP mass excess is MeV, consistent with our value of MeV.
The other two cited measurements are a -endpoint measurement of MeV 92Pr04 , and a beta-delayed neutron measurement 84Kr.B . We can compare with the measurement by using an earlier CPT measurement of 141Ba Savard_IJMS to calculate MeV, a difference of . We can compare to the AME03 input value of keV 84Kr.B using the similarly adjusted ISOLTRAP mass for 140Ba 99Am05 which yields keV, in agreement.
142Cs: For this nuclide the AME03 considers the ISOLTRAP mass measurement 99Am05 and a measurement 92Pr04 with an additional contribution from the Orsay mass spectrometer 86Au02 , with which we cannot make a direct comparison. The adjusted (see 141Cs, above) ISOLTRAP mass excess of MeV is in agreement with our result of MeV. Again utilizing previous CPT mass measurements Savard_IJMS , we can calculate to be MeV, which is 1.2 from the value from 92Pr04 of MeV.
153Pr: This mass has previously been measured by the CPT Savard_IJMS at u. This is in agreement with the value found in the present experiment of u. The combined CPT result for this nuclide is therefore u. The sole input for the AME03 is a -endpoint measurement of MeV 02Sh.B , which agrees with our result of MeV.
155Pr: There are no previous mass measurements of this nuclide, direct or indirect. The AME03 extrapolates a mass excess of MeV AME03 , which is from our result of MeV.
153Nd: There is only one previous mass measurement of this neodymium isotope, a -endpoint measurement of MeV 93Gr17 , which agrees with our result of MeV.
155Nd: There is also only a single previous measurement of this isotope, a -endpoint measurement 93Gr17 that was discarded by the AME03 due to severe disagreement with systematic trends. That measurement was part of the same experiment as the accurate 153Nd measurement, above. That result of MeV is inconsistent with our result of MeV, which is closer to the AME03 interpolated value of MeV AME03 .
157Nd: The mass of this neodymium isotope has never before been measured by any means, directly or indirectly. The AME03 extrapolates a mass excess of MeV AME03 , lighter than this work’s MeV.
153Pm: Three measurements are listed in the AME03. One is a -endpoint -value experiment with a result of MeV 93Gr17 . No measurement of 153Sm was made by the CPT, but using the well-established AME03 value for that mass the -value is found to be MeV, a 2.4- difference. A 154SmHePm -value measurement of MeV 76Sh.B is also used. Using the well-established mass of 154Sm AME03 and our measurement, we find MeV, which is consistent. A different proton-transfer reaction -value, 154SmPm 78Bu18 , was also measured at MeV, which differs from our value of MeV by .
155Pm: The only previous measurement is a -endpoint measurement of MeV 93Gr17 , and the CPT result of MeV agrees.
156Pm: Two measurements are listed in the AME03. Both are -endpoint experiments 02Sh.B ; 90He11 , but the CPT has not measured 156Sm so a direct comparison of is not possible. However, the mass excess determination based on these measurements given by the AME03 of MeV differs from the CPT value of MeV by .
157Pm: The AME03 cites a single -endpoint measurement for this nuclide, with MeV 02Sh.B . The CPT measured both parent and daughter, finding MeV, which agrees.
158Pm: This has also been measured only by -endpoint, with a sole experiment in the AME03 giving MeV 02Sh.A . That experiment has since been reanalyzed by the same group in Hayashi et al. Hayashi resulting in MeV. Both values agree with the CPT value of MeV.
159Pm: This nuclide had not been measured by any means as of AME03 publication, but has since been subject of -endpoint measurements Shibata03 subsequently reanalyzed by Hayashi et al. Hayashi resulting in MeV. This differs from the CPT value of MeV by . The AME03 systematic mass extrapolation gives a mass excess of MeV, which differs from the CPT value of MeV by .
155Sm: High-precision measurements of the neutron-separation energy of 155Sm have been made in two experiments via the reaction, and these are used exclusively by the AME03 to determine its mass. These measurements were adjusted in the AME03 to MeV 82Ba15 and MeV 82Sc03 . Using the well-established AME03 value for the 154Sm mass, the CPT result is MeV, which is consistent.
157Sm: A single -endpoint measurement is used in the AME03 determination of this nuclide, with MeV 93Gr17 . The CPT has not measured the daughter of this decay, so a direct comparison is impossible; however the CPT mass excess value of MeV is consistent with the AME03 value of MeV.
158Sm: A single -endpoint experiment forms the basis for the AME03 determination of this nuclide’s mass, with MeV 93Gr17 , consistent with the CPT value of MeV.
159Sm: The AME03 cites a single -endpoint measurement for this nuclide of MeV 02Sh.A , which has since been reanalyzed by the same group in Hayashi et al. Hayashi resulting in MeV. Both values agree with the CPT value of MeV.
160Sm: No previous mass measurement of any kind exists for 160Sm. The AME03 extrapolated a mass excess of MeV, which is consistent with the CPT value of MeV.
161Sm: No measurement of this nuclide existed as of AME03 publication. It has since been subject of the -endpoint measurements Shibata03 subsequently reanalyzed by the same group in Hayashi et al. Hayashi which found MeV, which agrees with the CPT result of MeV. The CPT mass measurement differs by 310 keV with the AME03’s extrapolation, which has an uncertainty of keV.
158Eu: This nuclide has two separate -endpoint measurements, listed in the AME03 as 65Sc19 and MeV 66Da06 , combined in the AME03 to MeV. All of these are consistent with the CPT value of MeV, using the well-established AME03 mass value for 158Gd which was not measured by the CPT.
159Eu: This nuclide was the subject of a transfer-reaction experiment, 160Gd, which gave a value for that reaction of MeV 79Bu05 . Using the well-known mass of the nearly stable 160Gd from the AME03, the CPT measurement gives MeV, a difference of .
160Eu: No previous mass measurements for this nuclide were used in the AME03, it having rejected two beta-endpoint measurements of 73Da05 and MeV 73Mo18 . It has since been the subject of the -endpoint measurements by Hayashi et al. which found MeV Hayashi . Using the well-known mass of the nearly stable 160Gd from the AME03, the CPT measurement disagrees significantly, with MeV, which is keV or from the Hayashi et al. result. The CPT mass value is consistent with the AME03 systematic extrapolation.
161Eu: No previous mass measurement existed for this nuclide as of AME03 publication, but it has since been the subject of the -endpoint measurements by Hayashi et al. which found MeV Hayashi . The CPT mass value is consistent with the AME03 systematic extrapolation.
163Gd: No previous mass measurement existed for this nuclide as of AME03 publication, but it has since been the subject of the -endpoint measurements by Hayashi et al. which found MeV Hayashi . The CPT mass value is consistent with the AME03 systematic extrapolation.
IV.2 Mass Model Comparison
| Model | (MeV) | (MeV) | |
|---|---|---|---|
| AME03 AME03 | 0.171 | -0. | 105 |
| FRDM FRDM95 | 0.538 | -0. | 379 |
| HFB2 HFB2 | 0.555 | 0. | 281 |
| HFB9 HFB9 | 0.467 | -0. | 175 |
| HFBCS1 HFBCS1 | 0.546 | -0. | 025 |
| DUZU DUZU28 | 0.234 | 0. | 062 |
| KTUY05 KTUY05 | 0.611 | 0. | 438 |
| ETFSI2 ETFSI2 | 0.396 | -0. | 120 |
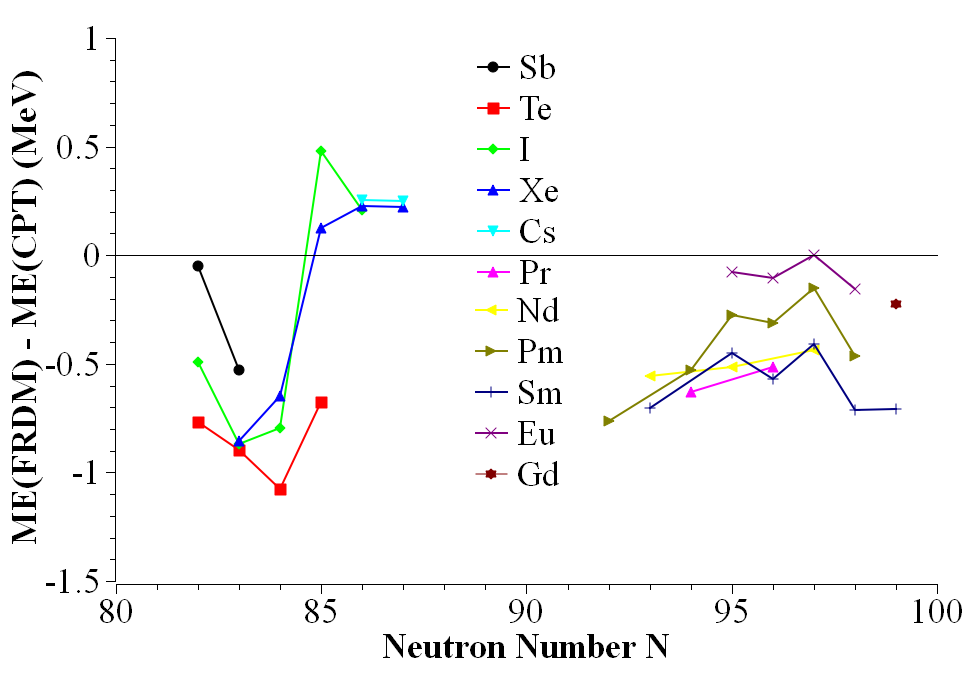
Because most of the -process path is outside the region of known masses, -process simulations are forced to use mass models for neutron-separation energy values. Available mass models often disagree significantly for unmeasured masses, so it can be enlightening to compare first-time measurements to mass models which were created before these masses were available. Table 5 summarizes the overall precision and accuracy of, and Figs. 9–15 compare the new CPT measurements to, various popular mass models.
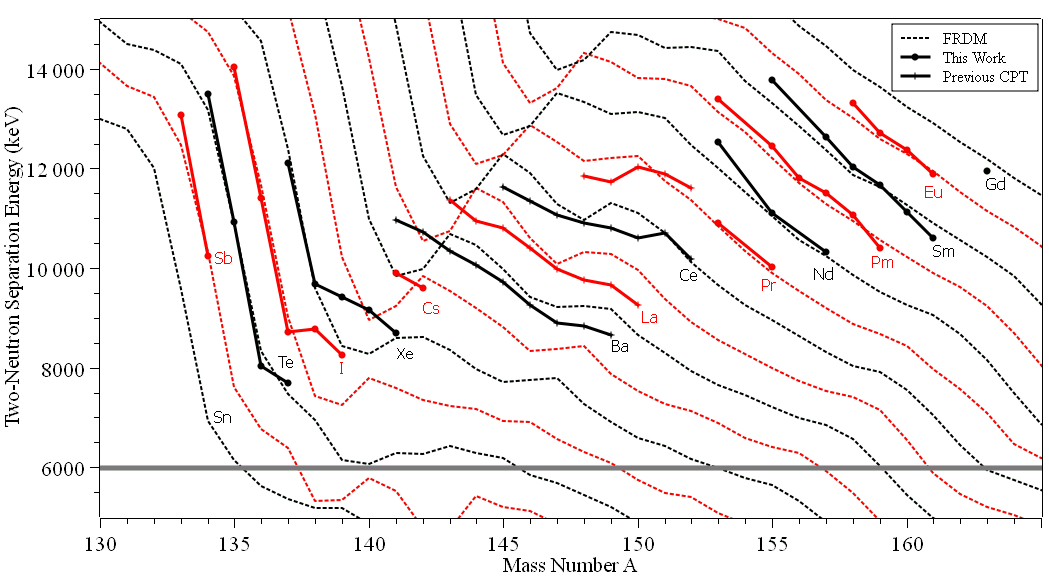
The FRDM is a commonly used model for -process simulations, and a comparison with the new CPT results is shown in Fig. 9. The shell closure is followed by an oscillation about the true masses at higher , though these oscillations appear to be damped away by . This region is important for the process, because its path is expected to exit the shell after the possible 130Cd waiting point Cowan-rev . If the overshooting in binding energy past continues for lower than measured here, then the location of the -process path may be closer to stability for and 50 than the FRDM would indicate. Clearly more mass measurements around and 50 are vital for an accurate path determination past .
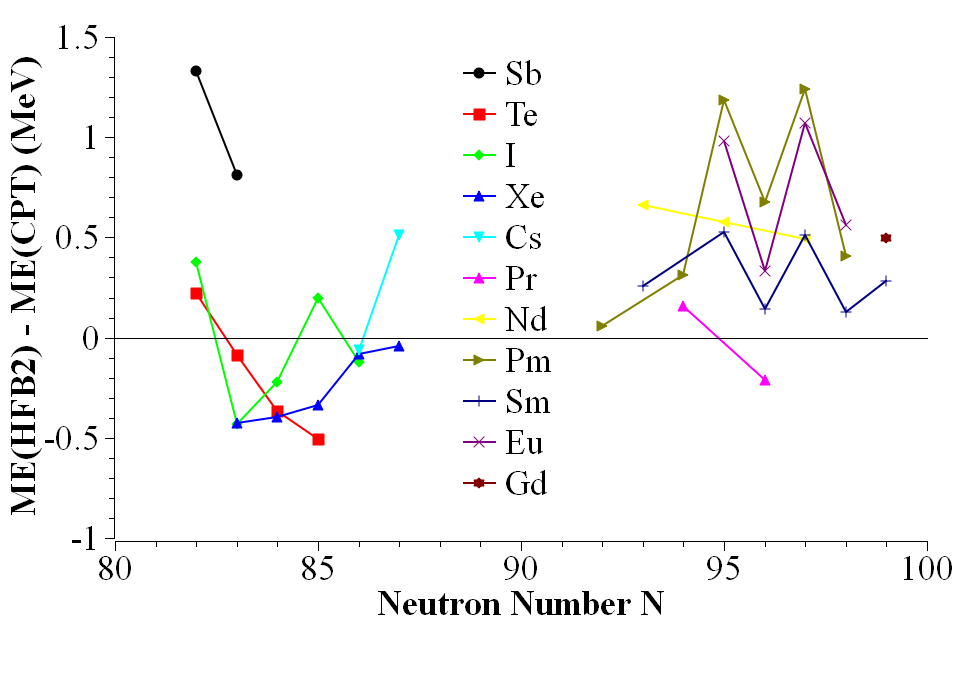
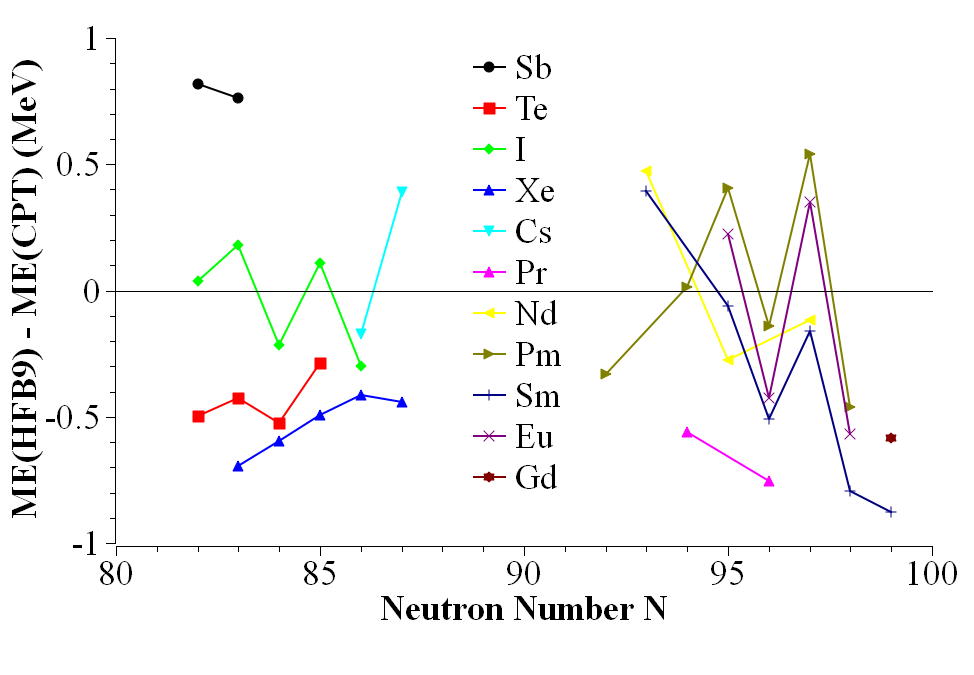
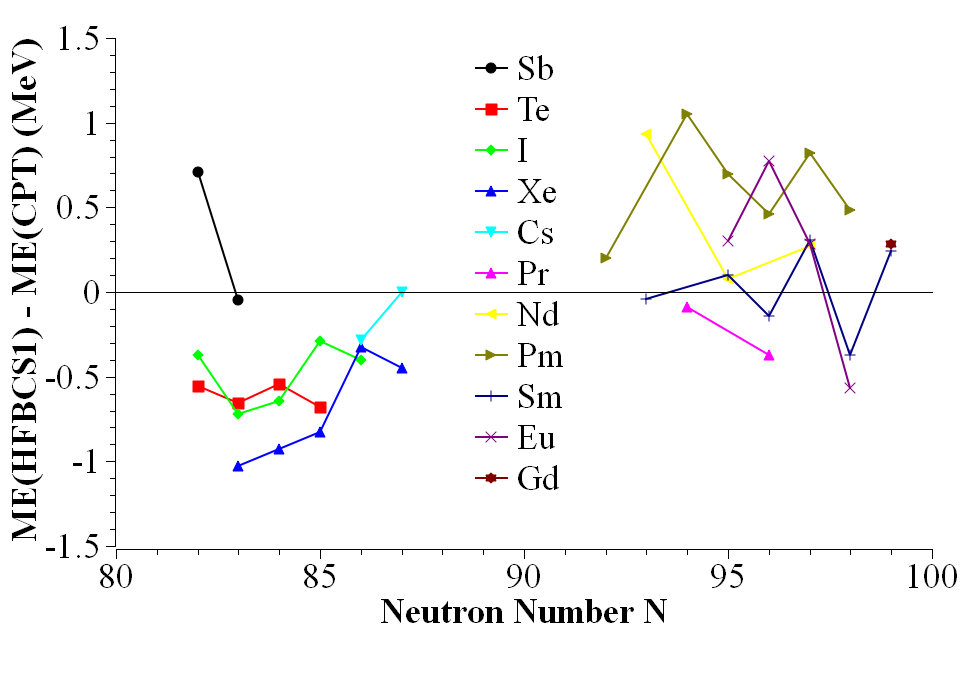
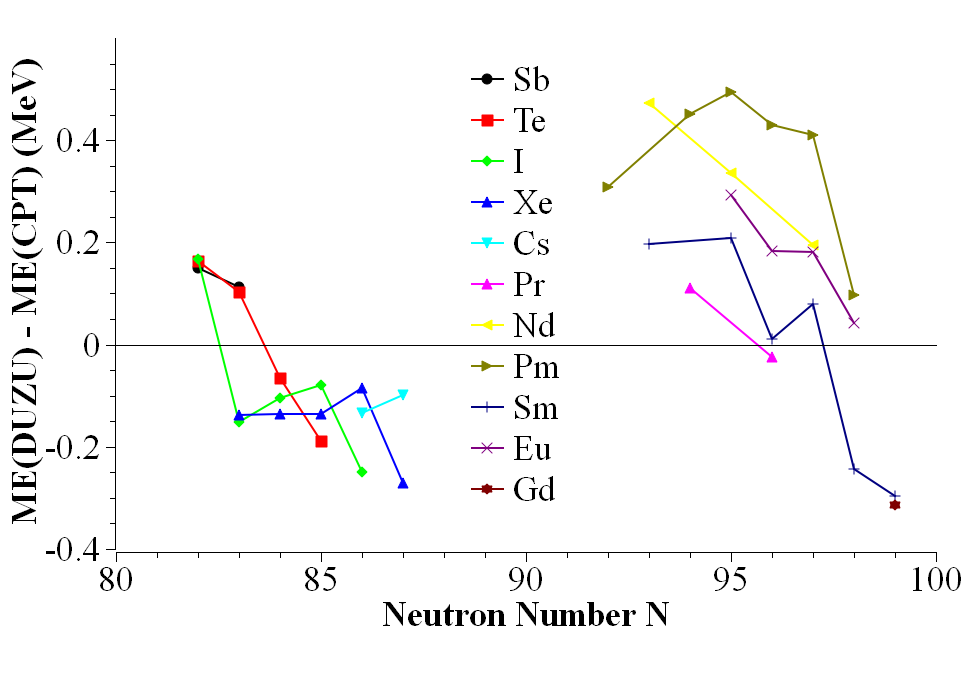
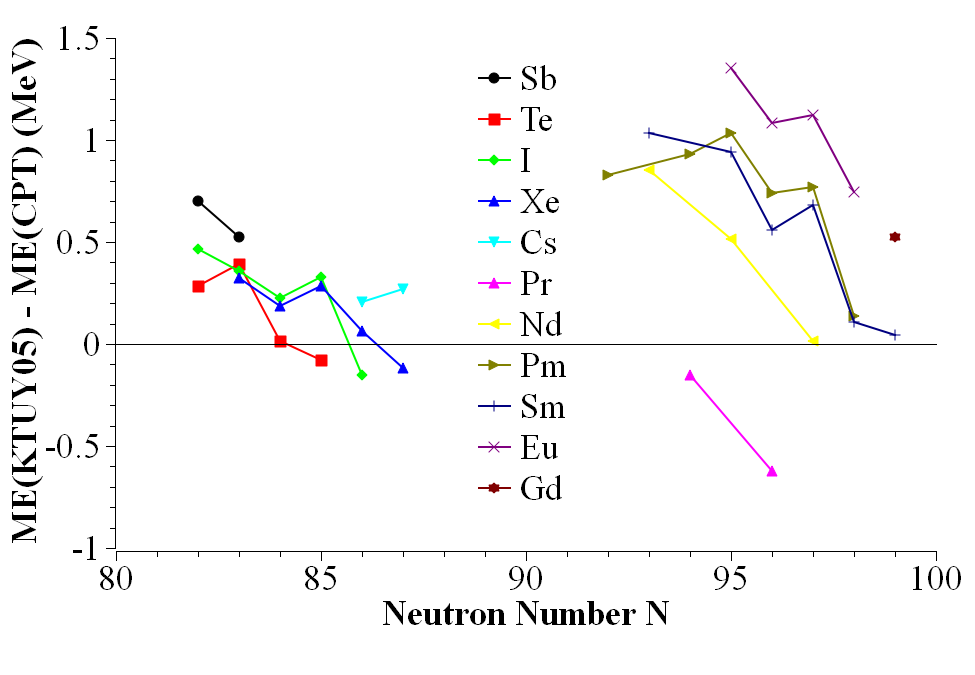
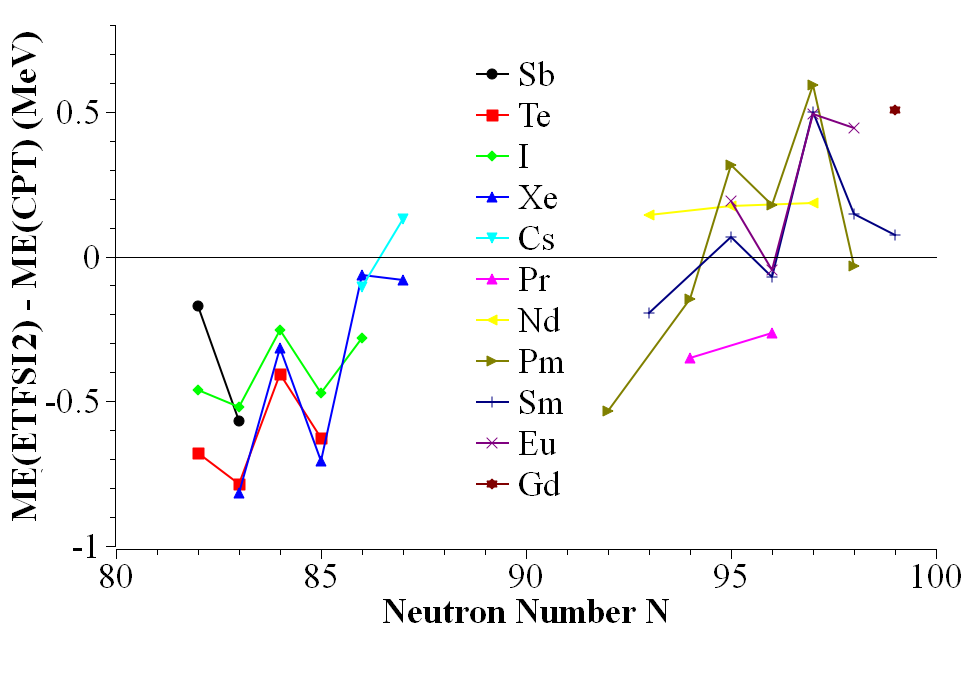
For astrophysics modeling it is not the absolute errors in mass models that are relevant but systematically increasing errors with , because this is what affects and thus the process paths. For example, Table 5 would suggest that the DUZU model is one of the most accurate in this region, but Fig. 13 shows that for most elements the deviations from our results have negative slope at to keV per neutron. Given the slope of DUZU here, the difference in corresponds to a shift in the -process path of about one neutron closer to stability were the difference to continue changing with the same slope. KTUY05 (Fig. 14) shows the same trend but with even larger magnitude. ETFSI2 (Fig. 15) on the other hand has a slope of similar magnitude in the opposite direction. Any such trend in HFB2 or HFB9 (Fig. 10 and 11) is harder to identify given the apparent difficulty with pairing effects at large , with many changes of over keV in mass deviation from isotope to isotope. The HFBCS1 model (Fig. 12) had the lowest mean mass difference from the CPT among these models, but had among the largest scatters in difference, spanning over 2 MeV.
Fig. 16 compares neutron separation energies for the CPT and FRDM and suggests a more complicated story for this model. Of course these new measurements are still very far from the predicted -process path, so reliable predictions of the path location are not yet possible. Given the varied problems with mass models, forming any expectation that one would be more accurate than the others at yet higher neutron excess would be a gamble. It is clear that mass measurements on or close to the -process path are sorely needed, especially at the waiting points.
V Summary and Outlook
Mass measurements of 40 nuclides were made, most of which improved the precision and accuracy over literature values. Results are largely consistent with previous results from Penning traps, reaction energetics, and storage ring measurements, but are frequently much lower in mass than results from -endpoint measurements. Comparison with mass models shows only sporadic agreement, and suggests unsuitability of these models for precise astrophysical -process simulations. Reliable mass measurements yet closer to and on the -process path are still needed.
The CPT has been moved to the new CAlifornium Rare Isotope Breeder Upgrade (CARIBU) facility CARIBU now operating at the ATLAS accelerator, and has begun a successor campaign to these measurements. The extent of the CPT’s previous measurements was limited by the purity and rate of the available beam, and CARIBU offers several improvements over the system used here to overcome these limitations. The - times more intense fission source and larger gas catcher will allow access to nuclides 3-5 neutrons farther from stability. A new compact higher-resolution in-flight isobar separator CARIBU_IS promises purification with a resolving power of 20 000—four times that of the previous system—while avoiding the saturation of ion traps that would have occurred otherwise with such an intense beam. The in-flight separation will also defer the limitation in nuclide lifetime that would be imposed by in-trap purification. Many of the newly available nuclides lie directly on potential -process paths near . The CPT will conduct a survey of all accessible -process nuclides in this vicinity, as well as any other neutron-rich species made available with the goal of finding isomers, regions of deformation, and shell quenching. Over 200 additional masses are expected to be measured by the CPT.
VI Acknowledgments
This work performed under the auspices of NSERC, Canada, application number 216974, and the U.S. DOE, Office of Nuclear Physics, under Contract Nos. DE-AC02-06CH11357, DE-FG02-91ER-40609, DE-FG02-98ER41086, and DE-AC52-07NA27344.
References
- (1) G. Savard et al., Int. J. Mass Spectrom. 251, 252 (2006).
- (2) C. Rauth et al., Eur. Phys. J. Special Topics 150, 329 (2007).
- (3) F. Ames et al., Nucl. Phys. A651, 3 (1999).
- (4) C. Weber, G. Audi, D. Beck, K. Blaum, G. Bollen, F. Herfurth, A. Kellerbauer, H.-J. Kluge, D. Lunney, and S. Schwarz, Nucl. Phys. A803, 1 (2008).
- (5) U. Hager et al., Phys. Rev. Lett. 96, 042504 (2006).
- (6) U. Hager et al., Phys. Rev. C 75, 064302 (2007).
- (7) D. Neidherr et al., Phys. Rev. C 80, 044323 (2009).
- (8) S. Ettenauer et al., Phys. Rev. C 81, 024314 (2010).
- (9) G. Bollen and S. Schwarz, J. Phys. B 36, 941 (2003).
- (10) K. Blaum, Yu.N. Novikov, and G. Werth, Contemp. Phys. 51, 149 (2010).
- (11) E. M. Burbidge, G. R. Burbidge, W. A. Fowler, and F. Hoyle, Rev. Mod. Phys. 29, 547 (1957)
- (12) J. J. Cowan, F.-K. Thielemann, J. W. Truran, Phys. Rep. 208, 267 (1991).
- (13) M. Arnould, S. Goriely, and K. Takahashi, Phys. Rep. 450, 97 (2007).
- (14) A. Arcones and G. Martínez-Pinedo, Phys. Rev. C 83, 045809 (2011).
- (15) K. Farouqi, K.-L. Kratz, B. Pfeiffer, T. Rauscher, F.-K. Thielemann, and J. W. Truran, Astrophys. J. 712, 1359 (2010).
- (16) S. Wanajo, S. Goriely, M. Samyn, and N. Itoh, Astrophys. J. 606, 1057 (2004).
- (17) R. Fossion, C. De Coster, J. E. García-Ramos, T. Werner, and K. Heyde, Nucl. Phys. A697, 703 (2002).
- (18) I. Dillmann et al., Phys Rev. Lett. 91, 162503 (2003).
- (19) J. Fallis, Ph.D. thesis, University of Manitoba, 2009 [http://hdl.handle.net/1993/3210].
- (20) G. Savard et al., Nucl. Instrum. Methods B 204, 582 (2003).
- (21) M. Wada et al., Nucl. Instrum. Methods B 204, 570 (2003).
- (22) F. Herfurth et al., Nucl. Instrum. Methods A 469, 254 (2001).
- (23) G. Savard, St. Becker, G. Bollen, H.-J. Kluge, R. B. Moore, Th. Otto, L. Scweikhard, H. Stolzenberg, and U. Wiess, Phys. Lett. A 158, 247 (1991).
- (24) S. Brown and G. Gabrielse, Rev. Mod. Phys. 58, 233 (1986).
- (25) G. Bollen, R. B. Moore, G. Savard, and H. Stolzenberg, J. Appl. Phys. 68, 4355 (1990).
- (26) M. König, G. Bollen, H.-J. Kluge, T. Otto, and J. Szerypo, Int. J. Mass Spectrom. Ion Proc. 142, 95 (1995).
- (27) J. A. Clark, Ph.D. thesis, University of Manitoba, 2005 [http://hdl.handle.net/1993/177].
- (28) M. Redshaw, E. Wingfield, J. McDaniel, and E. G. Myers, Phys. Rev. Lett. 98, 053003 (2007).
- (29) A. H. Wapstra, G. Audi, and C. Thibault, Nucl. Phys. A 729, 129 (2003); G. Audi, A. H. Wapstra, and C. Thibault, ibid. 729, 337 (2003).
- (30) P. G. Wenthold, J. A. Paulino, and R. R. Squires, J. Am. Chem. Soc. 113, 7414 (1991).
- (31) X. Zhang and P. Chen, J. Am. Chem. Soc. 114, 3147 (1992).
- (32) M. W. Chase, NIST-JANAF Thermochemical Tables (American Chemical Society, Washington, 1998), Vol. 1, p. 551, Vol 2, p. 1261.
- (33) N. D. Scielzo et al., Phys. Rev. C 80, 025501 (2009).
- (34) G. Gabrielse, Int. J. Mass Spectrom. 279, 107 (2009).
- (35) G. Bollen, H.-J. Kluge, M. König, T. Otto, G. Savard, H. Stolzenberg, R. B. Moore, G. Rouleau, G. Audi, and the ISOLDE Collaboration, Phys. Rev. C 46, R2140 (1992).
- (36) A. Korgul et al., Eur. Phys. J. A 15, 181 (2002).
- (37) J. Shergur, A. Wöhr, W. B. Walters, K.-L. Kratz, O. Arndt, B. A. Brown, J. Cederkall, I. Dillmann, L. M. Fraile, P. Hoff, A. Joinet, U. Köster, and B. Pfeiffer, Phys. Rev. C 71, 064321 (2005).
- (38) U. Keyser, H. Berg, F. Münich, B. Pahlman, K. Hawerkamp, B. Pfeiffer, H. Schrader, and E. Monnand, in Atomic Masses and Fundamental Constants, 6, edited by J. A. Nolen, Jr. and W. Benenson (Plenum Press, New York, 1980), p. 485.
- (39) J. Fallis et al., Phys. Rev. C 84, 045807 (2011).
- (40) B. Sun et al., Nucl. Phys. A812, 1 (2008).
- (41) R. B. Firestone, S. F. Mughabghab, and G. L. Molnár, IAEA Tecdoc, STI/PUB/1263 (2007).
- (42) I. F. Barchuk, V. I. Golyshkin, and E. N. Gorban, Izv. Akad. Nauk SSSR, Ser. Fiz. 46, 63 (1982).
- (43) K. Schreckenbach et al., Nucl. Phys. A376, 149 (1982).
- (44) B. H. Wildenthal, E. Newman, and R. L. Auble, Phys. Rev. C 3, 1199 (1971).
- (45) E. Sugarbaker and W. S. Gray, Bull. Am. Phys. Soc. 21, 984 (1976).
- (46) D. G. Burke, G. Løvhøiden, E. R. Flynn, and J. W. Sunier, Phys. Rev. C 18, 693 (1978).
- (47) D. G. Burke, G. Løvhøiden, E. R. Flynn, and J. W. Sunier, Nucl. Phys. A318, 77 (1979).
- (48) H. Hayashi et al., Eur. Phys. J. A 34, 363 (2007).
- (49) M. Shibata, T. Shindou, Y. Kojima, M. Asai, K. Tsukada, S. Ichikawa, H. Haba, Y. Nagame, and K. Kawade, Japan Atomic Energy Research Institute, Tandem VDG Annual Report, 2001 (2002) p. 26; JAERI-Review 2002-029 (2002).
- (50) M. Shibata, O. Suematsu, K. Kawade, M. Asai, S. Ichikawa, Y. Nagame, A. Osa, K. Tsukada, Y. Kojima, and A. Taniguchi, Japan Atomic Energy Research Institute, Tandem VDG Annual Report, 2002 (2003) p. 32; JAERI-Review 2003-028 (2003).
- (51) B. Fogelberg, K. A. Mezilev, V. I. Isakov, K. I. Erokhina, H. Mach, E. Ramström, and H. Gausemel, Phys. Rev. C 75, 054308 (2007).
- (52) M. Shibata, Y. Kojima, H. Uno, K. Kawade, A. Taniguchi, Y. Kawase, S. Ichikawa, F. Maekawa, and Y. Ikeda, Nucl. Instrum. Methods A 459, 581 (2001).
- (53) B. Fogelberg, K. A. Mezilev, H. Mach, V. I. Isakov, and J. Slivova, Phys. Rev. Lett. 82, 1823 (1999).
- (54) K. A. Mezilev, Yu. N. Novikov, A. V. Popov, B. Fogelberg, and L. Spanier, Phys. Scr. T56, 272 (1995).
- (55) M. Graefenstedt, U. Keyser, F. Münnich, and F. Schreiber, AIP Conf. Proc. 164, 30 (1987).
- (56) M. Samri, G. J. Costa, G. Klotz, D. Magnac, R. Seltz, and J. P. Zirnheld, Z. Phys. A 321, 255 (1985).
- (57) K.-L. Kratz, A. Schröeder, H. Ohm, H. Gabelmann, W. Ziegert, B. Steinmüller, and B. Pfeiffer, in Proceedings of the 7th International Conference on Atomic Masses and Fundamental Constants AMCO-7, edited by O. Klepper (Technishe Hochschule Darmstadt Lehrdruckerei, Damstadt, 1984), p. 127.
- (58) F. Schussler, J. Blachot, E. Monnand, J. A. Pinston, and B. Pfeiffer, Z. Phys. A 283, 43 (1977).
- (59) E. Lund and G. Rudstam, Nucl. Instrum. Methods 134, 173 (1976).
- (60) N. R. Johnson and G. D. O’Kelley, Phys. Rev. 114, 279 (1959).
- (61) M. Groß, P. Jürgens, U. Keyser, S. Kluge, M. Mehrtens, S. Müller, F. Münnich, J. Wulff, and H. R. Faust, Nucl. Instrum. Methods A 311, 512 (1992).
- (62) E. Monnand, R. Brissot, L. C. Carraz, J. Crançon, C. Ristori, F. Schussler, and A. Moussa, Nucl. Phys. A195, 192 (1972).
- (63) F. K. Wohn and W. L. Talbert, Jr., Phys. Rev. C 18, 2328 (1978).
- (64) G. Audi, A. Coc, M. Epherre-Rey-Campagnolle, G. Le Scornet, C. Thibault, and F. Touchard, Nucl. Phys. A449, 491 (1986).
- (65) M. Przewloka, A. Przewloka, P. Wächter, and H. Wollnik, Z. Phys. A 342, 27 (1992).
- (66) M. Shibata, T. Shindou, K. Kawade, Y. Kojima, A. Taniguchi, Y. Kawase, and S. Ichikawa, in Exotic Nuclei and Atomic Masses, ENAM2001, edited by J. Äystö, P. Dendooven, A. Jokinen, and M. Leino (Springer-Verlag, Berlin, Heidelberg, 2001), p. 479.
- (67) R. C. Greenwood and M. H. Putnam, Nucl. Instrum. Methods A 337, 106 (1993).
- (68) M. Hellström, B. Fogelberg, L. Spanier, and H. Mach, Phys. Rev. C 41, 2325 (1990).
- (69) F. Schima and T. Katoh, Phys. Rev. 140, B1496 (1965).
- (70) W. R. Daniels and D. C. Hoffman, Phys. Rev. 147, 845 (1966).
- (71) J. M. D’Auria, R. D. Guy, and S. C. Gujrathi, Can. J. Phys. 51, 686 (1973).
- (72) N. A. Morcos, W. D. James, D. E. Adams, and P. K. Kuroda, J. Inorg. Nucl. Chem. 35, 3659 (1973).
- (73) P. Möller, J. R. Nix, W. D. Myers, and W. J. Swiatecki, At. Data Nucl. Data Tables 59, 185 (1995).
- (74) S. Goriely, M. Samyn, P.-H. Heenen, J. M. Pearson, and F. Tondeur, Phys. Rev. C 66, 024326 (2002).
- (75) S. Goriely, M. Samyn, J. M. Pearson, and M. Onsi, Nucl. Phys. A750, 425 (2005).
- (76) F. Tondeur, S. Goriely, J. M. Pearson, and M. Onsi, Phys. Rev. C 62, 024308 (2000).
- (77) J. Duflo and A. P. Zuker, Phys. Rev. C 52, R23 (1995).
- (78) H. Koura, T. Tachibana, M. Uno, and M. Yamada, Prog. Theor. Phys. 113, 305 (2005).
- (79) S. Goriely, AIP Conf. Proc. 529, 287 (2000).
- (80) G. Savard, S. Baker, C. Davids, A.F. Levand, E.F. Moore, R.C. Pardo, R. Vondrasek, B.J. Zabransky, and G. Zinkann, Nucl. Instrum. Methods B 266, 4086 (2008).
- (81) C. N. Davids, D. Peterson, Nucl. Instrum. Methods B 266, 4449 (2008).