Modelling chemical abundance anticorrelations on globular cluster spectra–References
Modelling chemical abundance anticorrelations on globular cluster spectra
Abstract
It is widely accepted that individual Galactic globular clusters harbor two coeval generations of stars, the first one born with the ‘standard’ -enhanced metal mixture observed in field Halo objects, the second one characterized by an anticorrelated CN-ONa abundance pattern overimposed on the first generation, -enhanced metal mixture. We have investigated with appropriate stellar population synthesis models how this second generation of stars affects the integrated spectrum of a typical metal rich Galactic globular cluster, like 47 Tuc. Our main conclusions are: 1) the age-sensitive Balmer line, Fe line and the [MgFe] indices widely used to determine age, Fe and total metallicity of extragalactic systems are largely insensitive to the second generation population; 2) enhanced He in second generation stars affects the Balmer line indices of the integrated spectra, through the change of the turn off temperature and the horizontal branch morphology of the underlying isochrones, which translate into a bias towards slightly younger ages.
keywords:
stellar population models – galactic globular clusters1 Introduction
A large body of spectroscopic data published in the last 10 years has conclusively established the existence of primordial surface chemical abundance variations of C, N, O, Na in individual Galactic globular clusters (GCs) of all metallicities, from very metal rich objects like NGC6441, to the most metal poor ones like M15 (see, e.g., Carretta et al., 2010).
The accepted working scenario to explain these CNONa anticorrelations prescribes that the stars currently evolving in a GC were born with the observed CNONa patterns. Intermediate-mass asymptotic giant branch (AGB) stars in the range (and/or the slightly more massive super-AGB stars) and massive rotating stars are considered viable sources of the necessary heavy-element pollution (see, e.g., Ventura & D’Antona, 2005). Slow winds from the envelopes of AGB (or super-AGB stars) or from the equatorial disk formed around fast rotating massive stars inject matter into the intra-GC medium after a time of order yr, depending on the polluter. Provided that a significant fraction of the material is not lost from the cluster, new stars (second generation, but essentially coeval with the polluters’ progenitors, given their short evolutionary timescales) may be able to form directly out of pristine gas polluted to varying degrees by these ejecta, that will show the observed anticorrelation patterns. Another by product of this pollution may possibly be an enhanced initial He-abundance for these second generation stars. Recent numerical models by D’Ercole et al. (2010) have started to explore in quantitative details this broad picture.
2 Models
We have started by modelling a reference set of -enhanced SSPs – metal mixture with [/Fe] 0.4 – with ages t=12 and 14 Gyr, which we identify hereafter as standard models. We have considered in this investigation a single [Fe/H]=0.7 (=0.008), typical of the metal rich subpopulations of Milky Way – and of 47Tuc, whose integrated spectrum is a benchmark for population synthesis models – and an initial He mass fraction =0.256. For both ages we have then considered a second generation population (modified CNONa models) whose metal composition has C decreased by 0.30 dex, N increased by 1.20 dex, O decreased by 0.45 dex and Na increased by 0.60 dex with respect to the first generation -enhanced mixture, all other metal abundances being unchanged. This pattern is typical of values close to the upper end of the observed anticorrelation patterns in Galactic GCs (Carretta et al., 2009). The metal distribution of this second generation coeval population has the same C+N+O sum and the same Fe abundance (as a consequence also the total metallicity will be practically the same) as the first generation composition, in agreement with spectroscopic measurements on second generation stars within individual Galactic GC. For both the 12 and 14 Gyr second generation populations we have accounted for two alternative values of , e.g. =0.256 – as in the first stellar generation – and =0.300, to include a possible enhancement of He in second generation stars. This latter, hereafter identified as He enhanced models, is consistent with constraints on the typical enhancement of He in Galactic GCs, as determined by Bragaglia et al. (2010).
We stress that these choices for the chemical composition of second generation populations are very general, and should give us a realistic estimate of their impact on GC analyses using SSPs. Overall, our selection of representative extreme values of the CNONa variations will provide a first important indication of the maximum effect of these abundance anomalies on GC integrated spectra, and will serve as a guideline to interpret the abundance pattern derived from fitting SSPs to the observed spectra of Galactic and extragalactic GCs.
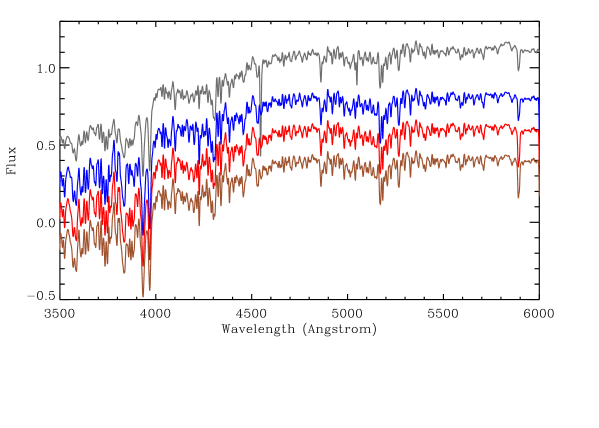
The SSP models were computed adopting isochrones from BaSTI (Pietrinferni et al., 2006) and a stellar synthetic grid computed with ATLAS12 (Kurucz & Avrett, 1981; Castelli, 2005) and SYNTHE (Kurucz & Avrett, 1981; Sbordone et al., 2004) codes. One synthetic grid was computed for each set of models – reference -enhanced, second gereration with Y=0.256 and second generation with Y=0.300 – properly taking the respective chemical mixture into account. From the appropriate isochrone and grid of synthetic stellar spectra we have calculated the integrated spectrum for these first and second generation populations, employing the Kroupa (2001) initial mass function. The integrated spectra modelled cover the wavelength region 3500 to 6000 at a spectral resolution . We refer the reader to Coelho et al. (2011) for more details on our models.
We show in Fig. 1 the spectral models for 12 Gyr populations.
3 Results
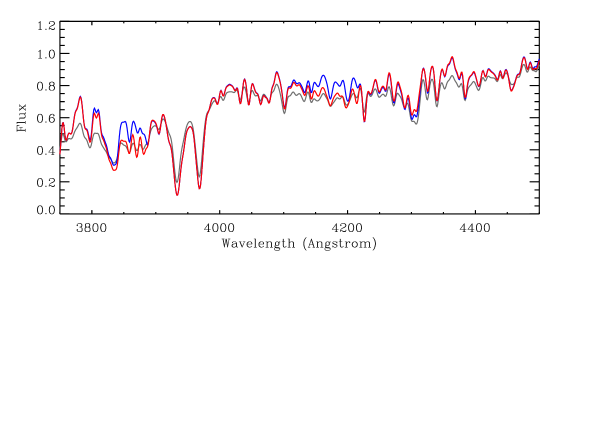
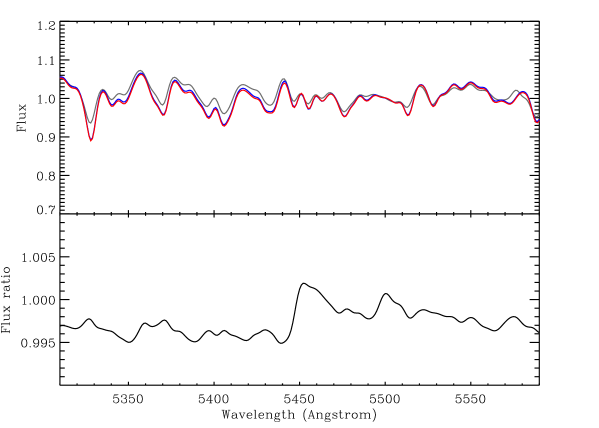
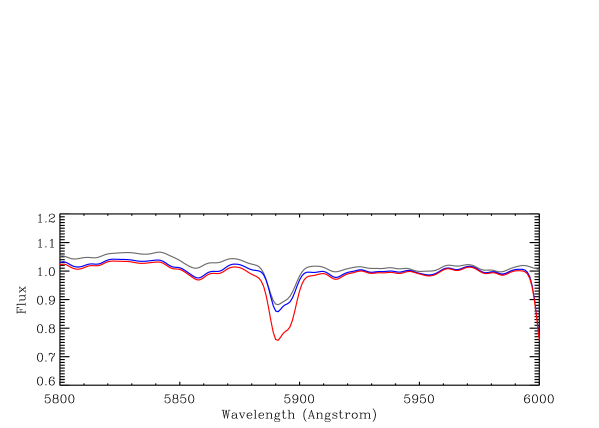
In Figs. 2 to 4 we zoom some regions of the spectra – known to be sensitive to C, N, Na and atomic O – to highlight the effect (or absence of an effect) of the abundance change on the stellar population spectra. In the case of C and N (Fig. 2) and Na (Fig. 4), the effect is clearly seen in the spectra. In the case of atomic oxygen, the effect is so small (lower than 0.5% in flux) that the two models are indistinguishable.
The effect of the CNONa modified abundances on Lick/IDS spectral indices has been presented in detail in Coelho et al. (2011). To summarize, the presence of a second generation of GC stars with unchanged He-content affects appreciably only the Ca4227, G4300, , and NaD metal indices. Very importantly, the variation of Ca4227 goes in the direction to mimic a lower Ca abundance, if this index is used as a measure of the Ca content. Our results support Lee & Worthey (2005) suggestion that the effect of a second generation population with CNONa anticorrelations may explain the discrepancies they find when comparing Ca4227, , and NaD index strength (on the Lick IDS system) from their -enhanced SSP models, with data for Galactic and M31 GCs. On the other hand, age, Fe-abundance and inferred from -Fe5406 and -[MgFe] diagrams (or the and, to a slightly smaller extent, the counterpart) are confirmed once again to be robust and insensitive to the chemical abundance pattern of second generation stars.
When we consider the case of a second generation population with enhanced He-abundance (=0.300), the values of all metal indices in this second generation population are essentially identical to the =0.256 case, but the Balmer line indices are changed by the increase of He, mimicking an age younger by 2 Gyr. We detected that the changes in , and compared to the =0.256 case are due to differences in the underlying isochrone representative of the He-enhanced second generation population. The TO and main sequence of the underlying isochrone are hotter by 100 K compared to the =0.256 isochrone. Given that the TO mass at fixed age is smaller (by about 0.07 in our case) in the He-enhanced isochrone, and we assume that the total mass lost along the RGB is the same (0.11 ), the mass evolving along the HB is smaller, hence the typical of HB stars is higher, again by 100 K. These higher values for TO and HB increase the value of the Balmer line indices.
It remains yet to be studied what is the effect of modified CNONa (and He) abundances on the metallicites and ages derived via spectral fitting codes (e.g Koleva et al., 2009). On the other hand, one might test the possibility to measure abundances – beyond iron and -elements – with spectral fitting (e.g. by using these models to differentially correct stellar populations, see Walcher et al. 2009).
It is likely possible to detect the existence of those abundance changes in the residuals of a spectral fitting analysis. At a first approximation, we could assume the residuals due a significant change on the CNONa abundance will show a pattern similar to the differential spectrum between our standard and modified CNONa models, shown in Fig. 5. The signal of C and N are clearly seen, as the modified CNONa abundances enhances the CN features by up to 30% in flux. In fact, primordial abundance variations such as the ones explored in this modelling might be an explanation for the long term problem of the particularly strong CN bands in globular clusters in M31, when compared to the ones of the Milky Way (e.g. Burstein et al., 1984; Trager, 2004). In Fig. 6 is shown the ratio between the He enhanced and modified CNONa models, to illustrate the effect of enhancing He alone. We note that features related to the hydrogen lines and the small change of the continuum slope, characteristic of an integrated ”hotter” model, are in agreement with the explanation above on the effect of the He enhancement on the TO and HB temperatures.


4 Conclusions
We explored the effects that primordial abundance changes of C, N, O and Na have on integrated spectra of a typical metal-rich galactic globular cluster. These variations affect appreciably only the Ca4227, G4300, , and NaD metal indices. Ages, Fe-abundances and inferred from -Fe5406 and -[MgFe] diagrams (or the and, to a slightly smaller extent, the counterpart) are confirmed once again to be robust. If the CNONa changes are accompanied by He enhancement, there might be a bias towards younger age determinations of up to 2 Gyr. We refer the reader to Coelho et al. (2011) for the complete results.
The effect of these abundance changes on ages and metallicities derived via spectral fitting techniques remains to be quantified. It might be particularly interesting to explore if these primordial abundance variations can explain the strong CN features observed in globular clusters in M31 (the author thanks Scott Trager for pointing this out).
Acknowledgements
PC acknowledges the financial support by FAPESP via project 2008/58406-4 and fellowship 2009/09465-0, and is particularly grateful to Fiorella Castelli, Piercarlo Bonifacio and the kurucz-discuss mailing list for the help with ATLAS and SYNTHE codes.
References
- Bragaglia et al. (2010) Bragaglia, A., Carretta, E., Gratton, R., D’Orazi, V., Cassisi, S., & Lucatello, S. 2010, A&A, 519, A60
- Burstein et al. (1984) Burstein, D., Faber, S. M., Gaskell, C. M., & Krumm, N. 1984, ApJ, 287, 586
- Castelli (2005) Castelli, F. 2005, Memorie della Societa Astronomica Italiana Supplement, 8, 25
- Carretta et al. (2009) Carretta, E. et al. 2009, A&A, 505, 117
- Carretta et al. (2010) Carretta, E., Bragaglia, A., Gratton, R. G., Recio-Blanco, A., Lucatello, S., D’Orazi, V., & Cassisi, S. 2010, A&A, 516, 55
- Coelho et al. (2011) Coelho, P., Percival, S. M., & Salaris, M. 2011, ApJ, 734, 72
- D’Ercole et al. (2010) D’Ercole, A., D’Antona, F., Ventura, P., Vesperini, E., & McMillan, S. L. W. 2010, MNRAS, 407, 854
- Koleva et al. (2009) Koleva, M., Prugniel, P., Bouchard, A., & Wu, Y. 2009, A&A, 501, 1269
- Kroupa (2001) Kroupa, P. 2001, MNRAS, 322, 231
- Kurucz & Avrett (1981) Kurucz, R. L., & Avrett, E. H. 1981, SAO Special Report, 391,
- Lee & Worthey (2005) Lee, H.-c., & Worthey, G. 2005, ApJS, 160, 176
- Pietrinferni et al. (2006) Pietrinferni, A.,Cassisi, S., Salaris, M., & Castelli, F. 2006, ApJ, 642, 797
- Sbordone et al. (2004) Sbordone, L., Bonifacio, P., Castelli, F., & Kurucz, R. L. 2004, Memorie della Societa Astronomica Italiana Supplement, 5, 93
- Schiavon et al. (2005) Schiavon, R. P., Rose, J. A., Courteau, S., & MacArthur, L. A. 2005, ApJS, 169, 163
- Trager (2004) Trager, S. C. 2004, Origin and Evolution of the Elements, 388
- Ventura & D’Antona (2005) Ventura, P., & D’Antona, F. 2005, ApJ, 635, L149
- Walcher et al. (2009) Walcher, C. J., Coelho, P., Gallazzi, A., & Charlot, S. 2009, MNRAS, 398, L44