Pressure-induced transition from the dynamic to static Jahn-Teller effect
in (Ph4P)2IC60
Abstract
High-pressure infrared transmission measurements on (Ph4P)2IC60 were performed up to 9 GPa over a broad frequency range (200 - 20000 cm-1) to monitor the vibrational and electronic/vibronic excitations under pressure. The four fundamental T1u modes of C are split into doublets already at the lowest applied pressure and harden with increasing pressure. Several cation modes and fullerene-related modes split into doublets at around 2 GPa, the most prominent one being the G1u mode. The splitting of the vibrational modes can be attributed to the transition from the dynamic to static Jahn-Teller effect, caused by steric crowding at high pressure. Four absorption bands are observed in the NIR-VIS frequency range. They are discussed in terms of transitions between LUMO electronic states in C, which are split because of the Jahn-Teller distortion and can be coupled with vibrational modes. Various distortions and the corresponding symmetry lowering are discussed. The observed redshift of the absorption bands indicates that the splitting of the LUMO electronic states is reduced upon pressure application.
pacs:
33.20.Ea,33.20.Wr,71.70.EjI Introduction
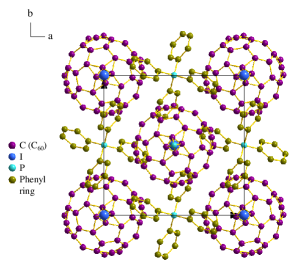
Tetraphenylphosphonium iodide-C60 [(Ph4P)2IC60] is a prototype to study C radical anion in a solid state environment, as large cations (Ph4P)2I are so well positioned that they separate the C60 ions from each other (see Fig. 1). The weak coupling between the C and the (Ph4P+)X- structural units was demonstrated by Raman measurements on (Ph4P)2C60X (X=Cl, Br, I) showing the insensitivity of the spectra to the halogen anion.Sauvajol97 The compounds (Ph4P)2C60X have the advantage of being air stable unlike the other fullerides. Also they can be grown as single crystals in contrast to the powder form of several other fullerides. (Ph4P)2IC60 crystallizes in a tetragonal structure with the space group I4/m.Penicaud93 ; Bilow95 ; Pilz02 At room temperature, the dynamic nature of the Jahn-Teller (JT) effect in (Ph4Y)2XC60 (Y = P or As, X = Cl, I, or Br) was shown by electron spin resonance (ESR), nuclear magnetic resonance (NMR), and infrared (IR) spectroscopy.long98 ; long99 ; long07
Theoretically, the dynamic JT effect for singly charged fullerene C is expected to be reflected in the IR spectrum. At room temperature, the dynamic disorder between different orientations of the C is signalled in the infrared spectrum by the splitting of the T1u fundamental modes of fullerene and the activation of silent modes. Neutral C60 possesses the highest Ih symmetry with 174 possible vibration modes, out of which only four T1u modes are infrared active due to symmetry considerations. The temperature dependence of the JT dynamics was studied on these compounds by far-infrared spectroscopy.long98 ; long99 ; long07 ; Bietsch2000 ; Gotschy94 ; Becker93 ; Volkel95 ; Gotschy96
Another experimental evidence for the dynamic nature of the JT effect in [(Ph4P)2IC60] was obtained by ESR,Bietsch2000 ; Gotschy94 ; Becker93 ; Volkel95 ; Gotschy96 namely by the splitting of the LUMO of C above 40 K through an Orbach spin-lattice relaxation process.Volkel95 The ESR results Bietsch2000 on [A+(C6H5)4]2C60-B- (where A = P or As and B = I or Cl) indicate static disorder with random occupation of two “standard orientations” at low temperature. Ordering phenomena were also found in x-ray diffuse scattering and diffraction measurements: Launois et al. Launois2000 found evidence for a structural phase transition in (Ph4P+)2C60-Br- at around 120 K during cooling down, where the C60 molecules show an orientational order with the formation of two types of orientational domains. Simultaneously, the average crystal structure is changed from I4/m to I2/m, and the related lowering of the crystal field symmetry leads to a static stabilization of the JT distortion of the C molecule.Launois2000 This scenario is consistent with the results of far-infrared transmission measurements, which revealed a weak transition in the range 125-150 K.long98 Later on, based on x-ray diffraction dataPilz02 a glass transition was proposed to occur in Ph4As)2ClC60 at 125 K, where the dynamic disorder of the C60 molecules over two orientations becomes static. Besides, an upper bound of 0.01Å for the JT distortion of the C60 molecules was established.Pilz02
The goal of this work was to study the pressure-induced effects in (Ph4P)2IC60 in detail, as compared to earlier investigations,francis10 and to compare them to those induced by temperature decrease. The interesting similarity between the temperature lowering and increasing pressure is exhibited by C60 and several fullerene based compounds Sundqvist99 ; Thirunavukkuarasu07 ; Thirunavukkuarasu08 . In case of (Ph4P)2IC60 temperature lowering causes a decrease of the lattice constants and the decreasing thermal energy induces a dynamic-to-static JT transition. In comparison, generally the increase in pressure reduces lattice constants but does not change the thermal energy of the system. Hence, the changes of the nature of the JT effect do not necessarily need to be similar during temperature lowering and pressure increase. The goal of this infrared study was to compare the effects of pressure versus temperature lowering on the vibration properties and the electronic and vibronic excitations in (Ph4P)2IC60.
We present the results of high-pressure infrared studies on (Ph4P)2IC60 up to 9 GPa over a broad frequency range between 300–20000 cm-1. As the time scale of infrared measurements (10-11 s-1) is of the order of the JT pseudorotation frequency of the C ion, IR spectroscopy is a powerful tool to investigate the JT dynamics. We can address the symmetry changes of the molecule as a function of pressure. Investigating the electronic transitions of the C anion can help to understand the intermolecular interactions, charge transfer process, and electronic states. For example, it was proposed that the halogen anion radius changes the charge distribution on C, which may alter its vibrational characteristics and electronic absorption.Semkin The pressure dependence of the vibrational and electronic properties of (Ph4P)2IC60 are thus studied in detail.
II Experiment
II.1 Synthesis of (Ph4P)2IC60 crystals
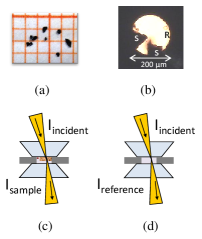
Small single crystals of (Ph4P)2IC60 were grown by electro-crystallization over platinum cathode with a constant current of 30 A. Electrolysis was carried out in the solution of Ph4PI and C60 dissolved in 1:1 mixture of dichloromethane and toluene at ambient conditions Allemand91 . Black shiny crystals of 100-300 m size [see Fig. 2 (a)] were collected from the electrode after 5 days.
II.2 High-pressure infrared measurements
Infrared transmission measurements were carried out with an infrared microscope Bruker IR scope II with 15x magnification coupled to a Bruker 66v/S Fourier transform infrared spectrometer. The high pressure was generated by a Syassen-Holzapfel diamond anvil cell (DAC) Huber77 equipped with type IIA diamonds suitable for infrared measurements. The ruby luminescence method was used for pressure determination Mao86 . The transmission was measured for pressures up to 9 GPa between 200 cm-1 and 20000 cm-1. Finely ground CsI was used as quasi-hydrostatic pressure transmitting medium. Data were collected with resolution of 1 cm-1 for 100–600 cm-1, 2 cm-1 for 550–8000 cm-1 frequency range. For the transmission measurements in the NIR-VIS region a powder sample was mixed with CsI and filled in the DAC. Measurements were carried out with 4 cm-1 resolution in the NIR-VIS region. All measurements were carried out at room temperature. A microscopic view of the DAC filled with samples, the pressure transmitting medium, and the ruby ball is shown in Fig. 2(b).

In order to determine the transmittance of (Ph4P)2IC60 under pressure, the intensity Is() of the radiation transmitted by the sample or by the mixture of the powder sample and the pressure transmitting medium was measured, as illustrated in Fig. 2(c). As reference, the intensity Ir() transmitted by the pressure transmitting medium inside the DAC was used, as shown in Fig. 2(d). The transmittance was then calculated according to T()=Is()/Ir() and the absorbance is given by A=log10(1/T).
III RESULTS AND DISCUSSION
III.1 Assignment of excitations at lowest pressure
| Mode position | Pressure dependence | Strength | Assignment |
| (at 0.1 GPa) | |||
| (cm-1) | |||
| 398 | hardens, doublet above 2 GPa | w | Gu(1) |
| 509 | softens | w | - |
| 525 | hardens | s | cation |
| 517, 533 | doublet, hardens | m,s | T1u(1) |
| 576, 578 | doublet, hardens | s,m | T1u(2) |
| 619 | hardens, doublet above 2 GPa | w | cation |
| 665 | sharpens, hardens, doublet 2 GPa | w | - |
| 689, 695 | doublet, hardens | s,m | cation |
| 721, 726 | doublet, hardens, triplet above 2GPa | s,s | cation |
| 756 | slope change above 2 GPa | s | cation |
| 844, 848 | doublet, hardens | w,w | C |
| 975 | gains intensity, hardens | w | cation |
| 998 | doublet above 2 GPa, hardens | m | cation |
| 1072 | hardens | w | C |
| 1108, 1114 | doublet, hardens | s,s | - |
| 1177, 1182 | doublet, hardens | w,w | T1u(3) |
| 1201 | hardens, undetectable above 3 GPa | w | - |
| 1320 | hardens, doublet at very high P | w | cation |
| 1364, 1395 | doublet at low P; hardens | w,s | T1u(4) |
| 1435, 1440 | hardens, doublet | s,s | cation |
| 1482 | hardens, doublet above 2 GPa | m | cation |
| 1585 | hardens, sharp up to high P | m | cation |
| 3047, 3056, 3076, 3088 | multiplet, hardens | m,s,w,w | - |
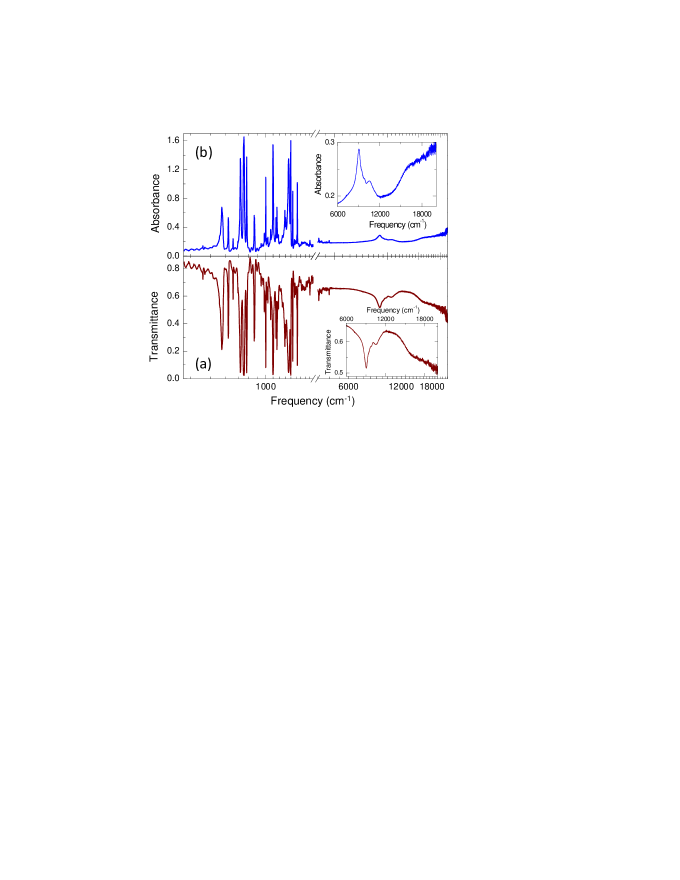
(Ph4P)2IC60 contains singly charged fulleride anions, with nearly isolated C anions in the solid state environment due to the large sized cation (see Fig. 1). The infrared transmittance and absorbance spectra of (Ph4P)2IC60 are presented in Fig. 3 between 300 and 20000 cm-1 at room temperature. A small region of the spectrum is cut out between 2000-4000 cm-1 due to multiphonon absorption in the diamond anvils. The vibrational modes are observed in the far- and mid-infrared region, whereas the electronic transitions appear in the NIR-VIS region between 6000–12000 cm-1 (see inset of Fig. 3). The frequency positions, relative strengths, and assignments of the vibrational modes are listed in Table 1.
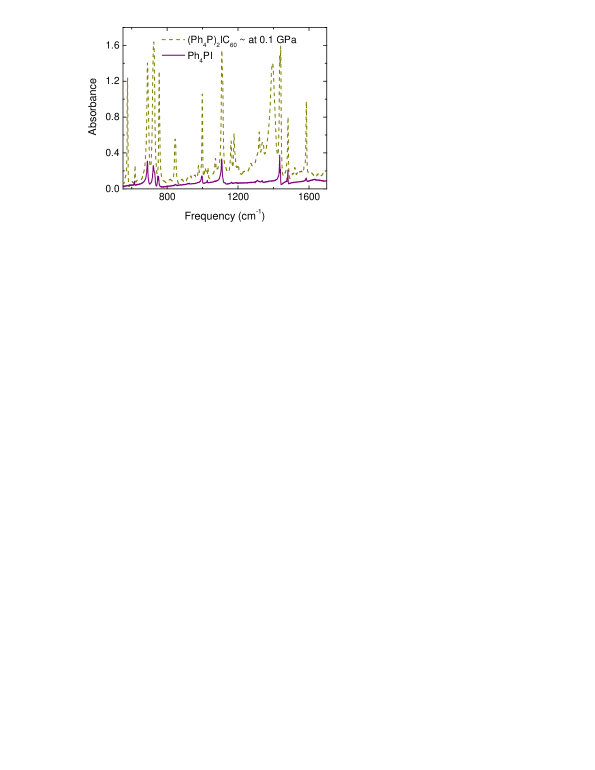
It is apparent from the infrared spectrum of (Ph4P)2IC60, that it contains numerous vibrational modes of C and of the (Ph4P+)2I cation in the FIR and MIR region. In order to illustrate the contribution of the cation to the richness of the (Ph4P)2IC60 vibrational spectrum, Fig. 4 shows the infrared absorbance spectrum of (Ph4P)2IC60 (at 0.1 GPa) in comparison with that of pure (Ph4P)2I at ambient conditions.
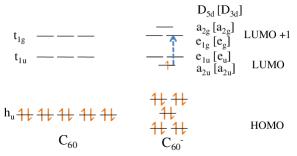
We first focus on the four fundamental T1u modes of C and the electronic transitions observed in the lowest-pressure absorbance spectrum of (Ph4P)2IC60, as depicted in Fig. 5 and 6, respectively. Neutral C60 has a triply degenerate, empty LUMO (lowest unoccupied molecular orbital) and a completely filled HOMO (highest occupied molecular orbital) (see Fig. 7). When the C60 molecule is doped with electrons, the symmetry is lowered depending on the number of electrons added. The LUMO of C60 can be occupied by up to six electrons. Such addition of electrons to the C60 molecule causes a disturbance in the spherical distribution of the electron cloud. In case of C, the additional electron causes a change in the C–C and C=C bonds near the poles. Such stretched bonds are nearly in the direction of the symmetry axis, therefore the spherical C60 becomes ellipsoidal C Koga92 . This in turn induces the JT distortion, causing the splitting of the LUMO levels. The JT effect depends on the number of charges added to the C60. It can induce new electronic transitions, shifts and splittings of the T1u modes, and can lead to the activation of new modes in the vibrational spectra.
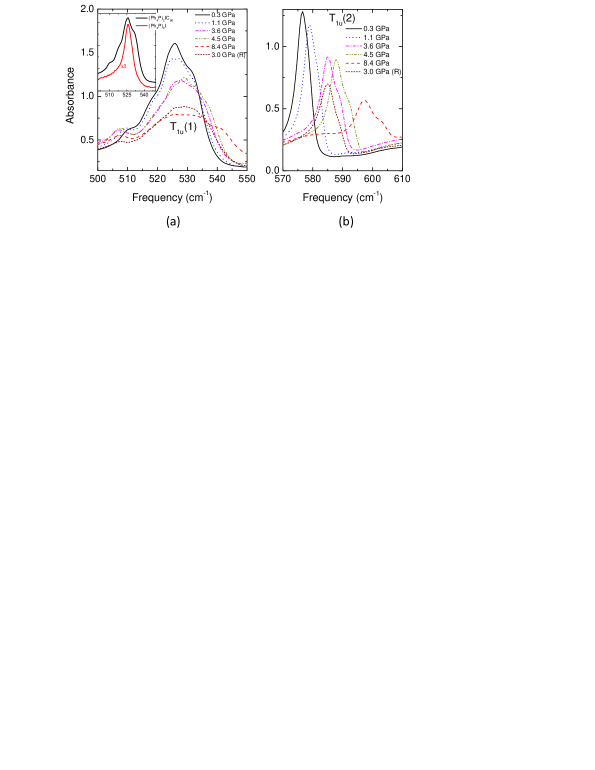
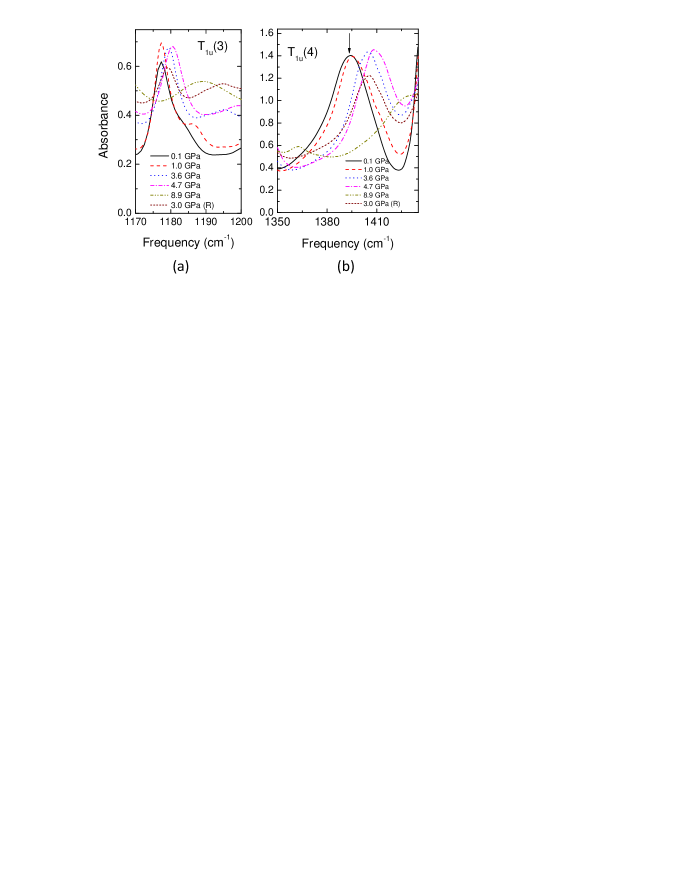
The T1u modes of C60 are governed by the electron-phonon coupling depending on the charge added to the C60 molecules. At room temperature the T1u vibrational modes in neutral C60 are sharp singlets resonating at 527, 576, 1182 and 1428 cm-1,Kratschmer90 whereas the T1u modes of C in (Ph4P)2IC60 are doublets with the frequencies (1) 517, 533 ,(2) 576, 578, (3) 1177, 1182, and (4) 1364, 1395 cm-1. At the lowest measured pressure all four T1u modes are split into doublets (see Fig. 5). All the T1u modes except T1u(2) show a redshift compared to C60,Pichler94 attributed to the coupling of the vibrational mode to virtual t1ut1g transitionsRice92 (see scheme in Fig. 7). Furthermore, the T1u modes show strong enhancement of the line width and oscillator strength, and also a change in line shape. Doublet splitting of the T1u modes of the C anion is the signature of the JT effect in the molecule. The room temperature dynamic JT distortion in (Ph4P)2IC60 was also reported by FIR studies long98 ; long99 . Among these four fundamental vibrational modes, the T1u(4) mode shows the strongest redshift Semkin compared to the neutral C60. Furthermore there are silent fullerene modes which become infrared active in (Ph4P)2IC60 due to symmetry lowering, like the Gu(1) mode at 398 cm-1. The infrared-active cation phonon modes contribute to the richness of the absorbance spectrum as well.
The doublet splitting of the T1u(1) and T1u(2) modes found in our lowest-pressure data is consistent with an earlier report.long98 Long et al. long98 studied the temperature dependence of vibrational modes and found anomalies in the shift of the frequency positions in the temperature range 125 – 150 K. For example, the Gu(1) mode at 398 cm-1 is reported as a singlet at room temperature and undergoes a doublet splitting during cooling below 150 K. The vibrational mode observed by Long et al. long98 at 504 cm-1, which softens on lowering the temperature, is shifted to 509 cm-1 in our data. Besides, the vibrational mode at 619 cm-1 only shows a minute frequency shift on lowering the temperature and flattens out below 125 K. The temperature dependence of the vibrational modes will be compared to our pressure-dependent results presented in Section III.2.
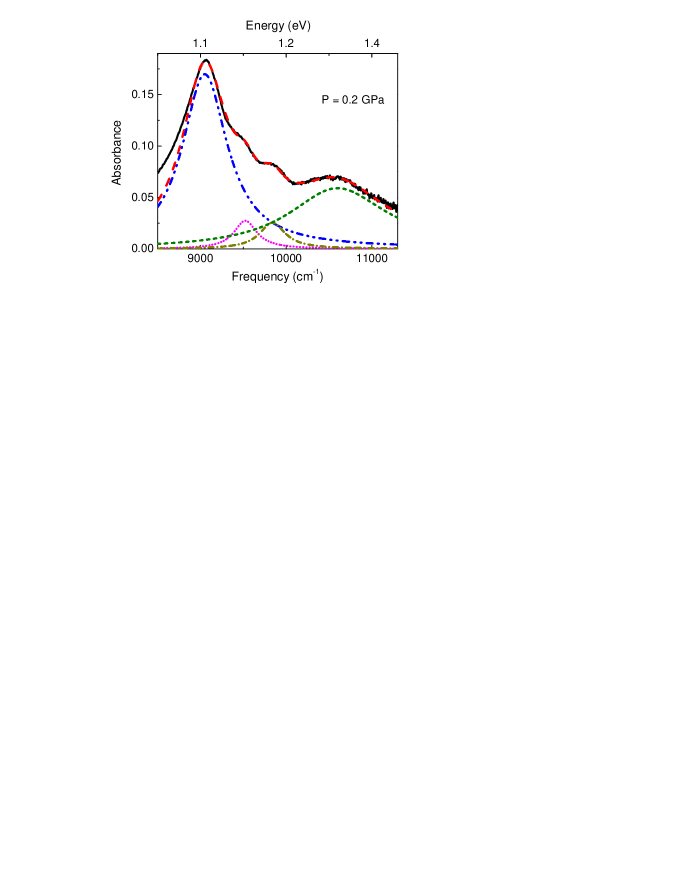
In C the electronic states are coupled to vibrational modes, which gives rise to vibronic transitions. The electronic and vibronic transitions are clearly observed between 6000-12000 cm-1 in the NIR region in Fig. 3. For better lucidity the NIR-VIS region is presented in the inset. Fig 6 shows the electronic transition in the NIR-VIS region of the spectrum with the four contributions obtained from the fitting with Lorentz oscillators. To obtain a very good fit on the low-frequency side an additional oscillator is required for describing the background, which does not affect the frequency positions of the other main oscillators representing the electronic transitions. Besides the prominent feature at 9050 cm-1, three absorption bands between 9300 and 11000 cm-1 are observed.
Several NIR investigations report similar spectra on C in solution Kondo95 and isolated C Tomita05 . Electronic transitions of isolated C in neon matrices showed well resolved spectra.Fulara1993 The environment in which the C anion is investigated is an important criterion to determine the nature of the distortion which can either be static or dynamic. On the one hand, C60 anions in the solid state are influenced by Coulomb interactions with the cations. On the other hand, even in dilute solutions the influence of the environment can be significant.
In the following, we discuss the four distinct transitions in the NIR-VIS region of the spectrum with the help of the transition scheme in Fig. 7. This scheme is based on the splitting of the t1u and t1g LUMO energy levels, whose degeneracy is lifted in C because of the JT distortion and the related symmetry lowering. According to theoretical investigations, the symmetry for C gives rise to the three possible point groups D5d, D3d or D2h, which possess nearly the same JT energies.Koga92 On an adiabatic potential energy surface there are 6 equivalent structures possible for D5d minima, 10 for D3d minima, and 15 for D2h minima.Koga92 Due to the equivalent energy the dynamic transformation among these distortions can take place. In case of D5d symmetry, the orbitals (2t1u and 2t1g) undergo a doublet splitting into (2a2u, 2e1u) and (2e1g, 2a2g), respectively, while for D3d it would be (2a2u, 2eu) and (2eg, 2a2g), respectively. The splitting of the energy levels is illustrated in Fig. 7. For both D5d and D3d symmetry reduction a single optically allowed transition of the form a2u eg is expected (see Fig. 7). The different orientations for D5d and D3d distortions are separated by shallow energy minima which are connected by pseudorotation causing the disorder in the dynamic system. In case of D2h symmetry, the 2t1u and 2t1g levels undergo a triplet splitting into (2b1u, 2b2u, 2b3u) and (2b1g, 2b2g, 2b3g), respectively. Thus, a D2h distortion of the fullerene molecule would give rise to two optically allowed transitions of the type b1u b3g and b1u b2g Kondo95 . It has been suggested that the D2h symmetry can be stabilized only in a crystal field, but not in the case of a free CChaney97 . The possibility of D2h symmetry for C has been ruled out due to the narrow line in the FIR spectrum reported earlier long98 .
According to Lawson et al. Lawson1992 the features in the NIR region are due to the symmetry reduction to D5d of the isolated C anion investigated in benzonitrile solution. The strong feature at 1078 nm (9276 cm-1) in the spectrum is attributed to the optically allowed a2u e1g transition which is in accordance with the density functional calculations by Green et al. Green96 . The manifold around 800–1000 nm (10000–12500 cm-1), which is not very well resolved in Ref. Lawson1992, , is assigned to the vibronic transitions to the level a2g. In a recent NIR investigation on C carried out by Hands et al. Hands08 , a well-resolved spectrum in the region 9000–13000 cm-1 is presented. They discuss the possibility of D3d and D5d symmetry and claim that the four contributions in the NIR region are due to the D3d symmetry, and that the spectrum would have fewer contributions in case of D5d symmetry. C ion prepared in other media like in gas matrix Fulara1993 , by electro-generation G.A.Heath and in salts Bolskar95 were also studied at ambient conditions. Also theoretical calculations Koga92 ; I.D.Hands have been carried out to explain the complicated electronic transition observed in C. Hands et al.I.D.Hands state that the dynamics for a minimum of D5d symmetry is simpler than that of D3d due to the tunneling splitting between symmetry adapted states that correctly describe tunneling between equivalent minima. Obviously, there are alternative explanations for the results reported in Ref. Lawson1992, .
According to the above described earlier theoretical and experimental results, we interpret our NIR absorbance spectrum for the lowest pressure in terms of a C molecule dynamically fluctuating between D3d and D5d symmetry. Within this picture, the t1u and t1g (LUMO and LUMO+1, respectively) levels are split into two levels I.D.Hands ; Green96 (see scheme in Fig. 7). We interpret the NIR spectrum as the combination of electronic and manifold vibronic transitions. The prominent feature at 9049.8 cm-1 is due to the optically allowed a2ue1g transition either in D5d or D3d symmetry. The manifold between 9300 and 11000 cm-1 is due to vibronic transitions. Based on our FIR-MIR data and earlier resultslong98 we suggest the symmetry of C near ambient conditions to be governed by the dynamic JT effect (presumably of D3d and D5d symmetry). However, a further symmetry lowering, for example from D5d to C2h or Ci, cannot be ruled out, as pointed out recently in the case of (Ph4As)2ClC60.long07
III.2 Pressure dependence of vibrational modes and electronic transitions of (Ph4P)2IC60
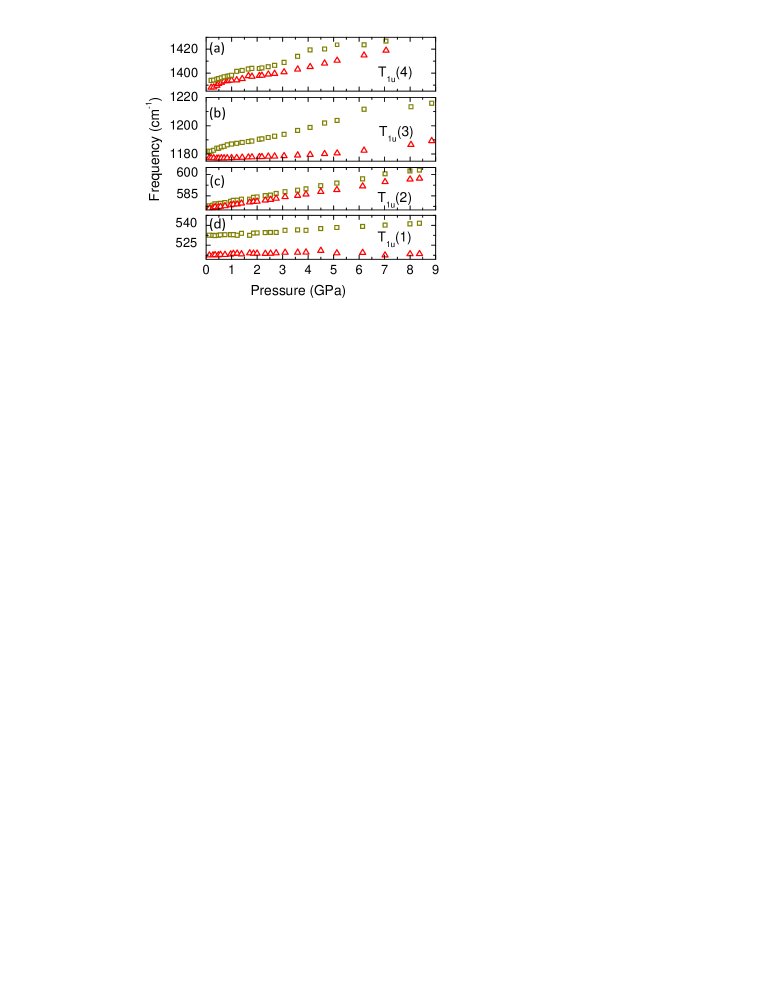
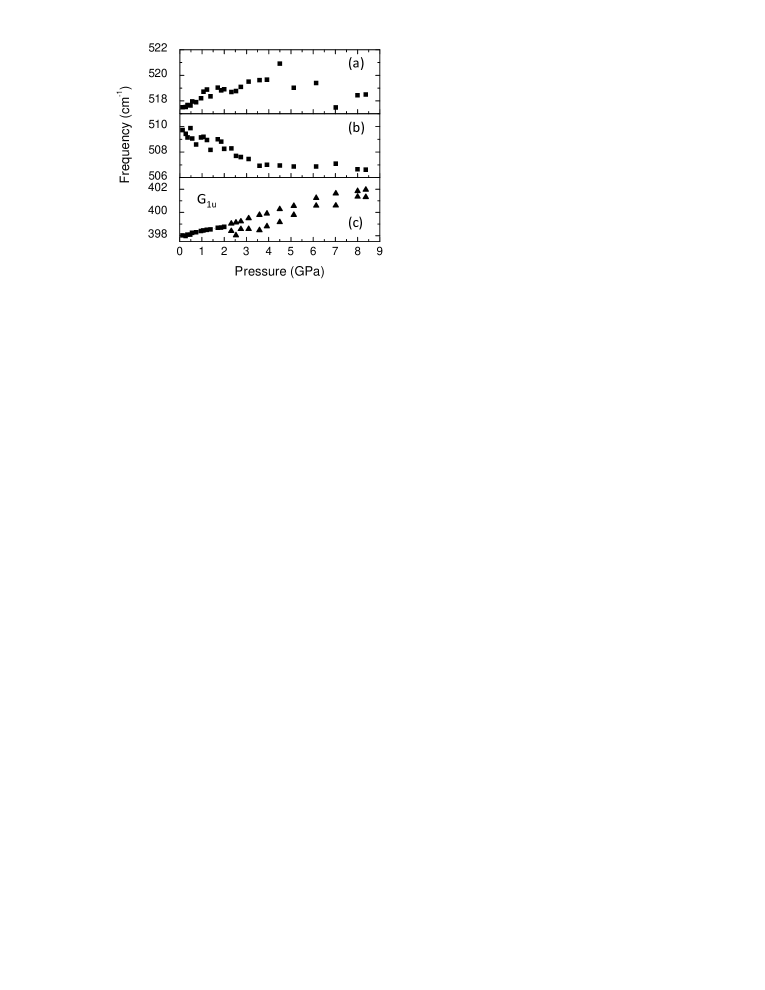
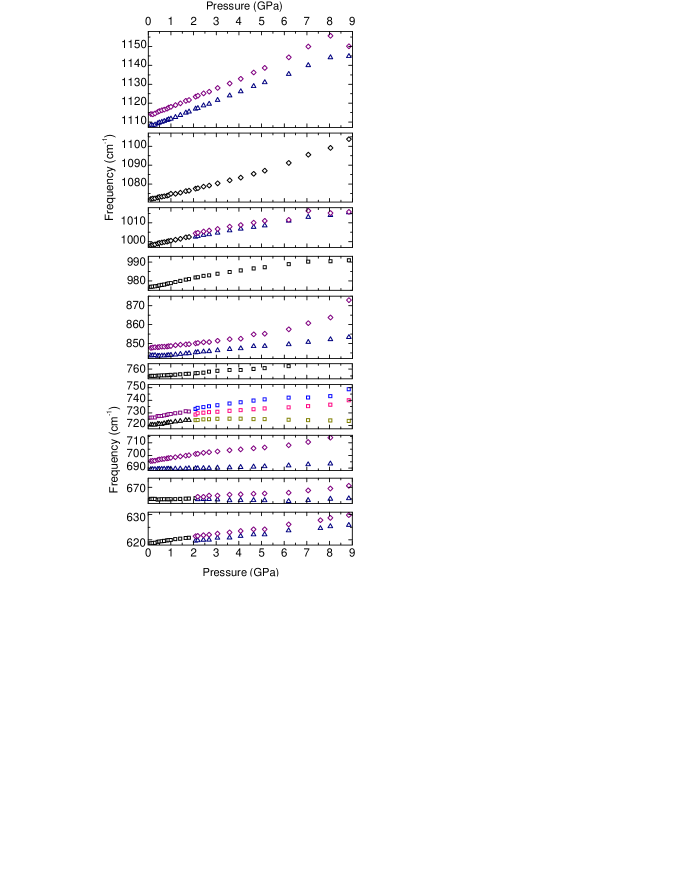
Next we will focus on the effect of pressure on the vibrational and electronic excitations in (Ph4P)2IC60. For a quantitative analysis, the frequency positions of the vibrational modes were extracted by fitting the modes with Lorentzian functions. The pressure dependence of all modes is summarized in Table 1. Fig. 8 and 9 show the four fundamental T1u vibrational modes of C for selected pressures. The T1u(1) is strongly overlapped by a counterion mode, as illustrated in the inset of Fig. 8 (a). Also the (Ph4P)+ cation modes undergo pressure-induced changes [see Fig. 8 (a)]; this complicates the analysis of this mode. The pressure dependent frequencies of T1u vibrational modes are plotted in Fig. 10. It is evident that all the T1u modes are split into doublets at near-ambient conditions and harden with increasing pressure. We do not observe any anomaly in the pressure dependence of their frequency positions, in contrast to the findings as a function of temperature long98 . Fig. 12 (a) shows the pressure dependence of the cation modes at around 518 cm-1, close to the T1u(1) mode’s position.
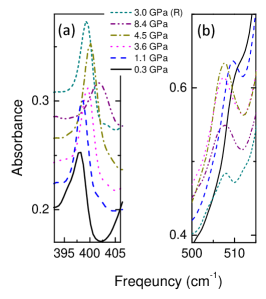
The other prominent vibrational modes in the FIR region are the Gu(1) mode at 398 cm-1, depicted in Fig. 11 (a) for various pressures, and another mode at 509 cm-1 [see Fig. 11 (b)], whose assignment is not clear. The frequency positions of these modes are plotted as a function of pressure in Figs.12 (b) and (c). The Gu(1) mode is a singlet at low pressure, hardens with increasing pressure, and becomes a doublet above 2 GPa [see Fig. 12 (c)]. This behavior is consistent with the temperature-dependent results of (Ph4P)2IC60 where the Gu(1) undergoes a two-fold splitting at 150 K while cooling down from room temperature.long98 According to group theory, a two-fold splitting of the Gu mode is expected as the system settles for a lower symmetry. The vibrational mode at 509 cm-1 is one of the few modes which soften with increasing pressure, which is also consistent with the behavior during temperature decrease. The intensity of this mode steadily increases with increasing pressure and remains sharp until the highest pressure applied.
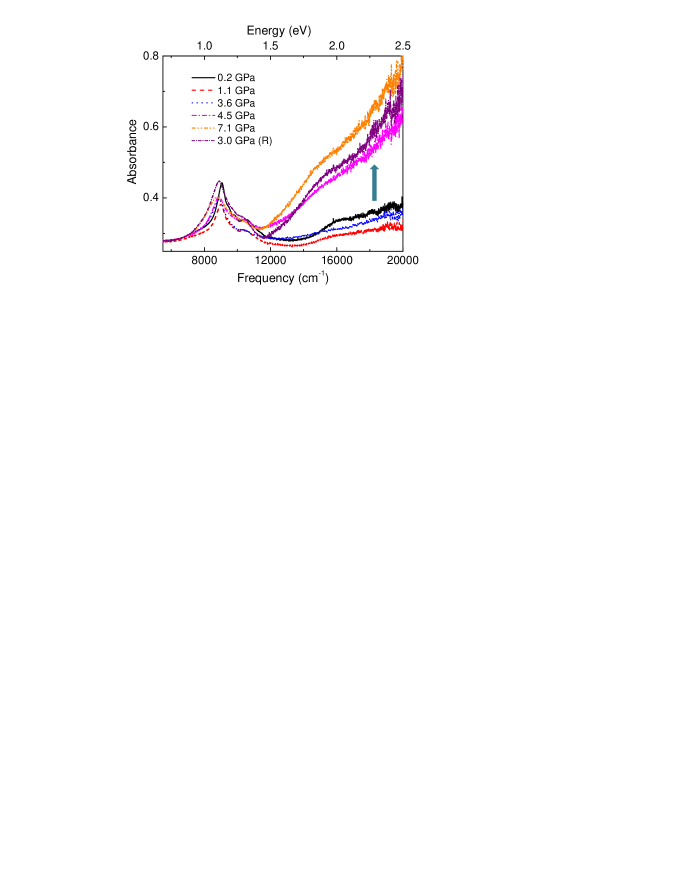
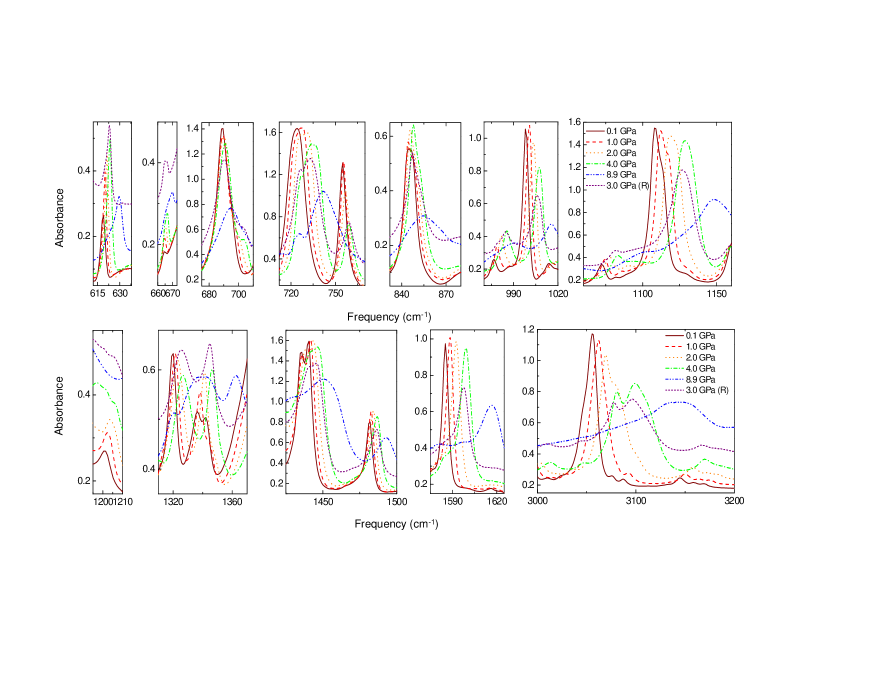
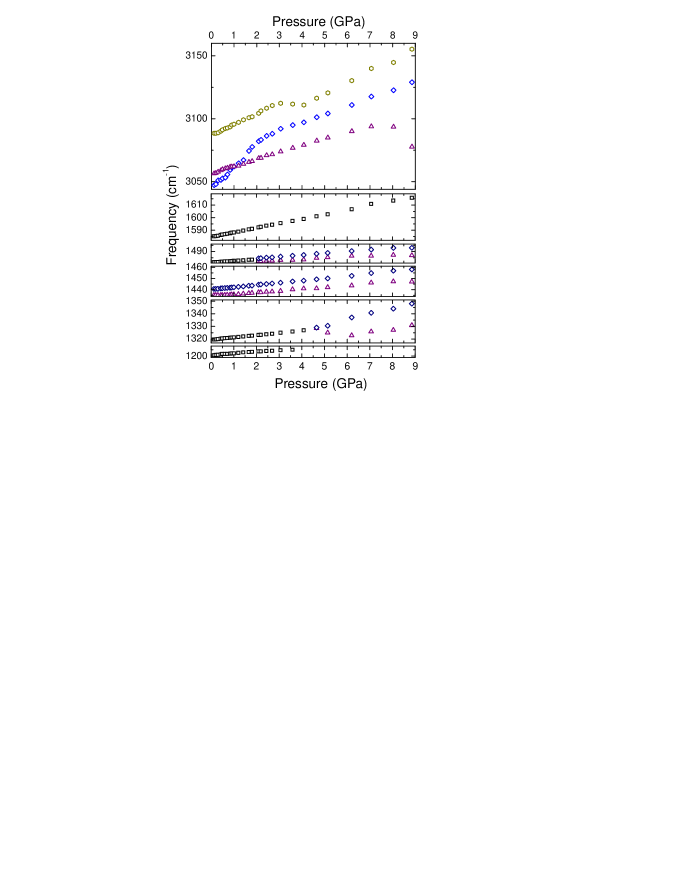
Fig. 13 shows the evolution of the absorbance spectrum with increasing pressures for various vibrational modes observed in the mid-infrared region of the spectrum. There are numerous modes in this range, and we will discuss the prominent ones in detail in this section. Their pressure dependence is included in Table 1. Fig. 14 and 15 show the pressure-dependent frequency position of the MIR vibrational modes: All the modes show a hardening behavior with increasing pressure. The vibrational mode at 619 cm-1 is a singlet at the lowest pressure and undergoes a doublet splitting at pressures above 2 GPa. In contrast, by lowering the temperature at ambient pressure no splitting of this mode occurs. This mode is attributed to the cation. The vibrational mode at 665 cm-1 is attributed to the C long07 . It is a weak mode but gains intensity and remains sharp up to high pressure, and also shows a two-fold splitting on increasing pressure above 2 GPa. There are several vibrational modes observed due to the cation between 680 and 3150 cm-1 in the MIR region. The vibrational mode around 720 cm-1 is a cation mode and is a doublet at the lowest pressure; above 2 GPa it transforms to a three-fold mode. The two-fold vibrational mode around 846 cm-1 might be attributed to the C vibration long07 . The vibrational mode at 1482 cm-1 is a singlet at low pressure and undergoes a two-fold splitting above 2 GPa. The vibration around 3050 cm-1 is an intense doublet which is followed by weak modes on the high-energy side at 3076 and 3088 cm-1. The influence of pressure on this multiplet has different pressure coefficients. The weak modes on the higher energy side cannot be observed at higher pressures. In the frequency versus pressure plot shown in Fig. 15 there appears to be a crossing over of the vibrational mode around 1 GPa. This is mainly due to different pressure coefficients of the modes; unfortunately, the origin of these modes is not clear.
The observed splitting of several vibrational modes is an indication of a change in symmetry. Several FIR and MIR vibrational modes show a splitting above 2 GPa. This can be understood as the molecule exhibits dynamic distortions at near-ambient conditions with either D5d or D3d symmetry and undergoes a transition to static state with lower symmetry (D3d or lower). The critical pressure of this transition is around 2 GPa. We speculate here that the dynamic-to-static transition induced by external pressure is analogous to the observed transition at around 150 K,long07 the driving force being the cation-anion interaction (steric crowding).
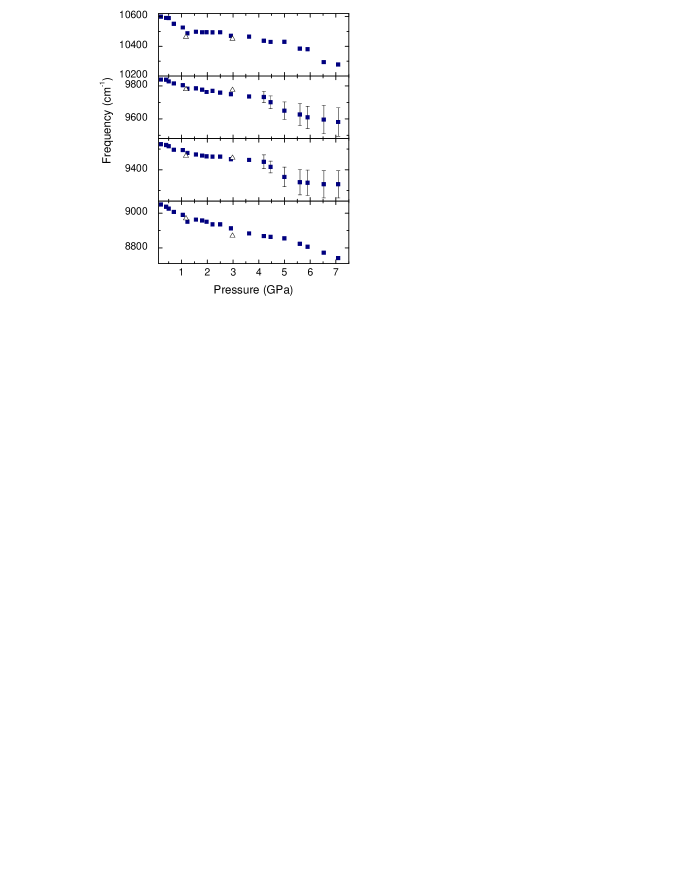
The NIR-Vis absorbance spectrum of (Ph4P)2IC60 is shown in Fig. 16 for selected pressures. The bands between 9000 cm-1 and 12000 cm-1 correspond to electronic and vibronic excitations of the C anion, as discussed in Section III.1. With increasing pressure they shift to lower energies; the shifts are reversible upon pressure release. The redshift of the transitions is clearer in Fig. 17, where the frequency positions of the bands, as extracted from Lorentz fitting, are plotted as a function of pressure. Since the feature around 9450 cm-1 and 9700 cm-1 broaden considerably at high pressure, the error bar is larger above 4 GPa compared to the lower-pressure regime. The softening of the electronic and vibronic transitions could be due to the fact that the compression of the lattice produced by the applied pressure reduces the splitting of the electronic states. The visible region of the spectrum above 12000 cm-1 abruptly increases for pressures above 4 GPa (see Fig. 6). Higher-energy data would be needed in order to clearly trace the details of this change as a function of pressure. The pressure-induced changes on this high-energy transition are irreversible above 5 GPa according to our results.
IV Summary
In summary, we have studied the pressure dependence of the vibrational and electronic/vibronic excitations in (Ph4P)2IC60 by infrared transmission measurements up to 9 GPa over a broad frequency range (200 - 20000 cm-1). The four fundamental T1u modes of C are split into a doublet already at the lowest applied pressure and harden with increasing pressure. Several cation modes and fullerene-related modes split into a doublet at around 2 GPa, the most prominent one being the G1u mode of fullerene. We interpret these mode splittings in terms of the transition from the dynamic to static Jahn-Teller effect. Four absorption bands are observed in the NIR-VIS frequency range, which correspond to excitations between t1u and t1g LUMO energy levels, split due to the Jahn-Teller distortion. The optically allowed a2ue1g transition (either in D5d or D3d symmetry) and the three energetically higher-lying vibronic transitions shift to lower energies with increasing pressure, indicating a reduction of the splitting of the LUMO electronic states under pressure application.
Acknowledgments
We gratefully acknowledge the financial support by the German Science Foundation (DFG), Hungarian Academy of Sciences under cooperation grant (DFG/183) and the Hungarian National Research Fund (OTKA) under grant No. 75813.
References
- (1) J. L. Sauvajol, A. Graja, L. Firlej, and S. Król, J. Molecular. Struct. 436, 19 (1997).
- (2) K. Pilz, A. Jobst, E. Lam, J. Lüdecke, J. Bao, W. Bietsch, and M. Schwoerer, Z. Kristallogr. 217, 78 (2002).
- (3) A. Penicaud, A. Perez-Benitez, V. R. Gleason, P. E. Munoz, and R. Escudero, J. Am. Chem. Soc. 115, 10390 (1993).
- (4) U. Bilow, M. Jansen, Z. Anorg. Allg. Chemie 621, 982 (1995).
- (5) V.C. Long, J. L. Musfeldt, K. Kamarás, A. Schilder, and W. Schütz, Phys. Rev. B 58, 14338 (1998).
- (6) V. C. Long, J. L. Musfeldt, K. Kamarás, A. Schilder, and W. Schütz, Synth. Met. 103, 2435 (1999).
- (7) V. C. Long, E. C. Schundler, G. B. Adams, J. B. Page, W. Bietsch, and I. Bauer, Phys. Rev. B 75, 125402 (2007).
- (8) B. Gotschy, M. Keil, H. Klos and I. Rystau, Solid State Commun. 92, 935 (1994).
- (9) B. Gotschy and G. Völkel, Appl. Magn. Reson. 11, 229 (1996).
- (10) G. Völkel, A. Pöppl, J. Simon, J. Hoentsch, S. Orlinskii, H. Klos, and B. Gotschy, Phys. Rev. B 52, 10188 (1995).
- (11) U. Becker, G. Denninger, V. Dyakonov, B. Gotschy, H. Klos, G. Rosler, A. Hirsch, and H. Winter, Europhys. Lett. 21, 267 (1993).
- (12) W. Bietsch, J. Bao, J. Lüdecke, S. van Smaalen, Chem. Phys. Lett. 324, 37 (2000).
- (13) P. Launois, R. Moret, N-R. De Souza, J. A. Azamar-Barrios, and A. Penicaud, Eur. Phys. J. B 15, 445 (2000).
- (14) E. A. Francis, S. Scharinger, K. Németh, K. Kamarás, and C. A. Kuntscher, Phys. Status Solidi B 247, 3047 (2010).
- (15) B. Sundqvist, Adv. Phys. 48, 1 (1999).
- (16) K. Thirunavukkuarasu, C. A. Kuntscher, Gy. Bényei, I. Jalsovszky, G. Klupp, K. Kamarás, É. Kováts, and S. Pekker, Phys. Status Solidi B 244, 3857 (2007).
- (17) K. Thirunavukkuarasu, C. A. Kuntscher, B. J. Nagy, I. Jalsovszky, G. Klupp, K. Kamarás, É. Kováts, and S. Pekker, J. Phys. Chem. C 112, 17525 (2008).
- (18) V. N. Semkin, N. G. Spitsina, S. Król, and A. Graja, Chem. Phys. Lett. 256, 616 (1996).
- (19) P. M. Allemand, G. Srdanov, A. Koch, K. Khemani, and F. Wudl, J. Am. Chem. Soc. 113, 2780 (1991).
- (20) G. Huber, K. Syassen, and W. B. Holzapfel, Phys. Rev. B 15, 5123 (1977).
- (21) H. K. Mao, J. Xu, and P. M. Bell, J. Geophys. Res. 91, 4673 (1986).
- (22) N. Koga and K. Morokuma, Chem. Phys. Lett. 196, 191, (1992).
- (23) W. Krätschmer, L. D. Lamb, K. Forstiropoulos, and D. R. Huffman, Nature 347, 354 (1990).
- (24) T. Pichler, R. Winkler, and H. Kuzmany, Phys. Rev. B 49, 15879 (1994).
- (25) M. J. Rice and H.-Y. Choi, Phys. Rev. B 45, 10173 (1992).
- (26) D. R. Lawson, D. L. Feldheim, C. A. Foss, P.K. Dorhout, C. M. Elliott, C. R. Martin, and B. Parkinson, J. Electrochem. Soc. 139, 7 (1992).
- (27) H. Kondo, T. Momose, and T. Shida, Chem. Phys. Lett 237, 111, (1995).
- (28) S. Tomita, J. U. Andersen, E. Bonderup, P. Hvelplund, B. Liu, S. B. Nielsen, U. V. Pedersen, J. Rangama, K. Hansen, and O. Echt, Phys. Rev. Lett. 94, 053002 (2005).
- (29) J. Fulara, M. Jakobi, and J. P. Maier, Chem. Phys. Lett. 211, 227 (1993).
- (30) C. C. Chancey and M. C. M. OB́rien, The Jahn-Teller Effect in C60 and Other Icosahedral Complexes (Princeton University Press, Princeton, New Jersey, 1997).
- (31) W. H. Green, S. M. Gorun, G. Fitzgerald, P. W. Fowler, A.Ceulemans, and B. C. Titeca, J. Phys. Chem. 100, 14892 (1996).
- (32) I. D. Hands, J. L. Dunn, and C. A. Bates, Phys. Rev. B 77, 115445 (2008).
- (33) G. A. Heath, J. E. McGrady, and R. L. Martin, J. Chem. Soc. Chem. Commun. 17 1272 (1992).
- (34) R. D. Bolskar, S. H. Gallagher, R. S. Armstrong, P. A. Lay, and C. A. Reed, Chem. Phys. Lett. 247, 57, (1995).
- (35) I. D. Hands, J. L. Dunn, and C. A. Bates, Phys. Rev. B 73, 235425 (2006).