The MICE Muon Beam on ISIS and the beam-line instrumentation of the Muon Ionization Cooling Experiment
Abstract
The international Muon Ionization Cooling Experiment (MICE), which is under construction at the Rutherford Appleton Laboratory (RAL), will demonstrate the principle of ionization cooling as a technique for the reduction of the phase-space volume occupied by a muon beam. Ionization cooling channels are required for the Neutrino Factory and the Muon Collider. MICE will evaluate in detail the performance of a single lattice cell of the Feasibility Study 2 cooling channel. The MICE Muon Beam has been constructed at the ISIS synchrotron at RAL, and in MICE Step I, it has been characterized using the MICE beam-instrumentation system. In this paper, the MICE Muon Beam and beam-line instrumentation are described. The muon rate is presented as a function of the beam loss generated by the MICE target dipping into the ISIS proton beam. For a 1 V signal from the ISIS beam-loss monitors downstream of our target we obtain a 30 KHz instantaneous muon rate, with a neglible pion contamination in the beam.
keywords:
Muon Ionization Cooling; Neutrino Factory; Muon Collider; MICE; Muon Beam1 Introduction
Muon storage rings have been proposed as sources of intense, high-energy neutrino beams [1, 2] and as high energy lepton-antilepton colliders [3, 4]. In each of these facilities, the volume of phase space occupied by the muon beam must be reduced (cooled) before the beam is accelerated and stored. The muon lifetime is so short that unacceptable decay losses will occur if conventional cooling techniques are employed [5]. Ionization cooling is fast, as the cooling is generated by ionization energy loss as the muon beam passes through an “absorber” material, the lost longitudinal momentum being restored in accelerating cavities. Ionization cooling has therefore been adopted in the proposed design for both the Neutrino Factory and the Muon Collider [6].
At the Neutrino Factory [2], intense beams of high energy neutrinos are produced from the decay of muons circulating in a storage ring. Long straight sections in the storage ring direct neutrino beams to one or more distant detectors. The energy spectrum and flavour composition of the beam are known precisely, as compared to those of conventional neutrino beams [7]. A number of conceptual designs for the Neutrino Factory have been proposed [8, 9, 10, 11, 12] each of which exploits an ionization-cooling channel to increase significantly the muon flux delivered to the storage ring. The baseline design for the facility being developed by the International Design Study for the Neutrino Factory (IDS-NF) collaboration delivers muon decays per year and has been shown to have a discovery reach that is significantly better than that of realistic alternatives. The cooling channel specified in the IDS-NF baseline delivers an increase of a factor 2.4 in the stored-muon flux and is essential for the design performance of the facility to be delivered.
The Muon Collider [13] offers an attractive route to multi-TeV lepton-antilepton collisions. Since the muon mass is 200 times that of the electron it is possible to deliver very high-energy beams using circular accelerators that can be designed to fit within the area of existing particle-physics laboratory sites. In addition, the large muon mass implies a reduction in the rate of beamstrahlung by a factor of over an collider of the same centre-of-mass energy. As a consequence, the annihilation-energy distribution is much narrower at a Muon Collider than at an collider of the same energy.
The annihilation cross section falls rapidly as the centre-of-mass energy in the collision increases, therefore high luminosity ( cm-2s-1) is critical to the success of the Muon Collider. To achieve the required luminosity, the muon-beam phase space must be cooled in all six phase-space dimensions: a reduction in the six-dimensional emittance by a factor being required. By contrast, the cooling requirements of the Neutrino Factory, which requires cooling of only the four-dimensional transverse phase space, are relatively modest.
Ionization cooling is accomplished by passing the muon beam through a low- material (the “absorber”) in which it loses energy through ionization. The energy loss results in a reduction in the longitudinal and the transverse components of momentum. The lost energy is restored by accelerating the beam such that the longitudinal component of momentum is increased while the transverse components remain unchanged. The net effect of these two operations is to reduce the divergence of the beam, thereby reducing the volume of transverse phase space it occupies. Beam transport through the absorber and the accelerating structures is achieved using a solenoid-focusing lattice.
The rate of change of normalised emittance due to ionization cooling in a medium of thickness may be described as [6]:
| (1) |
where is the normalised transverse (four-dimensional) emittance of the beam, is the radiation length of the medium, is the betatron function, and the energy and mass of the muons and their velocity. The first (negative) term on the right hand side of equation 1 describes a reduction of emittance per unit length, i.e. cooling. The second (positive) term describes the heating effect of multiple scattering. The two effects reach an equilibrium when the emittance of the beam is:
| (2) |
The ideal cooling channel will produce the lowest equilibrium emittance. This is obtained when is minimised and is maximised. To minimise requires strong focusing at the absorber while hydrogen offers the largest value of .
While the principle of ionization cooling is readily described using equations 1 and 2, the construction of an ionization-cooling cell requires significant engineering. In a practical ionization-cooling cell, the energy loss in the absorber must be replaced by means of RF cavities: momentum must be restored so that beam transport through subsequent cells is unaffected.
The international Muon Ionization Cooling Experiment (MICE) [14, 15] is being constructed at the Rutherford Appleton Laboratory (RAL). The experiment will consist of the full cell of an ionization-cooling lattice and the instrumentation necessary to measure the emittance of a muon beam before it enters and after it leaves the cell. In this way, the MICE collaboration will measure the cooling performance of the lattice cell in a variety of modes of operation and over a range of momentum and emittance. The results of the experiment will allow the cooling channels of the Neutrino Factory and Muon Collider to be optimised.
2 The MICE concept
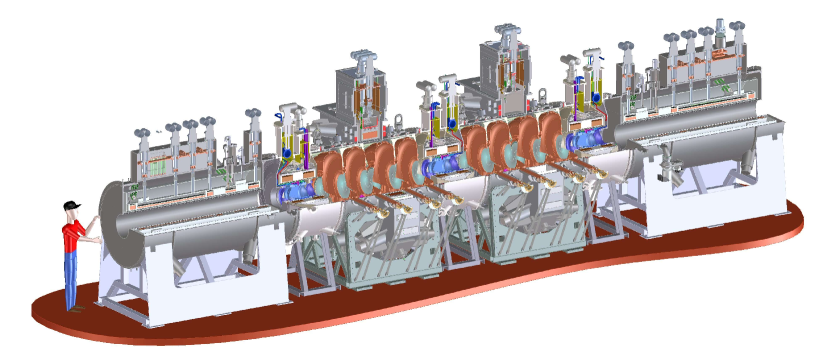
A schematic diagram of the MICE experiment is shown in figure 1. The MICE cooling channel, which is based on a single lattice cell of the cooling channel described in [8], comprises three volumes of 20 litre of liquid hydrogen and two linac modules each consisting of four 201 MHz cavities, with gradients of MV/m. Beam transport is achieved by means of a series of superconducting solenoids: the “focus coils” focus the beam into the liquid-hydrogen absorbers, while a “coupling coil” surrounds each of the linac modules.
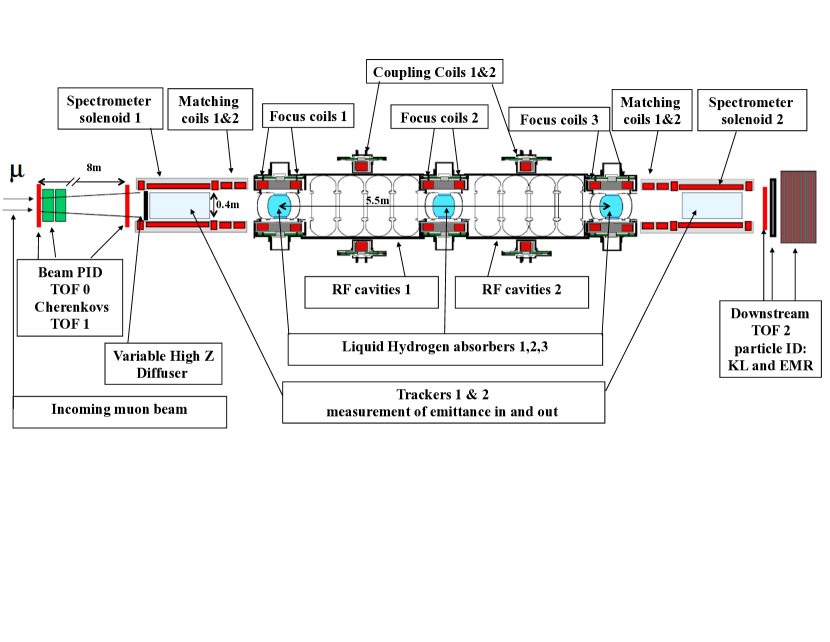
Detailed Monte Carlo simulations of the passage of muons through the cooling cell have been carried out to estimate its performance. The results indicate that a reduction in the normalised emittance of is expected for a muon beam entering the cell with a momentum of 200 MeV/c and an emittance mmrad. The instrumentation upstream and downstream of the cooling cell is required to measure this change in emittance, , with a relative precision ; i.e., measurements of upstream and downstream of the cooling cell with an absolute precision of 0.1% are required, to allow the extrapolation to a full cooling channel. Conventional emittance measurement techniques based on beam-profile monitors do not have the required precision.
While the muon-beam intensity in the ionization-cooling channel at the Neutrino Factory and the Muon Collider is in excess of /s, the phase-space density is always low enough for space-charge forces to be neglected. This fact has been exploited to devise a single-particle experiment in which each muon is measured using state-of-the-art particle detectors and the bunched muon-beam is reconstructed offline. The instrumentation upstream of the MICE cooling cell includes a particle-identification (PID) system (scintillator time-of-flight hodoscopes TOF0 and TOF1 and threshold Cherenkov counters Ckova and Ckovb) that allows a pure muon beam to be selected. Downstream of the cooling channel, a final hodoscope (TOF2) and a calorimeter system allow muon decays to be identified and rejected. The calorimeter system is composed of a lead-scintillator section (KL), similar to the KLOE [16] design but with thinner lead foils, followed by a fully active scintillator detector (the electron-muon ranger, EMR) in which the muons are brought to rest. Charged-particle tracking in MICE is provided by two solenoidal spectrometers. The MICE instrumentation must be sufficiently robust to perform efficiently in the presence of background induced by X-rays produced in the RF cavities. For a full description of the experiment see [15].
The position, momentum and energy of each muon is measured before and after the cooling cell. For each particle , , , , and are measured; is the component of momentum, is the energy and the MICE coordinate system is defined such that the axis is parallel to the nominal beam axis, the axis points vertically upward and the axis completes a right-handed coordinate system. The time, , corresponds to the moment the particle crosses a reference surface within the tracking volume. The input and output normalised emittances, and , of a beam of muons can be determined from the measurements of the phase-space coordinates of single muons in the up- and down-stream trackers. Because they are measured for the same ensemble of muons, and will be correlated with the effect of reducing the statistical error on the fractional change in emittance, , below . The only stochastic process is multiple scattering in the absorbers and it can be shown that [17]
| (3) |
where is the mean square transverse momentum of the beam at the absorbers and is the mean square transverse momentum kick due to multiple scattering. It has been demonstrated with Monte Carlo studies [18] that for beams with mm rad a sample of muons is sufficient to reduce the statistical error on to less than one percent.
The MICE Muon Beam is required to deliver beams with a pion contamination below 10% and a central momentum () in the range MeV/c. The beam line must also deliver a transverse emittance in the range mm rad. The full range of emittance is required over the full range of momentum. A tungsten or brass “diffuser” of variable thickness is placed at the entrance to the upstream spectrometer solenoid to generate the divergence necessary for the required range of emittance.
At a rate of /s a sample of muons may be accumulated in one hour, giving the possibility to record all the needed momentum/emittance beam settings in the available running time.
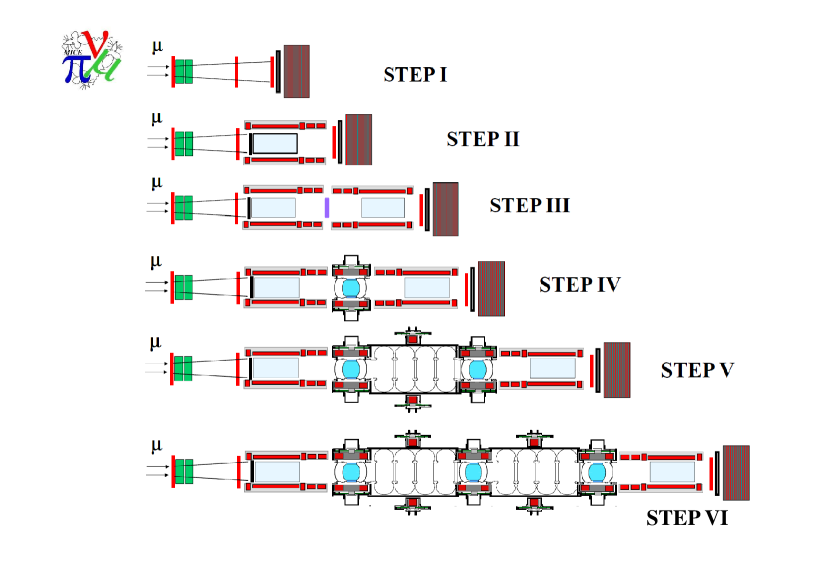
The MICE program was conceived to be carried out in six “Steps”, summarised in table 1 and figure 2. A thorough description of all MICE Steps is beyond the scope of this paper. However, each Step requires that the MICE Muon Beam meets the specifications outlined above. Step I, in which the muon beam was characterized using the time-of-flight (TOF), Cherenkov and KL detectors, was completed in August 2010. The EMR calorimeter [19], that will complete the downstream calorimetry, will follow soon.
| Step | Description |
|---|---|
| I | Beam characterisation and detector calibration. |
| II | Upstream spectrometer and diffuser. Incoming beam emittance can be changed and measured precisely. |
| III | Downstream spectrometer: study of systematics in emittance measurement in the two spectrometers. Solid absorber with measurement of energy loss and multiple scattering correlations. |
| IV | Introduction of the first liquid hydrogen absorber and focus-coil module. |
| V | First linac section and second hydrogen absorber/focus-coil module. First measurement of cooling with momentum recovery. |
| VI | Second linac module and third liquid hydrogen absorber/focus-coil module. Measurement of emittance before and after the cooling cell, in various optics configurations, with momentum recovery. |
3 MICE Muon Beam
3.1 Overview
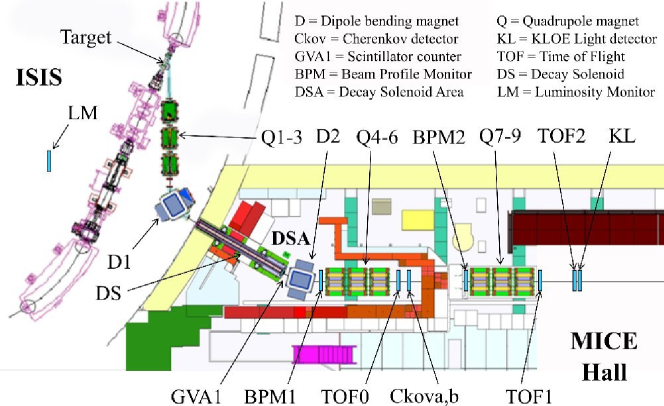
The design of the MICE Muon Beam is similar to that of the E4 beam line at the Paul Scherrer Institute (PSI) in Switzerland. The MICE Muon Beam may be divided, conceptually, into three sections (see figure 3). In the upstream section, pions produced by the ISIS proton beam striking a titanium target are captured using a quadrupole triplet (Q1–3). The pions are transported to a bending magnet (D1) which directs pions of particular momentum into the decay solenoid (DS). The decay solenoid, the second section of the beam line, causes the pions to spiral around the nominal beam axis, increasing the path length. This effect together with the solenoid focusing increases the number of muons captured between D1 and the second dipole magnet (D2). D2, the first element of the downstream section, directs muons of a particular momentum into a quadrupole channel (Q4–6 and Q7–9) that transports the muon beam to the MICE experiment.
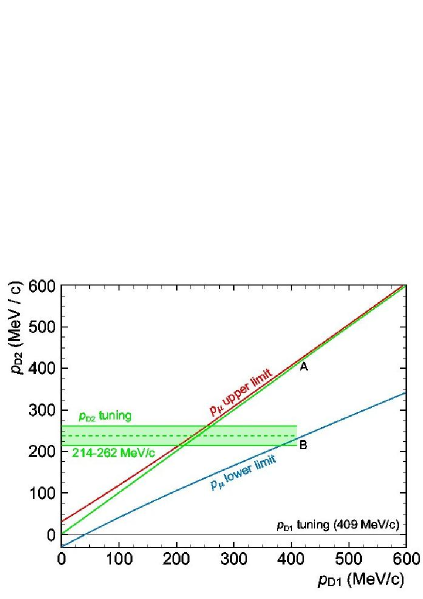
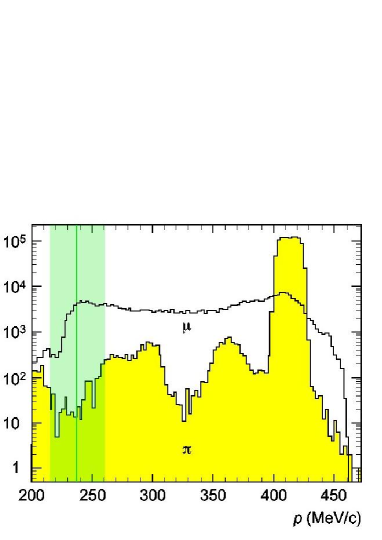
The composition and momentum spectrum of the beam delivered to MICE is determined by the interplay between the two bending magnets D1 and D2. This is illustrated in figure 4. With D1 set to select a particular pion momentum, (horizontal axis), the kinematics of pion decay result in muons with momentum in the range . The kinematic limits are indicated in figure 4. For MeV/c, . When D2 is set to select particles with momentum , backward-going muons in the pion rest frame are selected. The muon-beam purity, , is defined as , where is the number of muons in the beam and is the total number of particles. A muon beam of sufficient purity can be selected by setting . This can be seen in the right-hand panel of figure 4 where the momentum spectra of particles emerging from the decay solenoid are plotted in a simulation in which D1 was set to select a central momentum of 400 MeV/c. The figure shows that setting D2 to select a momentum bite of 10% around MeV/c delivers a muon beam with a pion contamination (defined as , where is the number of pions in the beam) less than 2%. In practice, a muon beam with a purity in excess of 95% is obtained by setting . This case is referred to as “ mode”. A momentum-selected beam containing pions, muons, protons and electrons (or positrons) can be obtained by setting . Such a setting is referred to as “calibration mode” and is used for the calibration of detectors.
|
The muon beams delivered to MICE are characterized by their normalised emittance, , and momentum, . Different beam settings are identified using the notation , where is measured in mm rad and in MeV/c. The “nominal” values of and are defined such that the nominal value of is evaluated in the upstream spectrometer solenoid and the nominal value of is evaluated at the centre of the central liquid-hydrogen absorber in the Step VI configuration. The baseline optics deliver a beam characterized by . The () space is discretised into a matrix of nine elements (see table 4). Each cell of this emittance-momentum matrix is associated with a specific downstream beam-line optics. Together the cells span the space required to serve the entire MICE programme.
3.2 Beam-line elements and instrumentation
3.2.1 The MICE target
Protons are injected into ISIS with a kinetic energy of 70 MeV and are accelerated over a period of 10 ms up to 800 MeV at a repetition rate of 50 Hz 222Upon reaching 800 Mev energy the protons are extracted to the ISIS neutron-production targets.. The MICE target has been designed to dip into the beam shortly before extraction at a rate of Hz, i.e. sampling one in 50 of the ISIS beam pulses.
The MICE target is a hollow titanium cylinder with an outer diameter of 6 mm and an inner bore of 4.6 mm. The target dips vertically into the beam, intercepting it over the last 3 ms of the acceleration cycle ( turns). Over this period, the target samples proton-beam energies in the range 617–800 MeV. The beam envelope shrinks as the beam is accelerated.
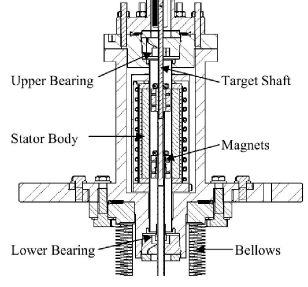
To insert the target into the shrinking beam envelope requires an acceleration of g. The target-insertion mechanism consists of a linear electromagnetic motor in which permanent magnets mounted on the target shaft are accelerated by a series of 24 coils contained within the stator. An optical position-sensing system with laser quadrature readout is used to monitor the position of the shaft and to control the drive current to the 24 coils (see left-hand panel of figure 5). A paper describing the design and operation of the MICE target is in preparation [20].
3.2.2 The MICE luminosity monitoring
There are 39 beam loss monitors (BLM) [21] placed around the inner radius of ISIS. These are argon-filled cylindrical ionization chambers, 3 m long, 16 mm in diameter and situated 2–3 m from the beam axis parallel to the beam. The BLMs detect particles produced by protons that are lost from the beam envelope and interact with accelerator components. The ionization chambers that form the BLMs produce a voltage signal proportional to the particle rate. This signal is integrated over some time interval (typically between 1 and 3 ms) to give an overall measure of beam loss (in units of V ms). The ISIS synchrotron lattice has 10 “super periods”, numbered from 0 to 9, with the MICE target situated in super period 7 (SP7). The signal from the four BLMs in SP7 is a measure of beam loss produced by the MICE target.
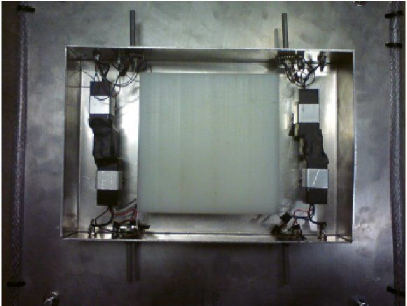
The MICE Luminosity Monitor (LM) provides a measurement of the particle rate close to the MICE target independent of the ISIS Beam Loss Monitors. The LM is located inside the ISIS synchrotron ring, 10 m from the target (see figures 3 and 8). A line drawn from the target to the LM makes an angle of 25∘ with respect to the direction of the proton beam at the target. The LM therefore samples particles at an angle similar to that at which particles are captured by Q1–3. The rate recorded by LM may therefore be used to validate the simulation of the upstream beam line and to normalise the rates measured in the beam line instrumentation to the number of protons on target (POT).
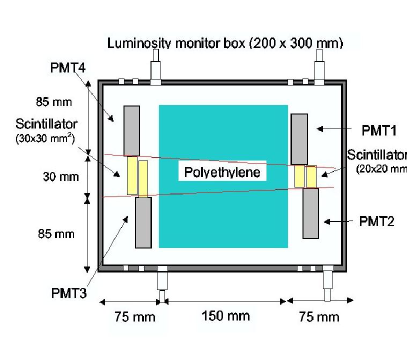
The LM consists of two pairs of small scintillators placed either side of a polyethylene block that absorbs protons with momentum below MeV/c and pions with momentum below MeV/c (see figure 6). The scintillators are read out by Hamamatsu H5783P low noise PMTs which have a rise time of 0.8 ns and a gain of [22]. Upstream of the polyethylene block, PMTs 1 and 2 are bonded to scintillator blocks of dimension mm3; downstream, PMTs 3 and 4 are attached to mm3 scintillator blocks. Neutrons may be detected if scattering inside the polyethylene block releases a proton. The PMT signals are fed to LeCroy 623B NIM octal discriminators, the three outputs of which are used to form three coincidence signals using a LeCroy 622 NIM quad coincidence unit [23]. Coincidences are recorded within the experimental trigger gate during each spill: PMTs 1 and 2 (LM12), 3 and 4 (LM34) and all four PMTs (LM1234) 333In the following, we use the term “spill” for the burst of particles resulting from one target dip, even though the primary ISIS proton beam is not extracted in producing the MICE beam..
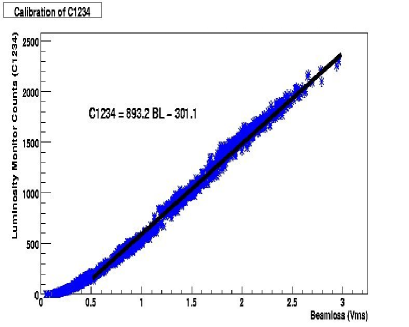
The quad LM1234 coincidence rate is plotted as a function of beam loss in figure 7. The data show an approximately linear relation between LM counts and beam loss in SP7 between 0.5 Vms and 3 Vms. Due to beam losses not caused by the MICE target, the relation below 0.5 Vms becomes not linear. Above 3 Vms saturation effects become significant. The rate recorded by the Luminosity Monitor has been used to convert integrated beam loss to protons on target (POT) [24, 25].
3.2.3 The MICE Muon Beam magnets
The quadrupole magnets that form the upstream pion-capture section of the upstream beam line are Type-IV quadrupoles recovered from the NIMROD accelerator which operated at RAL during the 1960s and 1970s [26]. Q1–3 have a circular aperture at the pole tips of 203 mm. The operating field gradients, shown in table 2, are always significantly smaller than the maximum gradient of 10 T/m. The power to each quadrupole is provided by a 200 A, 30 V power supply. An aluminium vacuum pipe passes through Q1–3 and extends into a vacuum box inside D1.
The quadrupoles that form the two downstream triplets (Q4–6 and Q7–9) are each Type QC quadrupoles from DESY [26]. The downstream quadrupoles have cross-shaped apertures, with a circular aperture of 352 mm diameter at the pole tips and a maximum gradient of 8 T/m. They are each excited by a 400 A, 70 V power supply.
The two dipoles (D1, D2) are large, 17 t, rectangular NIMROD Type-1 dipoles [26]. The nominal apertures for these magnets are rectangular with tapered pole pieces that provide a 6 inch vertical aperture and a 20 inch horizontal aperture. D1 is operated at a field close to saturation of the iron yoke. The power supply for this magnet is limited for operation at a maximum current of 440 A at 240 V. D2 is operated at a more modest field and is excited with a power supply delivering 200 A at 100 V.
| Beam line Magnet | Physical length (mm) | Aperture (mm) | Typical field (limit) |
|---|---|---|---|
| Quad Type-IV | 1143 | 203 | 1.6 (10) T/m |
| Quad Type QC | 1170 | 352 | 2 (8) T/m |
| Dipole Type-1 6′′ | 1400 | 508 (H) 152 (V) | 1.47 (1.5) T |
| PSI Decay Solenoid | 5000 | 115 | 5 (5.7) T |
The large superconducting decay solenoid (DS) was supplied by the Paul Scherrer Institute (PSI) in Switzerland, where it had been in use at the E4 beam line from 1974 to 2004 [27]. The coils which make up the DS have an open inner radius of 57.5 mm (outer radius 65 mm) and a length of 5 m. The conductor is a Cu/NbTi mixture with proportions Cu:NbTi of 3.5:1. The magnet has a stored energy of 1.5 MJ. The DS can operate at a maximum current of 1000 A, with a current density of 220 A mm-2. The nominal operating field in MICE is 5 T, corresponding to a current of 870 A.
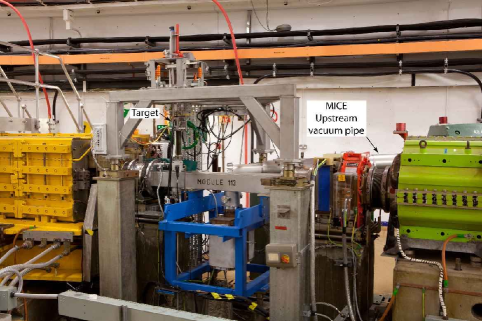
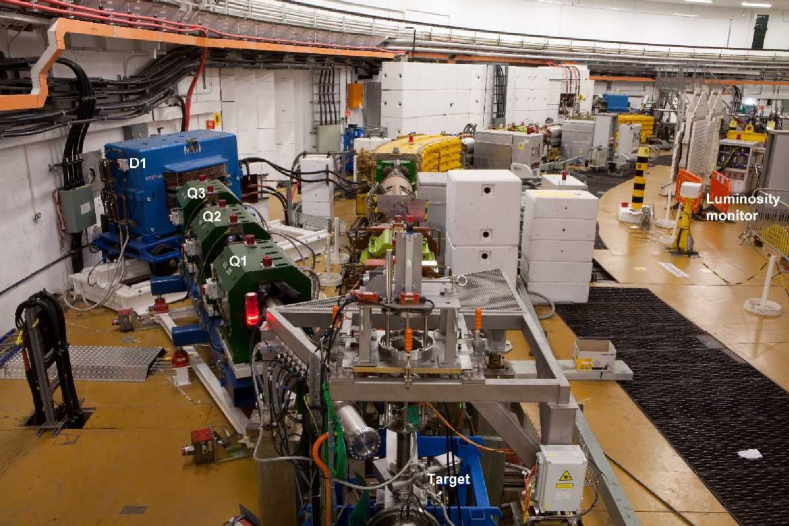
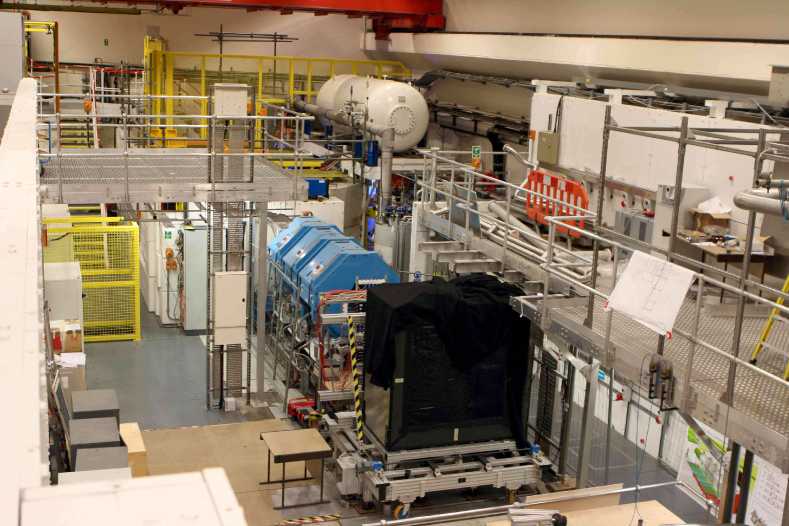
A summary of the position and dimensions of all the components along the MICE beam line is presented in table 3. A photograph of the upstream section of the beam-line is shown in figure 8 and of the downstream beam line in figure 9.
| Element | Distance from target | Max field/gradient | Aperture | -aperture | |||
|---|---|---|---|---|---|---|---|
| [along nominal | Radius | [H/V] | |||||
| beam axis] | (Pole tip) | ||||||
| (mm) | (mm) | (T) | (T/m) | (mm) | mm | mm | |
| Q1 | 3000.0 | 888 | - | 1.6 | 101.5 | ||
| Q2 | 4400.0 | 888 | - | 1.6 | 101.5 | ||
| Q3 | 5800.0 | 888 | - | 1.6 | 101.5 | ||
| D1 | 7979.1 | 1038 | 1.6 | - | 254.0 | 76.0 | |
| Decay Solenoid | 12210.7 | 5000 | 5.7 | - | 57.5 | ||
| Proton absorber | 14880 | Plastic sheets 15, 29, 49, 54 mm | |||||
| GVA1 | 15050.0 | Scintillation counter (0.02 X0) | |||||
| D2 | 15808.1 | 1038 | 0.85 | - | 254.0 | 76.0 | |
| BPM1 | 16992.0 | Scintillating fibres (0.005 X0) | |||||
| Q4 | 17661.6 | 660 | - | 2.3 | 176.0 | ||
| Q5 | 18821.6 | 660 | - | 2.3 | 176.0 | ||
| Q6 | 19981.6 | 660 | - | 2.3 | 176.0 | ||
| TOF0 | 21088.0 | Segmented scintillator (0.12 X0) | |||||
| Ckova | 21251.5 | Aerogel threshold Cherenkov (0.019 X0) | |||||
| Ckovb | 21910.9 | Aerogel threshold Cherenkov (0.031 X0) | |||||
| BPM2 | 24293.7 | Scintillating fibres (0.005 X0) | |||||
| Q7 | 25293.7 | 660 | - | 2.3 | 176.0 | ||
| Q8 | 26453.7 | 660 | - | 2.3 | 176.0 | ||
| Q9 | 27613.7 | 660 | - | 2.3 | 176.0 | ||
| TOF1 | 28793.1 | Segmented scintillator (0.12 X0) | |||||
| TOF2 | 31198.1 | Segmented scintillator (0.12 X0) | |||||
| KL | 31323.1 | Lead + scintillator (2.5 X0) | |||||
| Tag counters | 31423.1 | Scintillation bars (0.06 X0) | |||||
The MICE beam line works with both positively and negatively charged muons. The changeover is achieved by physically disconnecting and swapping over the magnet power-supply cables. A simple system for monitoring and recording the operating polarity of the two bending magnets (and by inference the other beam-line elements) has been deployed [28] consisting of a pair of Honeywell LOHET-II Hall-effect sensors that are operating past saturation when placed in the dipole bores, even at minimal field strengths, and thus return one of the two well-defined voltages corresponding to the two possible polarities of each magnet.
3.2.4 The proton absorber
With the beam line set to transport positive particles, a large flux of protons is observed to exit the decay solenoid. The range of proton momenta selected by D1 is such that a large fraction of the protons reaching D2 will be accepted by Q4–6. As a result, unless action is taken to remove protons from the beam as it enters D2, an unacceptably large flux of protons would be transported to TOF0. In the momentum range of interest, the energy loss per unit length of material traversed is larger for protons than for pions. Borated-polyethylene sheets placed in the beam as it emerges from the decay solenoid are used to remove the protons. The boron loading of the polyethylene serves to increase the absorption rate of neutrons. The sheets have thicknesses of 15 mm, 29 mm, 49 mm and 54 mm and are raised and lowered into the beam using a cable-pull mechanism. The absorbers can be operated together or independently. When all four absorbers are placed in the beam, the 147 mm of material is enough to stop protons with momentum up to MeV/c.
The choice of absorber thickness depends on the required muon-beam momentum. In a beam line set to deliver a nominal muon momentum of 140 MeV/c, D1 is set to select 360 MeV/c particles. In this case, a proton-absorber thickness of 44 mm is required to reduce the proton contamination in the muon beam delivered to MICE to less than 1%. The beam-line tune that delivers the nominal muon momentum of 240 MeV/c requires that D1 be set to select particles with a momentum of 507 MeV/c, and the full 147 mm proton-absorber thickness is then required to reduce the proton contamination to the few-% level. Pure positive muon beams of intermediate momentum are delivered using appropriate combinations of the four sheets.
3.2.5 Diffuser
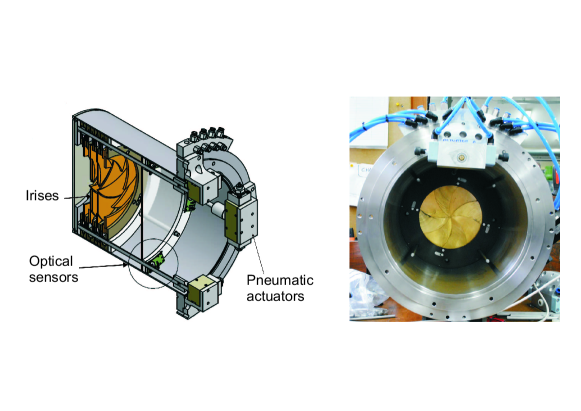
The final element of the downstream section of the beam line is the diffuser. By introduction of material with a large radiation length into the beam, multiple Coulomb scattering increases the divergence of the beam, enlarging the emittance and providing an approximately matched beam in the upstream spectrometer solenoid. Since the diffuser must operate in the field of the 4 T spectrometer, electric motors and other magnetic components cannot be used. The diffuser design consists of a stainless steel drum, which is inserted into the upstream section of the first spectrometer solenoid [29]. The drum contains four irises, two of brass (2.97 mm, 0.2 X0, and 5.94 mm, 0.4 X0 thick) and two of tungsten (2.80 mm, 0.8 X0, and 5.60 mm, 1.6 X0). By selecting different combinations of irises, one can achieve a total of 3 X0 in steps of 0.2 X0. Each iris consists of two planes of four segments of material, supported by a Tufnol [30] ring of radius 100 mm (see figure 10) and is operated by a non-magnetic, air-driven actuator. The position of each iris is monitored by a set of optical sensors. When closed, the iris inserts solid petals into the beam; when it is open, the petals are stowed away within the Tufnol ring.
3.2.6 Beam-line diagnostics
The downstream beam line is instrumented with a scintillation counter (GVA1), placed just after the proton absorber, upstream of D2. GVA1 consists of a single slab of scintillator with cm2 active area and 1 cm thickness, read out by a 2 inch EMI photomultiplier. Two Beam Profile Monitors mounted on the upstream faces of Q4 (BPM1) and Q7 (BPM2) were used to measure particle rate and beam position. The BPMs each comprise two planes of Kuraray 1 mm scintillating fibres. BPM1 has an area of cm2, while BPM2 has an area of cm2. The layers of optical fibres are supported by a sheet of Rohacell [31] foam 2.55 mm thick. An aluminium box encases the BPMs, except in the acceptance region of the fibres where four layers of Tedlar [32] keep the BPM light-tight. The light from the fibres is read out by two 64-channel multi-anode Burle [33] 85011-501 photomultiplier tubes (one per plane). Further details on both GVA1 and the BPMs are found in table 3.
3.3 Optimisation of the beam line
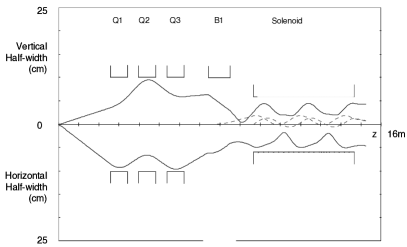
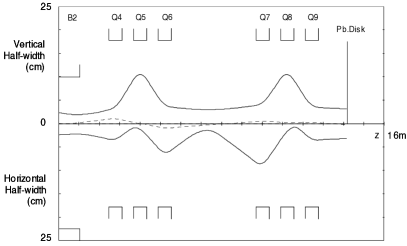
The upstream and downstream sections of the beam line are loosely coupled, allowing each section to be optimised independently. In the upstream section, where pions travel through an evacuated beam pipe, the matrix-evolution code TRANSPORT [34, 35] was therefore used to perform the optical design. In the decay solenoid, pion decay must be simulated and in the downstream beam line, where there is no beam pipe, particle interactions in air and in the detectors must be taken into account. Therefore, the optics of the decay solenoid and the downstream beam line were developed using Decay-TURTLE [35, 36]. The result of these simulations are illustrated in figure 11 [37]. The left-hand panel shows the 1 beam envelope obtained using TRANSPORT for a 454 MeV/c pion beam generated at the target. The upstream quadrupoles (Q1–3) are configured in a focusing-defocusing-focusing (FDF) configuration in the horizontal plane (DFD in the vertical plane). The particle rate is limited by the aperture of Q2 in the vertical plane and by the apertures of Q1 and Q3 in the horizontal plane. The right-hand panel of figure 11 shows the 1 envelope obtained using TURTLE to track a sample of muons ( MeV/c at D2) towards the diffuser. This muon beam was optimised to deliver muons that would have a nominal momentum of 200 MeV/c and a nominal emittance of 6 mm rad. The optical designs were then further refined using two GEANT4-based [38, 39] simulation codes: G4beamline [40, 41] and G4MICE [42, 43].
 |
 |
Pion transmission in the upstream beam line was maximized by increasing the Q1-3 excitation of with respect to that obtained from a TRANSPORT simulation.
3.3.1 Downstream optimisation
The beam optics are tuned for the experiment set up in the Step VI configuration. The downstream beam line is designed to provide an optically matched beam of desired nominal emittance and nominal momentum . The parameters available for tuning are:
-
1.
The thickness of the diffuser, which is used to tune the beam divergence in the upstream spectrometer solenoid;
-
2.
The quadrupole currents, which are used to tune the beam size and divergence, i.e., the incoming Twiss parameters ( and ) at the upstream face of the diffuser;
-
3.
The nominal momentum, which can be adjusted with the excitation of D2.
Ideally, the conditions to be fulfilled simultaneously are:
-
1.
The beam is matched in the upstream spectrometer solenoid, downstream of the diffuser. The matching conditions are: and ;
-
2.
The beam size at the entrance of the diffuser (essentially the same as the beam size at the exit of the diffuser) is such that the rms width of the beam in and satisfies , with ;
-
3.
The beam angular divergence at the upstream surface of the diffuser ( and ), increased by multiple Coulomb scattering in the diffuser (), is equal to the desired angular divergence in the spectrometer solenoid, i.e.: ;
-
4.
The central momentum selected by D2 matches the nominal momentum , once corrected for the calculated energy loss in all material encountered by the beam as it travels from D2 to the central absorber.
The horizontal beam dispersion is neglected in the calculations. It is not possible to fulfil all conditions simultaneously because the emittance of the beam coming out of D2, and transported in the quadrupole channel, is different in the horizontal and vertical planes. Nevertheless, an average match can be obtained by using the 4D covariance matrix, the resulting 4D emittance and the Twiss parameters of the beam at the upstream face of the diffuser, and transporting the beam through the diffuser. That the beam is only approximately matched results in a somewhat elliptical beam in the spectrometer solenoid; however this affects the cooling performance only marginally.
Beam settings for various combinations of (,) are calculated for a matrix of values mm rad and MeV/c. The calculation procedure [44] starts by fixing the emittance, the Twiss parameters and inside the spectrometer solenoid at the downstream face of the diffuser. The Twiss parameters and the momentum are back-extrapolated through the diffuser. The diffuser thickness, , and the currents in quadrupoles Q4–6 and Q7–9 are varied to match the input beam, using G4beamline to simulate the MICE downstream beam line. The procedure is first applied to the reference point (6, 200). This beam line is scaled with momentum to provide a first approximation, M0, of each of the other points in the emittance-momentum matrix. Then, each point is re-optimised to produce the final set of optimised beam lines, M1. The values of the Twiss parameters, diffuser thickness and momentum at the upstream face of the diffuser for the nine points of the matrix are given in table 4.
| (MeV/c) | ||||
| 140 | 200 | 240 | ||
| ( mm rad) | 3 | |||
| =151 MeV/c | =207 MeV/c | =245 MeV/c | ||
| =0.2 | =0.1 | =0.1 | ||
| =56 cm | =36 cm | =42 cm | ||
| 6 | ||||
| =156 MeV/c | =215 MeV/c | =256 MeV/c | ||
| =0.3 | =0.2 | =0.2 | ||
| =113 cm | =78 cm | =80 cm | ||
| 10 | ||||
| =164 MeV/c | =229 MeV/c | =267 MeV/c | ||
| =0.6 | =0.4 | =0.3 | ||
| =198 cm | =131 cm | =129 cm | ||
4 The particle identification system in MICE Step I
With the exception of the beam-line diagnostics and the luminosity monitor described in sections 3.2.6 and 3.2.2, the detectors installed along the beam line form part of the particle identification (PID) system of the MICE experiment. The PID system upstream of the first spectrometer solenoid is composed of two time-of-flight (TOF) stations (TOF0 and TOF1) [46] and two threshold Cherenkov counters (Ckova and Ckovb) [47]. Together the two Cherenkov counters will provide separation up to 365 MeV/c. TOF0, Ckova and Ckovb are inside the Decay Solenoid Area (DSA). 444The DSA is a closed area within the MICE Hall, just outside the ISIS vault area, that contains the DS and the first particle identification detectors.
The TOF system is required to reject pions in the incoming muon beam with an efficiency in excess of 99%. In addition, the precision of the TOF time measurement must be sufficient to allow the phase at which the muon enters the RF cavities to be determined to 5∘. To satisfy these requirements, the resolution of each TOF station must be ps. The two Cherenkov detectors have been designed to guarantee muon-identification purities better than % in the momentum range 210 MeV/c to 365 MeV/c [48]. At lower momenta, separation is obtained using the TOF measurement, both Cherenkov detectors being blind to both particle types.
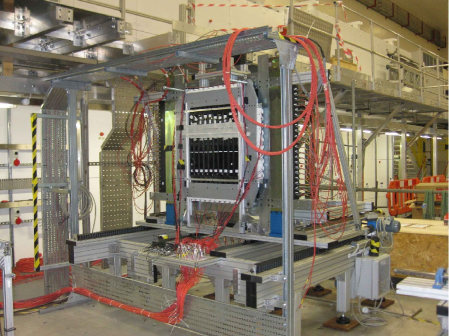
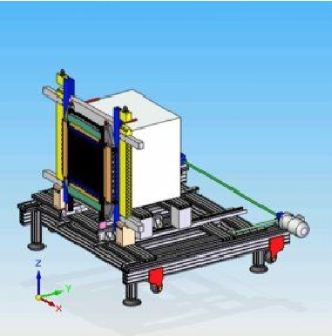
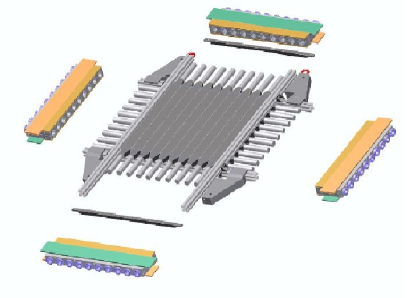
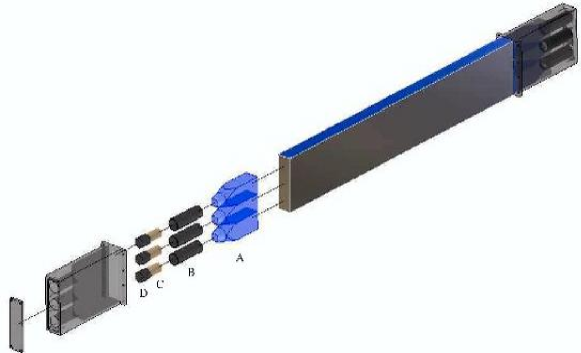
The identification of particles downstream of the second spectrometer solenoid is provided by a third TOF station (TOF2) [49] and an electromagnetic calorimeter (EMC) by which muons may be distinguished from electrons (or positrons) produced in muon decays downstream of TOF1. The electromagnetic calorimeter consists of two parts: “KLOE Light” (KL), a lead-scintillator device based on the KLOE calorimeter design [16]; and the “Electron-Muon Ranger” (EMR), a fully active, scintillator calorimeter [19]). The left-hand panel of figure 12 shows the positions of TOF2 and KL in the MICE muon beam line during Step I data-taking. The right-hand panel shows a CAD drawing of the downstream PID detectors (TOF2, KL, EMR) on their platform. The Ckov, TOF0, TOF1, TOF2 and KL detectors were installed in stages in the MICE Hall. The EMR was not available for Step I data-taking.
4.1 The Cherenkov counters
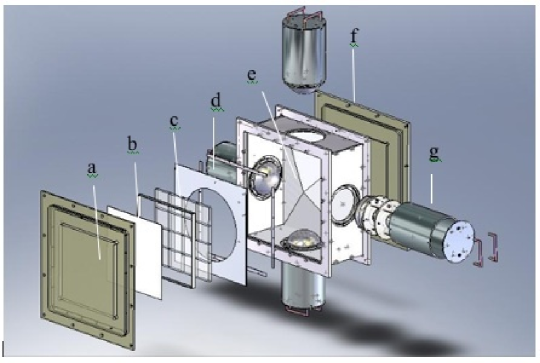
Two aerogel Cherenkov counters are employed [47]. The muon threshold in the upstream counter, Ckova, is set at MeV/c while the muon threshold for Ckovb is set at MeV/c. Pions thresholds are MeV/c and MeV/c for Ckova and Ckovb respectively. The densities of the aerogels are g cm-3 and g cm-3, with indices of refraction and . In figure 13 an exploded view of one counter is shown. The aerogel tiles are two layers thick (2.3 cm in total) and cover an area of cm2. Four 8 inch EMI 9356KB PMTs collect the Cherenkov light in each counter. Due to the high particle rate, the digitisation of the pulse profile is performed using a very high frequency sampling digitiser, CAEN V1731 [50] (1 GS/s maximum sampling rate). The sampling digitiser is connected directly to the PMTs through a coaxial cable.
For the 140 MeV/c beams, both pions and muons are below threshold for both of the Cherenkov counters. For 200 MeV/c beams, pions are below threshold for both Ckova and Ckovb, while muons are above threshold only for Ckovb. For 240 MeV/c beams, pions are above threshold for Ckovb while muons are above threshold for both Ckova and Ckovb. Algorithms are being written to use the information from both counters to provide likelihoods. The likelihood information will be combined with the TOF measurement. Only the TOF system was used for PID in the Step I data analysis presented in the present paper.
4.2 The TOF detectors
All TOF stations share a common design based on 1 inch thick slabs of fast scintillator material. Bicron BC-420 scintillator [51] was used for TOF0 and BC-404 was used for TOF1 and TOF2. The slabs in each station form two planes with x and y orientations to increase measurement redundancy. Each slab is read out at each end by a Hamamatsu R4998 fast photomultiplier (rise time ns). The active areas of TOF0 ,TOF1 and TOF2 are cm2, cm2 and cm2, respectively. The strip width is 4 cm for TOF0 and 6 cm for the other two stations. All downstream PID detectors and the TOF1 station will be shielded against stray magnetic fields of up to 1300 G (with a G longitudinal component) due to the presence of the spectrometer solenoids. TOF1 will be shielded by a double-sided iron cage which fully contains the detector. The iron cage has a hole for the beam. The TOF2 and KL PMTs are shielded by soft iron boxes [52], as shown in Figure 14. In MICE Step I, only the local PMT shields for TOF2 and KL were installed.
The TOF stations must sustain a high instantaneous particle rate (up to 1.5 MHz for TOF0). The rate capabilities of the R4998 PMT were tested in the laboratory with a dedicated setup based on a fast laser [46]. The PMT rate capability was increased through the use of an active divider base. These signals, after a splitter, are sent to a leading-edge LeCroy 4415 discriminator followed by a CAEN V1290 TDC for time measurement. The signal is also sent, after an RC shaper, to a sampling digitiser CAEN V1724 FADC (100 MS/s maximum sampling rate) in order to measure the pulse height for time-walk correction.
The passive splitter is designed to match the impedance of the 50 coaxial cable, coming from the PMTs, with the 120 discriminator and shaper inputs. The shaping circuit is used to extend the duration of the short PMT pulse, so that it can be finely sampled by the digitiser. Software processing of the digitised pulse is needed for the charge measurement and time-walk correction.
The signal arrival time, , at the photo-cathode of the left/right PMT of a scintillator slab of a TOF detector plane is given by:
| (4) |
where is the particle arrival time, its distance from the counter centre, L the scintillator length, the effective velocity of light in the scintillator slab and includes all time delays (in cables, PMT transit time, etc.). The transverse impact position, , of a particle on a TOF station may be reconstructed from the difference between the time measurements from the two PMTs at the ends of a counter as:
| (5) |
Transformation to the MICE coordinate system is straightforward: for vertical planes and for horizontal planes . The measured weighted average for is cm/ns giving a spatial resolution cm, with the time resolution for the TOF station in question.
The calculation of the delays (the “time calibration”) is performed using Step I data as described in detail in [46] and [53].
The use of leading-edge discriminators in the time-measurement electronics causes the threshold-crossing time to depend on the quantity of charge collected, an effect referred to as “time walk”. The difference between the time measured by each TDC and a reference time was determined as a function of the maximum of the FADC signal and used to correct for time-walk. Pre-equalisation of the amplitude response of the scintillation counters in each TOF plane was performed so that the time-walk corrections for the two PMTs on a particular scintillator counter were similar. The pre-equalisation was performed using a YAP pulser unit from SCIONIX [54] yielding counts/s from a YAP:CE scintillation crystal spot-activated with 241Am. Pulse-height spectra were recorded in the laboratory and used to derive appropriate high-voltage settings for the PMTs.
The performance of the TOF stations was determined by measuring the difference between the time recorded by the horizontal () and vertical () planes, , of each station. If it is assumed that the resolution of each plane is the same, the width of the distribution of can be used to determine the time resolution of a single plane, . Figure 15 shows the distribution for each TOF station. They all have remarkably good Gaussian shapes. The widths of the distributions are ps, corresponding to TOF detector resolutions 50 ps.
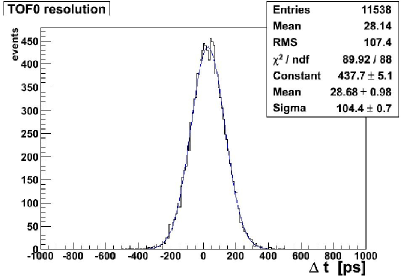
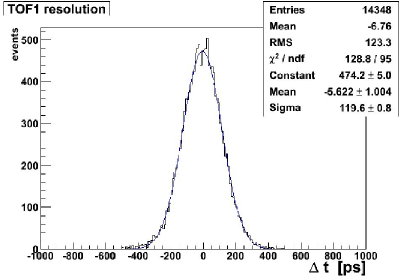
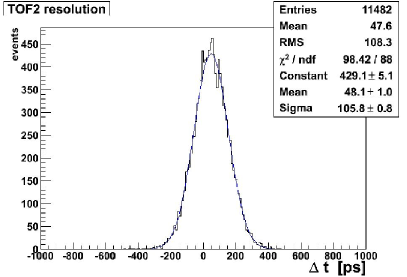
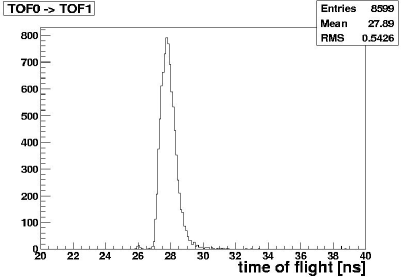
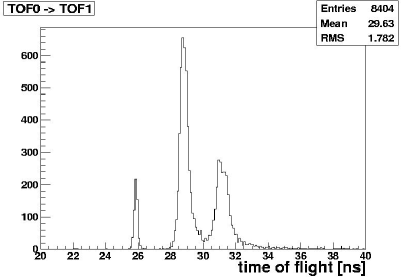
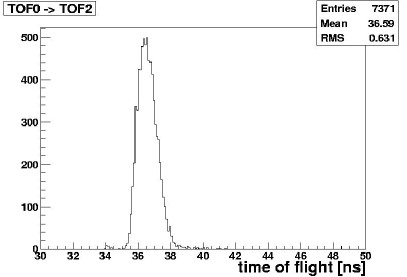
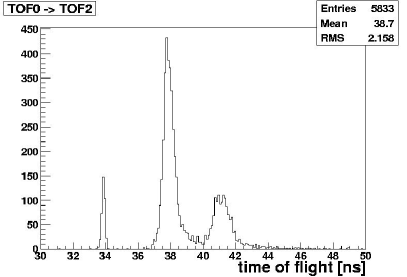
Figure 16 shows distributions of the time-of-flight between TOF0 and TOF1. The left panel represents data taken with a beam. It has a small contamination of electrons and pions. Similar beams will be used to demonstrate ionization cooling. The right panel shows data taken with a calibration beam. In this beam configuration electrons, muons and pions fall into three well-defined peaks. Similar plots for the time-of-flight between TOF0 and TOF2 are shown in figure 17.
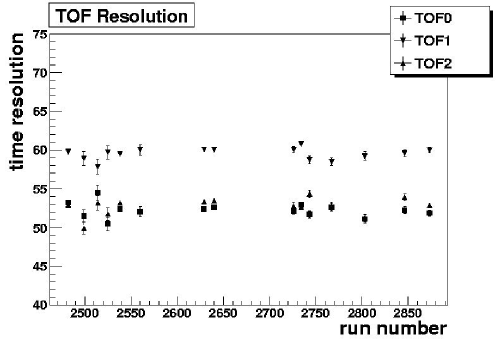
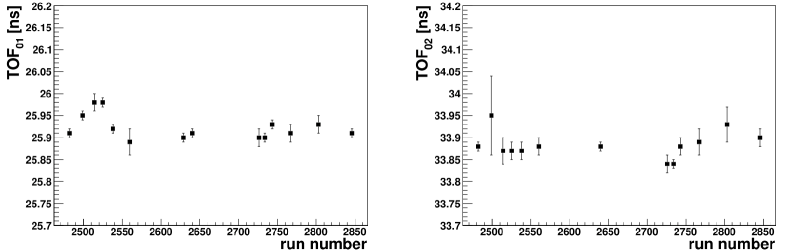
The reference muon beam is a standard setup of the beam-line magnets that has been used to monitor the stability of the data-acquisition system and the beam line. Each data-taking shift begins with a run that reproduces this reference setup. The reference muon beam runs can also be used to validate the consistency of the calibration procedure over the running period. Figure 18 shows the variation of the TOF detector resolutions, as computed from the distribution, for each reference run. The average time resolutions of TOF0, TOF1 and TOF2 are ps, ps and ps respectively [55]. The slightly worse resolution of TOF1 arises from some of the PMTs used on TOF1 being of slightly poorer quality than the other tubes used in the TOF system. 555 This feature was corrected later by refurbishing all PMTs of TOF1, obtaining a TOF1 detector resolution comparable to those of TOF0 and TOF2 [56]. The resolution of the TOF0 station (4 cm wide slabs) and that of the TOF2 station (6 cm wide slabs) are similar, showing that light path-length fluctuations are negligible. The stability of the TOF measurement for both upstream (TOF1–TOF0) and downstream PID (TOF2–TOF0) is of the order of ps (see figure 19 for details). This matches well the required resolution for PID ( ps).
4.3 KL detector
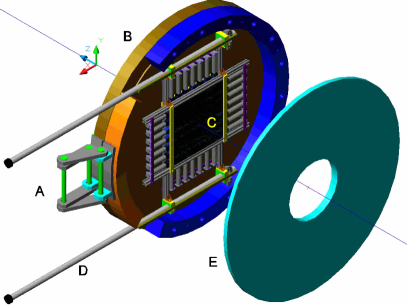
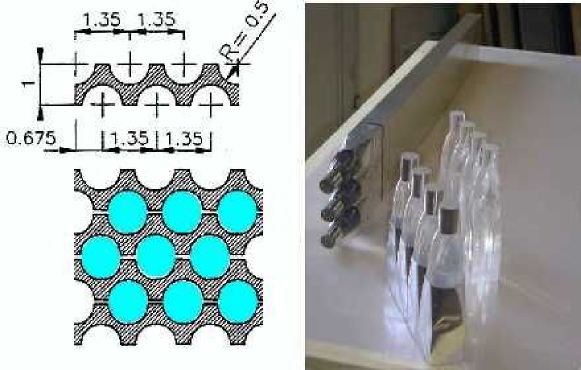
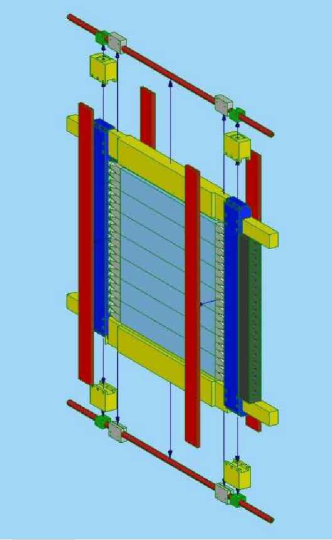
KL is a KLOE-type sampling calorimeter [16], composed of extruded Pb foils in which scintillating fibres are placed in a volume ratio (see figure 20). Since the particle energy is lower in MICE than in KLOE, the ratio of lead to fibre has been reduced from that adopted in [16] (), hence the name “KLOE Light”. The fibres chosen are Bicron BCF-12 with 1 mm diameter, scintillating in the blue. The distance between two neighbouring fibres in the same layer is 1.35 mm. The distance between two layers is 0.98 mm, one layer being shifted by half the fibre pitch with respect to the next. The overall detector dimensions, including magnetic shielding and housing of photomultiplier tubes and voltage dividers, is approximately cm3. In figures 21 and 22 a schematic view of one exploded KL module and the global layout of the KL assembly are shown. The active volume of cm3 is divided vertically into seven modules, which are supported by an iron frame. The iron frame shields the PMTs from magnetic fields. KL has a thickness of 2.5 and . From tests performed at the test beam facility BTF [57] of INFN LNF, a time resolution of ps/ and an electron-energy resolution, fully dominated by sampling fluctuations, of are obtained for electron energies between 75 MeV and 350 MeV.
KL has 21 cells and 42 readout channels (one at each end of each cell). The light is collected by Hamamatsu R1355 PMTs with E2624-11 voltage dividers, providing differential output pulses on twisted pair cables with 120 impedance at 50 MHz. The signal from the PMTs is sent to a shaper module, which shapes and stretches the signal in time in order to match the sampling rate of the flash ADCs. The flash ADC modules are the same 14 bit CAEN V1724 used for the TOF stations.
In MICE StepI setup, KL is followed by three, 1 inch thick, cm2 scintillator bars, placed vertically side by side behind the centre of the detector, to tag any particles that pass through KL. These “Tag counters” are used to measure the number of particles that pass through KL. They will be removed when the EMR calorimeter is installed.
The TOF system was used to study the response of KL to different particle types. From the distance between the TOF1 and TOF2 stations and the measured time-of-flight, the average momentum between TOF1 and TOF2 of the impinging particle was determined. For particles with momentum larger than 300 MeV/c, TOF2–TOF1 time-of-flight has insufficient resolution to determine the particle type, hence the TOF1–TOF0 time-of-flight is used. To estimate the momentum at the front of KL, the energy lost in the material of TOF2 is taken into account.
The procedure described above may be used for muons and pions. Since electrons and positrons are relativistic, it is not possible to use the time-of-flight method. The momentum of electrons and positrons is estimated using a model that takes into account all materials traversed by the electrons and the magnetic fields traversed.
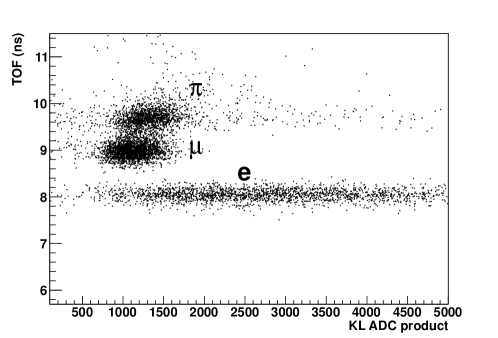
The data used to study the response of KL cover the entire range of momentum of interest in MICE. The ADC product is defined as the product of the digitised signals from the left and right sides of one slab divided by their sum:
| (6) |
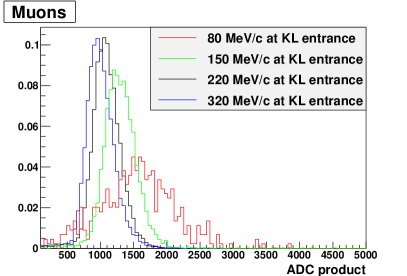
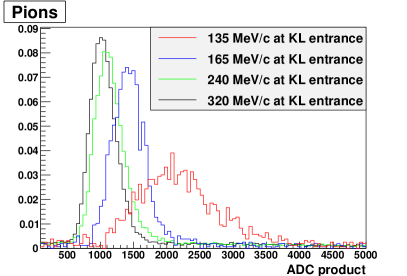
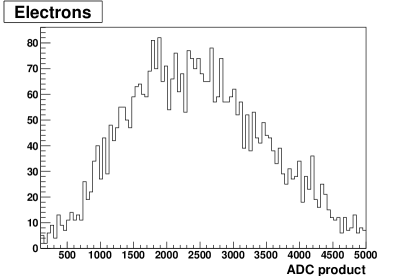
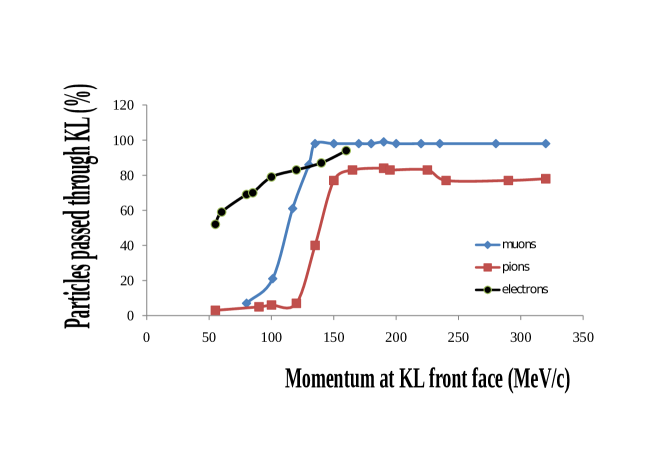
where the factor of 2 is present for normalisation. The product of the two sides compensates for the effect of light attenuation. In the upper left panel of figure 23, the KL response to muons at various momenta is shown. The deposited energy reaches its minimum ( MeV) at a momentum of 300 MeV/c (ionization minimum in lead). The upper-right panel shows the KL response to pions. In the plots, the abscissa represents the sum of the ADC product from all slabs in KL above a given threshold. The bottom panel of figure 23 shows the typical response of KL to electrons. The fraction of 80 MeV/c electrons which pass through KL is .
The fractions of electrons, muons and pions passing through KL (the “KL transparency”) are shown in figure 24. KL must act as a pre-sampler for the EMR, introducing a minimal perturbation to incoming muons and pions. The KL ADC product, plotted as a function of the time-of-flight for different particle types, is shown in figure 25. A clear separation between electrons and muons/pions is visible.
Preliminary studies of KL response in different TOF time windows show a contamination in the muon beam of the order of , after a suitable cut on the KL ADC product. These results will be the subject of a forthcoming paper.
A raw time estimate may be made, using a simple linear interpolation of the rising edge of the sampling FADC signal. This provides some redundancy in the global time measurement. Preliminary laboratory measurements have shown that a ps preliminary resolution may be obtained by selecting cosmic muons impinging at the centre of a KL cell.
A study of the stability of KL during data-taking showed that there were no dead or noisy channels. The pedestals are stable with an rms of ADC counts, corresponding to of a MIP energy deposition. The KL response to muons and pions is stable in time (over a several-month period) to within .
5 The MICE Step I Trigger, Data Acquisition and Online/Offline Software
5.1 Trigger and Data acquisition
The Detector Data Acquisition (DDAQ) system of the MICE experiment must be able to acquire data at a rate of up to 600 muons per spill. To fulfil this requirement, the Front-End Electronics (FEE) must digitise the analogue signal in less than 500 ns and store the digitised data in buffer memory. The time before the arrival of the next spill (1 s) is used to read out the buffers and store the data. Data are transferred off-line to the remote mass storage unit for subsequent analysis using Grid computing technology [58].
The acquisition of the data coming from the detectors is based on VME FEE interfaced to Linux PC processors via CAEN VME-PCI V2718 interfaces [50]. These modules are connected via optical links to PCI cards embedded in the acquisition PCs and may sustain transfer rates up to 70 Mbytes/s.
The software framework performing the management of all the independent readout processes and the event building, as well as the user interface, has been developed from the DATE package provided by the ALICE experiment at CERN [59]. The event-builder machines receive sub-events from the various VME crates through the local network, put them together in memory and store them locally in a 3 TB, RAID6, disk buffer. These data are subsequently transferred to a second local machine, from which they can be transferred asynchronously to the RAL Tier 1 centre for archival. As this transfer is carried out using Grid protocols, the data files are also immediately registered in a global file catalogue and replicated to other remote sites for off-line analysis.
The Detector DAQ is strongly dependent on the Trigger System, which is divided into two parts. The readout can only be performed at the end of the spill, due to the time structure of the MICE beam. Digital information related to the passage of the particles through the MICE cooling channel during the spill must therefore be buffered in the FEE. The first part of the Trigger System is responsible for the generation of the “Particle Trigger” signal. This signal triggers the digitisation of the analog signals received from the detectors. A coincidence of the PMTs connected to the same scintillation counter in one of the TOF stations generates the Particle Trigger.
Logic units used to generate the Particle Trigger signals are LeCroy 4516 (CAMAC) logic modules [23]. These use the output signal of the LeCroy 4415 discriminators, perform the needed logical AND operation between the two PMTs at the ends of the same counter and issue a logical OR output per group of 8 slabs. NIM logic is then used to produce a global OR signal for all the slabs of a TOF station. The resulting signal is distributed to all the front-end boards involved in the experiment. For the moment only TOF0 or TOF1 detectors may be used as a source of the Particle Trigger signal.
The second part of the Trigger System generates the so called DAQ Trigger. This signal is generated after the extraction of the ISIS proton beam and causes the readout and storage of the digital data corresponding to all the particle triggers received during a spill. The DAQ Trigger is generated from the same signal as that sent to the target system to trigger the spill.
5.2 The control system and online monitoring of MICE
The EPICS (Experimental Physics and Industrial Control System) platform was chosen for the MICE controls and monitoring system because of its reliability, existing drivers for a wide variety of devices, flexibility and world-wide support network [60]. The EPICS backbone is a local area network to which hardware components are interfaced via EPICS input/output controllers, while the user has access through EPICS channel access.
All the equipment required for Step I of MICE, including the MICE Muon Beam, the TOF and Ckov detectors as well as the systems used for environmental monitoring of the MICE Hall, was included in the controls and monitoring system. The target, beam line, decay solenoid and the proton absorber and beam stop (which are manually operated) are monitored.
The high-voltage system for the PID detectors is based on CAEN SY127 and CAEN SY527 systems interfaced, via CAENET, with CAEN PCI A1303 cards [50]. The control system is used to set-up and monitor the high voltage and includes the functionality to turn the detectors on and off and set ramp rates, operating voltages and current limits. The environmental monitoring system includes the measurement of the temperatures for the TOF detectors and the temperatures and internal humidity of the two Ckov detectors.
The MICE Hall is monitored using temperature and humidity probes, a neutron monitor and water-leak detectors. Selected parameters are used by the EPICS Alarm Handlers which compare read values to preset limits. The EPICS Archiver is used to archive selected parameter values, to be used later as input to correction algorithms being developed for the offline analysis.
A MICE Configuration Database (ConfigDB) has been developed and will be used to store the parameters that determine the operation of the experiment as well as alarm limits for the various components [61, 24]. The TOF and Ckov systems read the parameter set-values and limits from the ConfigDB during initialisation. Alarms occur when parameter values drift beyond these limits.
In addition to the Control and Monitoring system, the MICE reconstruction program runs online in parallel to data taking. This allows a detailed inspection of relevant physical parameters by the users on shift.
5.3 The MICE Offline Software System
The simulation, design and analysis of the experiment are supported by a variety of software tools. Most useful are G4MICE [42, 43] and G4beamline [41], both of which make use of the GEANT4 toolkit [38]. G4MICE provides an extensible framework for offline simulation, reconstruction and analysis as well as online monitoring and is the standard software in the experiment for all Step I analysis work. G4MICE contains configuration files that describe the geometry of the experiment (including detectors, magnets, absorbers and cavities), the cabling of the various detectors and their calibrations. Acting as a client to the Configuration Database, G4MICE is able to reconstruct data taken in any experimental configuration.
In addition to the GEANT4 toolkit for high-energy physics simulation, G4MICE also exploits the Fermilab BeamTools package to describe magnets, absorbers and cavities. Inside G4MICE, the Class Library for High Energy Physics (CLHEP) package [62] provides classes useful for random-number generation and other applications including mathematical functions (complemented by the GNU Scientific Library, GSL). In addition, the ROOT analysis framework [63] is used to develop graphical user interfaces and to perform data analysis using a wide variety of libraries including classes for drawing histograms, file persistency and graph fitting.
G4beamline provides fast simulation of particle behaviour in a variety of electric and magnetic fields and materials for a given geometry and set of beam-line optics. G4beamline is implemented in C++, although its associated user interfaces are implemented in Java. Users interact with the application exclusively through sets of data cards describing the parameters and geometry of a run, and are not required to write their own C++ code. G4beamline also includes visualisation features which allow users to view and explore the geometries generated from their data cards, as well as to study the particle species and trajectories of a sample of particles at any point in space. The QGSP_BIC hadronic package of GEANT4, which adequately describes particle production in the MICE target, has been used by both G4MICE and G4beamline in the optimisation of the beam line.
6 Characterisation of the MICE Muon Beam
MICE took data in the Step I configuration in summer 2010. Data were collected in each of the nine configurations defined in section 3 for both positive and negative beams. With the exception of a single broken PMT in TOF0, all detectors worked well. The MICE Muon Beam was operated at a maximum rate of 34 muons per target dip (in 1 ms) at a 1 Vms beam loss. About 10 million triggers were collected over the various beam configurations. The data were used for detector calibration, to assess the particle identification capabilities of each of the detectors and to characterise the beam line. The main results on muon rates and comparisons between data and Monte Carlo are summarised in the next section. A first measurement of the beam emittance, using the TOF detectors only, was also obtained [64] and will be the topic of a separate publication [65].
6.1 Particle rates and beam profiles in the MICE beam line
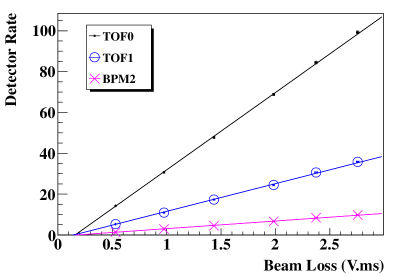
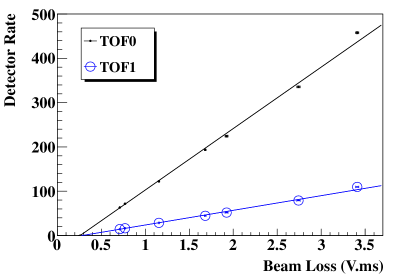
A dedicated study of particle rate in the MICE Muon Beam as a function of ISIS beam loss was performed. The particle rates observed in the GVA1, BPM2, TOF0 and TOF1 detectors were recorded along with the integrated SP7 beam loss. A series of runs, consisting of approximately 400 target dips each, were taken, each run corresponding to a particular target setting. The ISIS beam conditions were stable across a run. The mean beam loss and the mean particle rates were calculated by averaging the beam loss and particle rates recorded over the 400-dip sample. Figure 26 shows the dependence of the BPM2, TOF0 and TOF1 average particle rates as a function of the average beam loss. Negative beam-line optics with a 3.2 ms spill gate are shown in the left-hand panel of Figure 26, while positive beam-line optics with a 1 ms spill gate are shown in the right-hand panel. Straight-line fits are also shown and give an excellent description of the data [66],[67].
Muons were selected by the requirement that the time-of-flight between TOF0 and TOF1 be in the range ns. Pion contamination of the muon sample was estimated using G4MICE giving for the negative beam and values between 3 to 5% for the positive one. In the future, the contamination will be further reduced using the two Cherenkov counters (see section 4).
Table 5 summarises the muon rate determined for each of the nine beam configurations. Errors are a quadratic combination of the statistical error of the fits and the systematic uncertainties arising from the event selection. The results presented in table 5 indicate a muon rate of /s per Vms for a 3.2 ms gate for the negative beam and between 17 and 34 /s per Vms for a 1 ms gate for the positive beam. Studies are underway to determine the maximum beam loss induced by the MICE target which is acceptable during normal ISIS operations. In parallel, various proposals are being considered by which the muon rate per Vms of beam loss can be increased, including adding a beam “bump” to move the ISIS beam towards the MICE target, increasing the acceleration of the target shaft, and re-optimising the target geometry or material.
| rate (muons/V ms) | rate (muons/V ms) | |||||
|---|---|---|---|---|---|---|
| ( mm rad) | pz (MeV/c) | pz (MeV/c) | ||||
| 140 | 200 | 240 | 140 | 200 | 240 | |
| 3 | 4.10.2 | 6.3 0.2 | 4.90.2 | 16.81.8 | 33.13.2 | 33.02.6 |
| 6 | 4.10.4 | 4.80.2 | 4.50.2 | 17.8 1.8 | 31.02.0 | 31.72.0 |
| 10 | 4.6 0.2 | 5.40.2 | 4.40.1 | 21.62.2 | 34.02.5 | 26.11.5 |
A comparison between the beam profiles observed at TOF0 and TOF1 and those predicted by G4beamline has been carried out in order to validate the MICE simulations. Small misalignments between the TOF detectors and the magnetic axis formed by the quadrupole triplets were observed. Figures 27 and 28 show a comparison of particle rates per TOF slab in the plane (left) and the plane (right) after applying the misalignment corrections. The figures show that the beam profile at TOF0 is asymmetric in the projection. Furthermore, the -distributions are observed to be about 20% wider in the data than in the simulation.
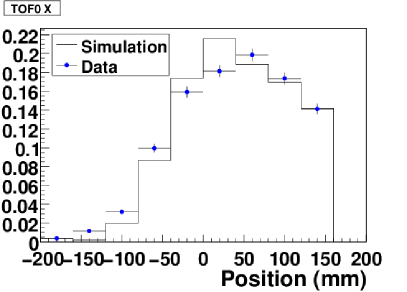
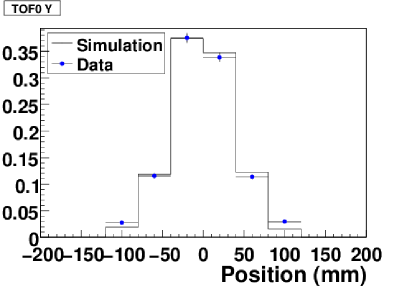
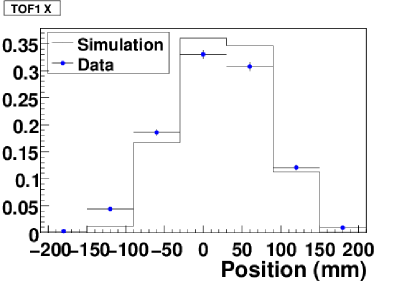
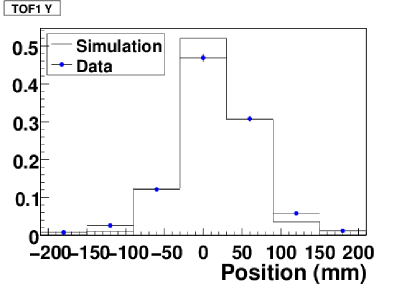
These distributions reflect the pion momentum spectrum as produced in 800 MeV proton Ti collisions, which is unlikely to be exactly modeled in GEANT4.
7 Conclusions
The MICE Muon Beam on ISIS at the STFC Rutherford Appleton Laboratory has been described. In addition, the design and performance of the MICE beam-line instrumentation has been presented. The MICE Muon Beam has been shown to deliver muon beams over the range of momentum and emittance required to carry out the MICE programme. Approximately 30 muons per 1 ms spill (at a rate of 1 Hz, for a 1 V ms beam loss) for a positive muon beam has been achieved, for a negligible activation of the ISIS synchrotron. Preliminary results on the pion contamination of the beam shows values at the per-cent level. The MICE Muon Beam and the instrumentation will serve the experiment as it is built up in a number of Steps, making it possible to prove the principle of the ionization-cooling technique that is essential to the realisation of the Neutrino Factory and the Muon Collider.
Acknowledgements
We gratefully acknowledge the help and support of the ISIS staff and of the numerous technical collaborators who have contributed to the design, construction, commissioning and operation of the experiment. In particular we would like to thank S. Banfi, F. Chignoli, R. Gheiger, A. Gizzi and V. Penna. We wish to acknowledge the essential contributions in the conceptual development of a muon cooling experiment made by P. Fabbricatore, R. Fernow, D. Findlay, W. Murray, J. Norem, P.R. Norton, K. Peach, C. Prior and N. McCubbin. We would also wish to acknowledge the work done in the early stages of the experiment by G. Barr, P. Chimenti, S. Farinon, G. Giannini, E. Radicioni, G. Santin, C. Vaccarezza and S. Terzo. The experiment was made possible by grants from National Science Foundation and Department of Energy (USA), the Istituto Nazionale di Fisica Nucleare (Italy), the Science and Technology Facilities Council (UK), the European Community under the European Commission Framework Programe 7, the Japan Society for the Promotion of Science (Japan) and the Swiss National Science Foundation (Switzerland), in the framework of the SCOPES programme. We gratefully acknowledge their support.
References
- [1] D. G. Koshkarev, Proposal for a decay ring to produce intense secondary particle beams at the SPS, Tech. Rep. CERN/ISR-DI/74-62, CERN Internal Report, 1974.
- [2] S. Geer, Neutrino beams from muon storage rings: Characteristics and physics potential, Phys.Rev. D57 (1998) 6989–6997, [hep-ph/9712290].
- [3] F. Tikhonin, On the effects at colliding mu meson beams, JINR-P2-4120 (2008) [hep-ph/0805.3961].
- [4] G. Budker, Accelerators and Colliding Beams, extract in AIP Conf. Proc. 352 (1996) 4.
- [5] V. Parkhomchuck and A. Skrinsky, Cooling Methods for Charged Particle Beams, Accelerator Science and Technology 1 (2008) 237–257.
- [6] D. Neuffer, Multi-TeV Muon Colliders, AIP Conf.Proc. 156 (1987) 201–208.
- [7] M. Bonesini and A. Guglielmi, Hadroproduction experiments for precise neutrino beam calculations, Phys.Rept. 433 (2006) 65–126.
- [8] S. Ozaki et. al., Feasibility study 2 of a muon based neutrino source, BNL-52623, http://www.cap.bnl.gov/mumu/studyii/FS2-report.html (2001).
- [9] Muon Collider/Neutrino Factory Collaboration, M. M. Alsharo’a et. al., Recent progress in neutrino factory and muon collider research within the Muon collaboration, Phys. Rev. ST Accel. Beams 6 (2003) 081001, [hep-ex/0207031].
- [10] A. Blondel (Ed. ) et. al., ECFA/CERN studies of a European neutrino factory complex, CERN-2004-002 (2004).
- [11] M. Apollonio et. al., Accelerator design concept for future neutrino facilities, JINST (2009) P07001.
- [12] S. Choubey et. al., International Design Study for the Neutrino Factory, Interim Design Report, IDS-NF-20 (2011) [hep-ex/1112.2853].
- [13] C. M. Ankenbrandt et. al., Status of muon collider research and development and future plans, Phys.Rev.ST Accel.Beams 2 (1999) 081001, [physics/9901022].
- [14] A. Blondel et. al., Proposal to the Rutherford Appleton Laboratory: an international muon ionization cooling experiment (MICE), MICE-NOTE-21 (2003). http://hep04.phys.iit.edu/cooldemo/micenotes/public/pdf/MICE0021/MICE0021.pdf.
- [15] G. Gregoire et. al., MICE Technical Report, tech. rep., Rutherford Appleton Laboratory, 2005. http://www.mice.iit.edu/trd/MICE-Tech-ref.html.
- [16] F. Ambrosino et. al., Calibration and performances of the KLOE calorimeter, Nucl.Instrum.Meth. A598 (2009) 239–243.
- [17] J. Cobb, Statistical Errors on Emittance Measurements, MICE-NOTE-268 (2009).
- [18] D. Forrest and F.J.P. Soler, A Study of Statistical Errors in MICE, AIP Conf.Proc. 1222 (2010) 490–493.
- [19] D. Lietti et. al., The prototype of the MICE Electron-Muon Ranger: Design, construction and test, Nucl.Instrum.Meth. A604 (2009) 314–318.
- [20] C. Booth et. al., The MICE Target, Nucl. Instrum. Meth. A (2012). To be submitted.
- [21] M. Clarke-Gayther, A. Borden, and G. Allen, Global Beam Loss Monitoring Using Long Ionisation Chambers at ISIS., Proceedings 4th European Particle Accelerator Conference (EPAC 94) 27 June - 1 July 1994, London, England (1994) 1634–1636.
- [22] “Hamamatsu Photonics.” http://www.hamamatsu.com/.
- [23] “LeCroy Research Systems (Chestnut Ridge, NY, USA) Data Sheets.” http://www.lecroy.com/dsheets/dslib.htm/.
- [24] D. Forrest, The Muon Ionization Cooling Experiment, PhD thesis, University of Glasgow (2011).
- [25] A. Dobbs, D. Forrest, and F. Soler, The MICE Luminosity Monitor, MICE-CONF-BEAM-367 (2011).
- [26] T. Roberts, MICE Beamline Magnet Drawings, MICE-NOTE-BEAM-0065 (2003).
- [27] U. Rohrer. http://aea.web.psi.ch/Urs-Rohrer/MyWeb/mue4bl.htm.
- [28] J. Nebrensky and P. Hanlet, POMPOMs: Cost-Efficient Polarity Sensors for the MICE Muon Beamline, Paper ID: TUPD90 at 10th European Workshop on Beam Diagnostics and Instrumentation for Particle Accelerators, DIPAC2011, Hamburg, Germany, May 16th-18th, 2011 (2011).
- [29] V. Blackmore, J. Cobb, M. Dawson, J. Tacon, and M. Tacon, Particle Tracking and Beam Matching through the New Variable Thickness MICE Diffuser, Proceedings 2011 Particle Accelerator Conference (PAC’11), 28 March-1 April 2011, New York, USA (2011).
- [30] http://tufnol.com/tufnol/default.asp.
- [31] http://www.rohacell.com/product/rohacell/en/Pages/default.aspx.
- [32] “Dupont.” http://www2.dupont.com/Tedlar-PVF-Film/en-US/index.html.
- [33] http://www.burle.com/selectgui.htm.
- [34] K. Brown, D. Carey, C. Iselin, and F. Rothacker, TRANSPORT - A Computer Program for Designing Charged Particle Beam Transport Systems, CERN Report 73-16, revised as CERN Report 80-4 (1980).
- [35] U. Rohrer. http://aea.web.psi.ch/Urs-Rohrer/MyWeb/.
- [36] D. Carey, K. Brown, and C. Iselin, Decay Turtle, SLAC-246, UC-28 (I/A).
- [37] K. Tilley, D. Adams, P. Drumm, T. Roberts, and K. Walaron, Design and expected performance of the muon beamline for the Muon Ionisation Cooling Experiment, Proceedings 10th European Particle Accelerator Conference (EPAC 06) 26-30 Jun 2006, Edinburgh, Scotland, Ed: C. Prior (2006) 2397–2399.
- [38] GEANT4 Collaboration, S. Agostinelli et. al., GEANT4: A Simulation toolkit, Nucl.Instrum.Meth. A506 (2003) 250–303.
- [39] “Geant4, a toolkit for the simulation of the passage of particles through matter.” http://geant4.cern.ch/.
- [40] T. Roberts, K. Beard, S. Ahmed, D. Huang, D. Kaplan, and L. Spentzouris, Particle Tracking in Matter-dominated Beam Lines, Proceedings 1st International Particle Accelerator Conference (IPAC 10) 23-29 May 2010, Kyoto, Japan (2010) 1871–1873.
- [41] “G4beamline, A “Swiss Army Knife” for Geant4, optimized for simulating beamlines.” http://g4beamline.muonsinc.com.
- [42] C. Rogers and R. Sandstrom, Simulation of MICE using G4MICE, Proceedings 10th European Particle Accelerator Conference (EPAC’06), 26-30 June 2006, Edinburgh, UK (2006) 2400–2402.
- [43] M. Ellis, MICE Software Design and Physics Performance, Proceedings 10th ICATPP Conference On Astroparticle, Particle, Space Physics, Detectors And Medical Physics Applications, 8-12 Oct 2007, Villa Olmo, Como, Italy (2007) 763–770.
- [44] M. Apollonio, Emittance Generation in MICE, Proceedings of the 23rd Particle Accelerator Conference 4 - 8 May 2009, Vancouver, British Columbia, Canada (2009) 3835–3837.
- [45] M. Apollonio and M. Rayner, Optimization of the MICE Muon Beam Line, Proceedings 1st International Particle Accelerator Conference (IPAC 10) 23-29 May 2010, Kyoto, Japan (2010) 3461–3463.
- [46] R. Bertoni et. al., The design and commissioning of the MICE upstream time-of-flight system, Nucl.Instrum.Meth. A615 (2010) 14–26, [hep-ph/001.4426].
- [47] L. Cremaldi, D. A. Sanders, P. Sonnek, D. J. Summers, and J. J. Reidy, A Cherenkov Radiation Detector with High Density Aerogels, IEEE Trans.Nucl.Sci. 56 (2009) 1475–1478, [hep-ph/0905.3411].
- [48] D. Sanders, MICE Particle Identification Systems, Particle Accelerator Conference (PAC09), Vancouver (2009) [hep-ph/0910.1332].
- [49] R. Bertoni et. al., The Construction of the MICE TOF2 detector, MICE-NOTE-DET-286 (2010).
- [50] “CAEN Electronic Instrumentation.” http://www.caen.it/csite.
- [51] “Bicron.” www.detectors.saint-gobain.com.
- [52] M. Bonesini et. al., Behaviour in magnetic fields of conventional and fine-mesh photomultipliesr, Nucl.Instrum.Meth. A (2012). To be submitted.
- [53] Y. Kharadzov et. al., TOF detectors time calibration, MICE-NOTE-DET-231 (2009).
- [54] “Scionix Holland BV.” http:www.scionix.nl.
- [55] R. Bertoni et. al., Analysis of PID detectors (TOF and KL) performances in the MICE 2010 run, MICE-NOTE-DET-337 (2011).
- [56] M. Bonesini et. al., The Refurbishing of MICE TOF0 and TOF1 detectors, MICE-NOTE-DET-363 (2012).
- [57] A. Ghigo, G. Mazzitelli, F. Sannibale, P. Valente, and G. Vignola, Commissioning of the DANE beam test facility, Nucl. Instrum. Meth. A515 (2003) 524–542.
- [58] D. Forrest and F.J.P. Soler, A new application for the Grid: muon ionization cooling for a Neutrino Factory, Phil.Trans.Roy.Soc.Lond. A368 (2010) 4103–4113.
- [59] ALICE Collaboration, D. Rohrich et. al., The ALICE DQQ: Current status and future challenges, . CERN-ALICE-PUB-99-37.
- [60] M. Clausen and L. Dalesio, EPICS: Experimental physics and industrial control system, ICFA Beam Dyn.Newslett. 47 (2008) 56–66.
- [61] D. Forrest, The MICE Configuration Database System, MICE-NOTE-COMP-0327 (2011).
- [62] L. Lonnblad, CLHEP: A project for designing a C++ class library for high-energy physics, Comput.Phys.Commun. 84 (1994) 307–316.
- [63] R. Brun, P. Canal, and F. Rademakers, Design, development and evolution of the ROOT system, PoS ACAT2010 (2010) 002.
- [64] M. Rayner, The development of a novel technique for characterising the MICE muon beam and demonstrating its suitability for a muon cooling measurement, PhD thesis, University of Oxford (2011).
- [65] MICE Collaboration, M. Bogomilov et. al., First measurement of emittance in the MICE experiment, in preparation (2012).
- [66] A. Dobbs, K. Long, and A. Alekou, The MICE muon beamline and induced host accelerator beam loss, Proceedings 2011 Particle Accelerator Conference (PAC’11), 28 March-1 April 2011, New York, USA (2011) MOP021.
- [67] A. Dobbs, Particle Rate and Host Accelerator Beam Loss on the MICE experiment, PhD thesis, Imperial College London (2011).