Fibril elongation mechanisms of HET-s prion-forming domain: Topological evidence for growth polarity
Abstract
The prion-forming C-terminal domain of the fungal prion HET-s forms infectious amyloid fibrils at physiological pH. The conformational switch from the non-prion soluble form to the prion fibrillar form is believed to have a functional role, since HET-s in its prion form participates in a recognition process of different fungal strains. Based on the knowledge of the high-resolution structure of HET-s(218-289) (the prion forming-domain) in its fibrillar form, we here present a numerical simulation of the fibril growth process which emphasizes the role of the topological properties of the fibrillar structure. An accurate thermodynamic analysis of the way an intervening HET-s chain is recruited to the tip of the growing fibril suggests that elongation proceeds through a dock and lock mechanism. First, the chain docks onto the fibril by forming the longest -strands. Then, the re-arrangement in the fibrillar form of all the rest of molecule takes place. Interestingly, we predict also that one side of the HET-s fibril is more suitable for substaining its growth with respect to the other. The resulting strong polarity of fibril growth is a consequence of the complex topology of HET-s fibrillar structure, since the central loop of the intervening chain plays a crucially different role in favouring or not the attachment of the C-terminus tail to the fibril, depending on the growth side.
I Introduction
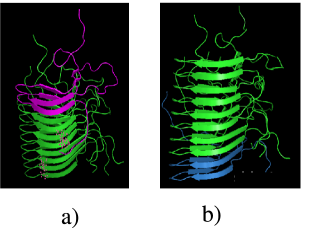
Prions are self-propagating, usually amyloid-like protein aggregatesAguzzi et al. (2008) that are responsible for transmissible diseases. Examples of prion diseases are scrapie in sheepPrusiner (1982), bovine spongiform encephalopathyWells et al. (1987)(BSE) in cattle and new variant Creutzfeldt-Jakob diseaseWill et al. (1996) in man. In contrast to these disease-related cases, several proteins displaying prion properties are well known in yeast and fungiTuite and Serio (2010). The HET-s prion protein produced by the filamentous fungus Podospora anserina is thought to be involved in a specific function. The switching on of its prion form triggers the programmed-cell-death phenomenon named “heterokaryon incompatibility”Lange and Meier (2008); Saupe (2000) which can prevent different forms of parasitism, by inducing the death of the heterokaryon formed by cell fusion of different fungal strains. The proteinase K-resistant core of the prion fibrils formed by the C-terminal residues 218-289 (PFD:prion forming domain) is unstructured in solution and forms infectious fibrils in vitroBaulgerie et al. (2003). Earlier work showed that HET-s PFD fibrils consist of four -strands forming two windings of a -solenoidRitter et al. (2005) however without giving further information about the details of the intra- and inter-molecular -sheet architecture. Recently, the structure of HET-s PFD has been determinedWasmer et al. (2008) on the basis of NMR-derived intra and intermolecular distance restraintsCastellani et al. (2002); Lange et al. (2005). This is the only atomic-resolution structural model of an infectious fibrillar state reported to date. On the basis of 134 intramolecular and intermolecular experimental distance restraints, HET-s PFD forms a left-handed -solenoid, with each molecule forming two helical windings, a compact hydrophobic core, at least 23 hydrogen bonds, three salt bridges and two asparagine ladders (see Fig. 1a and 1b). The model is supported by electronic diffraction and scanning transmission electronic microscopyWasmer et al. (2008).
Despite the tremendous economical and social relevance of diseases related to prion infections and protein aggregation and the enormous quantity of research devoted to their study, the mechanisms that rule and trigger fibril formation and elongation remain mostly elusive: the nature of protein aggregation, its limited structural order, its insolubility in water and its involvement with the cell membrane render its experimental study extremely difficult. For these reasons relevant breakthroughs in understanding the principles of amyloid formation and fibril growth might come from numerical simulations.
Recent advances in hardware and methodology have allowed for realistic atomic resolution molecular dynamics (MD) simulations with physics-based potentials of small fibrils consisting of a few monomer units that make possible to span time scales of hundreds of nanoseconds Cecchini et al. (2006); Huet and Derremaux (2006); Ma and Nussinov (2006); Tarus et al. (2006); Buchete and Hummer (2007); Baumketner and Shea (2007); O’Brien et al. (2009) and even of for smaller systems Reddy et al. (2009); Wei et al. (2010); Takeda and Klimov (2010). These results were mainly obtained by studying the amyloid -peptide (A), related to the Alzheimer’s diseaseHardy and Selkoe (2002), or its mutants and fragments. In this context, experimental observations had first originated the proposal that incoming A monomers associate to the elongating fibril through a two stages “dock and lock” kinetic mechanism Esler et al. (2000). In the first stage, an unstructured monomer docks onto the fibril while maintaining some degree of conformational freedom. In the second stage, the monomer locks into the final fibril state. Such a mechanism was later confirmed and refined, also in the context of A-peptide oligomerization, by other experimental and simulation studies Cannon et al. (2004); O’Brien et al. (2009); Straub and Thirumalai (2010). The dock and lock mechanism was further employed, for the A-peptide, to describe fibril elongation within a thermodynamic context, by means of all-atom MD simulations Takeda and Klimov (2009). A continuous docking stage was observed to occur over a wide temperature range without free energy barriers or intermediates, whereas the locking stage at lower temperatures was characterized by many competing free energy minima in a rugged landscape.
In the case of the fibrillar HET-s PFD protein, it was possible with MD atomistic simulation to probe the stability of the NMR structure on a 10 ns timescale and to predict the behaviour of the salt bridge networkLange et al. (2009). On the other hand, typical elongation times for amyloid fibrils formed by HET-s PFD are of the order of hoursSabaté et al. (2009), so that coarse grained approaches, in which protein chains and amino-acid interactions are modeled in a simplified way, are mandatory to investigate such longer time scales. Indeed, despite the difficulty of finding reliable energy functions, these approaches has been successfully used in outlining general aspects of the full phase diagram of a generic aggregating polypeptide systemHoang et al. (2006); Auer et al. (2009); Auer and Kashiev (2010), to emphasize the importance of the contribution of hydrophobic interactions and hydrogen bonding in the aggregation process of the A peptide peptideNguyen and Hall (2006); Borroguero et al. (2005); Wei et al. (2004); Fawzi et al. (2005); Urbanc et al. (2004); Favrin et al. (2004) and even to study the mechanisms of monomer addition for the A peptide and some of its mutantsLam et al. (2008); Urbanc et al. (2010); Rojas et al. (2010).
In this paper, in order to describe the fibril elongation mechanisms of a relatively long protein domain such as HET-s PFD, we prefer to employ a still different coarse-grained approach since in this case there is the unique advantage of knowing from experiments the fibril structure. At a general level, our strategy falls in the class of approaches used in protein folding that builds on the importance of the native state topology in steering the folding process Go and Scheraga (1976). In its simplest example, the formation of contacts is favoured only for pairs of amino acids that are found interacting in the native state, but non-native sequence dependent interactions could be introduced as well. Despite the semplicity of this scheme, in the past few years, an increasing number of experimental and theoretical studies have confirmed the utility of the Go-like approach in the characterization of various aspect of protein folding and binding processesMicheletti et al. (1999); Alm and Baker (1999); Baker (2000); Clementi et al. (2000); Hubner et al. (2004); Levy et al. (2005); Lam et al. (2007); Sulkowska et al. (2009).
The study of protein aggregation has been already tackled by using Go-like modelsDing et al. (2002); Jang et al. (2004), but due to the absence of experimental information on the fibrillar structure, hypothetical aggregate conformations had to be introduced to build the Go-energy function driving aggregation. Moreover, topologically based models, with reduced effect of non-local interactions, correspond to funneled energy landscapes and therefore their application should be limited to situations in which proteins are evolutionarily designed to follow the principle of minimal frustrationBryngelson and Wolynes (1987), which results in a faster search through the many possible alternatives. In general, a funneled energy landscape is not expected in the case of non-functional fibril formation. Therefore, the accurate knowledge of its structure, the complex intra-chain topology, and the plausible involvement in a functional process makes HET-s PFD a suitable and, at the moment, unique candidate to exploit successfully Go-like models for studying amyloid formation and fibril elongation mechanisms.
Within this approach, implemented through a Monte-Carlo procedure combined with replica exchange methods, we analyze the full thermodynamic properties of the fibril elongation process, e.g. of the association of a free chain to the already formed fibrillar structure of HET-s PFD under different concentration conditions. The behaviour of both energies and heat capacities shows that the association process becomes more cooperative for concentrations in the range () of standard in-vitro experimentGreenwald et al. (2010). A careful study of the association process shows that fibril elongation is triggered by the docking of the free chain onto the fibril in a concentration dependent mechanism that involves the formation of both inter- and intra-chain hydrogen bonds stabilizing the longest -strands, rapidly followed by the assembly of the full domain. This behaviour is similar to the “dock and lock” mechanism proposed for the amyloid A- fibril formation Esler et al. (2000); Takeda and Klimov (2009).
Another interesting aspect emerges clearly: elongation proceeds differently according to which side of the fibril (see Fig 1a and 1b) is used as the growing end. Elongation from one side is clearly favoured with respect to the other side, implying a strong polarity in the growth of HET-s PFD fibrils, which may even lead to unidirectional elongation. Polarity in fibril growth is a feature already discussed in the literature for other amyloid-forming proteins, in both experimentsBlackley et al. (2000); DePace and Weissman (2002) and numerical simulationsFawzi et al. (2007); Takeda and Klimov (2009). Our data suggest that growth polarity can be explained for HET-s PFD on the basis of the complex topological properties of its fibrillar structure. A key role is played by the behaviour of one long loop connecting two -strands in consecutive rungs of the fibrillar structure. Depending on the elongation side, this loop may help or not the winding of the C-terminal part of the attaching chain into the fibrillar form. Since it is known that the prion loses its infectivity upon partial deletion of that loopRitter et al. (2005), we argue that this topological mechanism may be important for functional fibril growth.
II Methods
II.1 Protein chain representation and energy function
Chains A and B were selected from the NMR structure of HET-s PFD (PDB code: 2rnm), where chain B stays on top of chain A along the fibril. We keep one chain frozen whereas the other one is free. In the top elongation mode, chain B is free and chain A is frozen, whereas in the bottom elongation mode, chain A is free and chain B is frozen. The free chain is allowed to move in a hemisphere of radius defined by , () for top (bottom) elongation. The frozen chain is placed with center-of-mass (i.e. average Cα) coordinates (i.e. on the hemisphere axis) and Å ( Å) for top (bottom) elongation, rotated in such a way that the fibril axis is parallel to the hemisphere axis. The center-of-mass position along the hemisphere axis is chosen in order to expose only one ‘sticky’ end of the frozen chain to the free chain, by placing the other end roughly on the hemisphere base . This allows a smaller computational effort, at the expense of prohibiting conformations that we do not expect to affect in a relevant way the binding of the free chain on the exposed end of the full fibril, here represented by the frozen chain. The portion of HET chain that we simulate goes from position 217 to position 289, which includes 73 aminoacids (e.g. in the simulation we include also the MET aminoacids at position 217 used to obtain the NMR structure). We thus simulate a system with 146 aminoacids.
In order to perform extensive simulations, we use a coarse-grained representation of the protein chain coupled with an energy function based on the knowledge of the PDB fibril structure. In the spirit of Go-like approaches widely used for globular proteins Go and Scheraga (1976), the energy function is built in such a way to have its minimum for the PDB structure. Inspired by Ref. Hoang et al. (2004), each aminoacid is represented by an effective spherical atom located at the position of the corresponding Cα atom. The virtual bond angle associated with three consecutive atoms is constrained between and . Virtual bond lengths are kept constant and equal to the native values from the PDB file. To implement steric constraints we require that no two non-adjacent atoms are allowed to be at a distance closer than Å. We assign an energy to each hydrogen bond that can be formed between two residues that form it in the PDB fibril structure, and we disregard any other attractive interaction (i.e. hydrogen bonds cannot be formed by two residues that do not form it in the PDB fibril structure and we do not consider any other type of pairwise interaction except for the excluded volume constraints). Only -sheet stabilizing hydrogen bonds can therefore be formed in our simulation, and in order to identify them within a -representation, we use the geometrical rules for non-local hydrogen bonds introduced in Ref. Hoang et al. (2004). In order to recognize the hydrogen bonds present in the PDB fibril structures the lower bound on the scalar product between binormal and connecting vectors was decreased to ( in the original formulation, see Table 1 and Fig. 1 in Ref. Hoang et al. (2004) for the precise listing of all hydrogen bond rules and the definition of binormal and connecting vectors).
In this way, we find in the PDB fibril structure (see Fig. 2 and Fig. 3) two long parallel -strands ( and ), connected by 9 hydrogen bonds and four shorter strands: parallel to (linked together by 4 hydrogen bonds) and parallel to (2 hydrogen bonds). Those strands alternate within the fibrillar structure in pairs which form hydrogen bonds within the same chain (intra-chain bonds) and pairs which form hydrogen bonds between neighbouring chains (inter-chain bonds). Each strand in the core of the fibrillar structure forms intra-chain bonds on one side and inter-chain bonds on the other side. In the “top” side of the fibril (see Fig. 2 and Fig. 3), the exposed strands in the ‘sticky’ end are , , whereas in the “bottom” side the exposed strands are , .
Since we keep fixed one chain, the ground state has energy -30 (15 intra-chain hydrogen bonds plus 15 inter-chain hydrogen bonds - we are not counting the intra-chain bonds of the frozen chain). Hence, energy can range from (unbound chains) to (fully bound chains in the fibrillar state). In order to fix a realistic temperature scale, the effective value of hydrogen bond energy in our Go-like energy function was given the value , so that the unit temperature of our simulations corresponds to K.
We have simulated the elongation of the fibril from both sides. For each side we simulated chains confined in a hemisphere centred in the origin and of radius , , and corresponding to concentrations , and . The latter value is close to typical concentrations used in vitro aggregation experiment Sabaté et al. (2009); Greenwald et al. (2010).
II.2 Monte-Carlo simulation
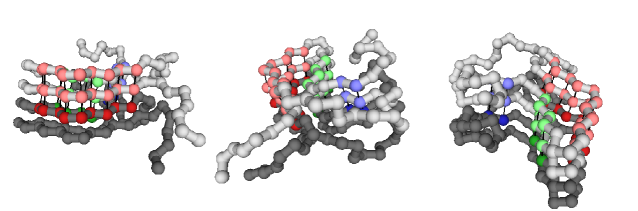
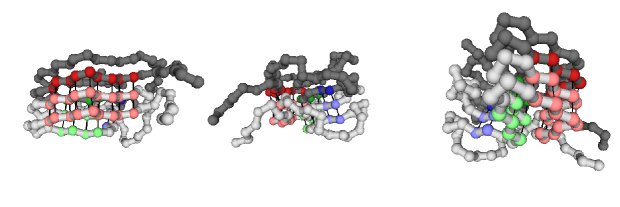
Fibril elongation is simulated by means of a Monte Carlo procedure. Multiple Markov processes Tesi et al. (1996), each replicating the same system of a fixed chain and a free chain attaching to it described above, are run in parallel at different temperatures, with possible swaps of replicas, in order to sample efficiently the conformational space from high ( ∘C) to low temperatures ( ∘C). Within the same replica, conformations are evolved using trial moves, which either pivot a part of the chain from a randomly chosen residue to its end, or rotate a chain portion between two residues along the direction joining them. In the latter case the two residues are either chosen randomly or chosen to be next-nearest neighbours along the chain. Trial moves are accepted or rejected according to the Metropolis test Metropolis et al. (1953). We use 20 different replicas, chosing their temperatures to sample more accurately the transition region ( ∘C ∘C) and to provide reasonable overlap of energy histograms between neighbouring pairs. Roughly Monte Carlo steps ( is the number of residues of the free chain) are performed independently for each replica before one replica swap is attempted among a randomly chosen neighbouring pair. Overall, roughly replica swaps are attempted for each simulation and the acceptance rate of replica swaps is in all cases above %. The convergence to the equilibrium regime is assessed by looking at the evolution of system energy as a function of Monte Carlo steps. In order to compute equilibrium thermodynamic averages, the simulation portion corresponding to the initial swaps is discarded from the collected data, with ranging from to , depending on concentration. Data from all temperatures are elaborated with the multiple-histogram method Wang and Landau (2001). In Fig. 4 some snapshots of the simulations are represented.
III Results
III.1 Cooperativity of the elongation process
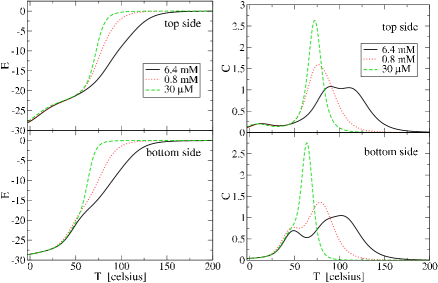
To characterize the thermodynamic properties of the HET-s fibril growth process we study the behaviour of the energy and of the heat capacity of the system as a function of the temperature for three different protein concentrations (see Fig. 5) and by considering elongation both from the top and from the bottom side (see Methods). The peaks in the heat capacity curve signal the occurrence of large conformational rearrangements (that strictly speaking would become transitions only in the thermodynamic limit of the number of system component going to infinite) related to the process of the deposition of the free HET-s PFD chain to the one that is kept fixed to represent the sticky end of the already formed fibril.
As expected, the first association temperature, related to the high temperature heat capacity peak, decreases when lowering the concentration. It reaches values close to room temperature for the concentration . Interestingly, the cooperativity of the transition increases for lower concentrations: this is signalled by a more sigmoidal behaviour of the energy profiles, by the sharpening of heat capacity peaks and by the almost complete merging in one single narrow peak of the otherwise complex peak structure. Despite at a first glance the growth processes from the two different sides look similar, one can notice that at low concentration a residual peak remains at low temperature for the top elongation case.
III.2 Stability of hydrogen bond formation
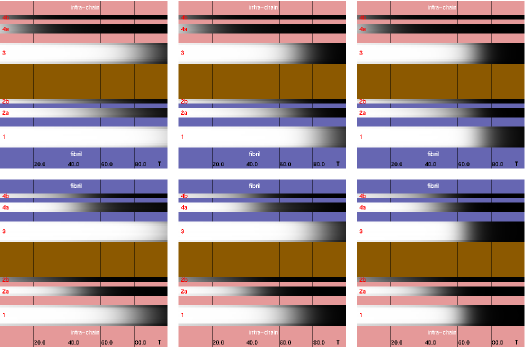
To elucidate further these behaviours and to understand the nature of the conformational rearrangements related to heat capacity peaks we computed the formation probability of hydrogen bonds for the different strands as a function of temperature (shown in Fig. 6). We define the stabilization temperature of a group of hydrogen bonds to correspond to their average formation probability at thermodynamic equilibrium being equal to 0.5. We compute stabilization temperatures for 6 possible groups of hydrogen bonds, corresponding to the different strand pairings shown as separate white/black bands in Fig. 6. The resulting stabilization temperatures are summarized in Table 1.
We will use the term ‘fibrillar’ for inter-chain hydrogen bonds. As an example, strand of the mobile chain couples with strand of the fixed chain, in the case of elongation from the top side; whereas strand of the mobile chain couples with strand of the fixed chain in the case of elongation from the bottom side, and similarly for other strand pairs (see Fig. 6 caption for a detailed explanation of how intra-chain and fibrillar hydrogen bonds are represented in the figure).
For all concentrations and for both elongation sides, the first hydrogen bonds which become stable are the inter-chain ones formed between the long strands and , at a temperature varying from ∘C for top elongation at concentration , to ∘C for bottom elongation at (see Table 1). The stabilization temperature of fibrillar hydrogen bonds between the long strands is higher for higher concentrations and, at the same concentration, for the case of top side elongation.
This first stabilization process is followed at a lower temperature (varying from ∘C for top elongation at concentration , to ∘C for bottom elongation at , see Table 1) by the stabilization of intra-chain hydrogen bonds formed between the two long strands, and , of the mobile chain. This second stabilization temperature is again higher for the top elongation case, at the same concentration, and increases with concentration.
With a further decrease of the temperature the fibrillar hydrogen bonds formed between the short strands ( with and with ) become stable. The stabilization temperature for inter-chain strand pair and does not depend on concentration but only on the elongation side, being higher, ∘C, for top elongation with respect to ∘C for bottom elongation. The stabilization temperature for inter-chain strand pair and is roughly the same, ∘C, in all cases.
The last step involves the stabilization of the intra-chain hydrogen bonds between the short strands and do not depend as well on concentration. At this stage the more significant difference between the two elongation sides emerges. For top side elongation, the two short strand pairs are stabilized roughly together at a temperature much lower with respect to the previous step ( ∘C corresponding to the small peak in the heat capacity curve and ∘C). For bottom side elongation, the stabilization of the two short intra-chain strand pairs takes place at quite different temperatures: hydrogen bonds between strands and are stabilized at a even slightly higher temperature than their inter-chain counterpart ( ∘C), whereas the intra-chain strand pair and is stabilized at a much lower temperature ( ∘C).
III.3 ’Dock and lock’ mechanism
Upon assuming that the order in hydrogen bond stabilization mirrors a similar order in the kinetics of the elongation process, we can extract a general message from these results by stating that the attaching of a mobile chain onto the elongating fibril is triggered by the formation of the inter-chain hydrogen bonds of the longest strand ( or ) followed by a first partial folding of the chain through the formation of the long intra-chain strand pair (between and ) and by the successive formation of all other inter- and intra-chain hydrogen bonds. The mechanism of addition of a soluble unstructured monomer to a preformed ordered amyloid fibril is a complex process: the deposition involves an association of the unstructured monomer to the fibril surface (docking) followed by a conformational rearrangement leading to the incorporation onto the underlying fibril lattice (locking) Esler et al. (2000); Cannon et al. (2004); O’Brien et al. (2009); Straub and Thirumalai (2010).
We identify the docking stage with the formation of both inter- and intra-chain hydrogen bonds between the long strands and , as in both cases the stabilization temperatures and depends on concentration (see Table 1). One indeed expects that in a denser regime it is easier for the mobile chain to dock onto the fibril end, while the locking into the -helix structure necessary for fibril propagation should not be affected by concentration changes. Therefore, the locking stage involves the formation of both inter- and intra-chain hydrogen bonds between the remaining shorter strands, since we observe that their stabilization temperatures do not depend on concentration. The dependence of the intra-chain hydrogen bond stabilization temperature upon concentration is non-trivial and is triggered by the strong concentration dependence of the formation probability of the fibrillar hydrogen bonds between the long strands. The higher the concentration, the more probable the fibrillar bonds to be formed. Consequently, the more easily the intra-chain bonds are stabilized.
From the data shown in Fig. 6 and in Table 1, another general feature can be picked out: the temperature range in which the docking stage and thus the full elongation process take place decreases at lower concentrations. This is consistent with the increment of cooperativity as it appears from thermodynamic quantities (e.g. sharpness of heat capacity peaks in Fig. 5) when concentration diminishes. The most cooperative behavior, as shown by the presence of a single sharp peak in the heat capacity curve, is obtained at concentration in the case of bottom side elongation, whereas a second peak is clearly visible at low temperature for top side elongation at the same concentration. The above analysis of Fig. 6 data reveals the crucial role of the formation of intra-chain hydrogen bonds between strands and in this respect. The stabilization temperature of these hydrogen bonds constitutes the most relevant difference between the two elongation modes in the first place. Moreover, it does correspond closely in both cases to significant features in the heat capacity curve, namely the small peak at C for top elongation and the small shoulder in the main peak at C for bottom elongation.
III.4 Competition between intra-chain and inter-chain hydrogen bonds
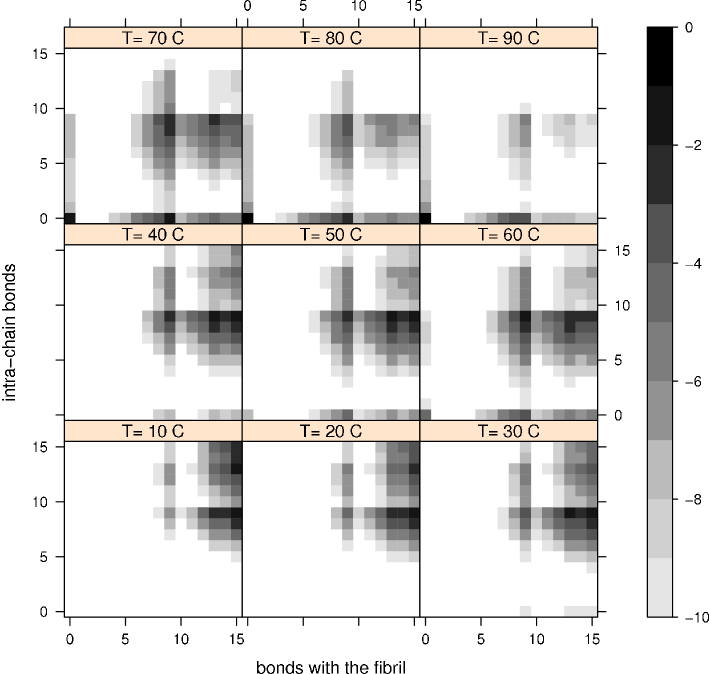
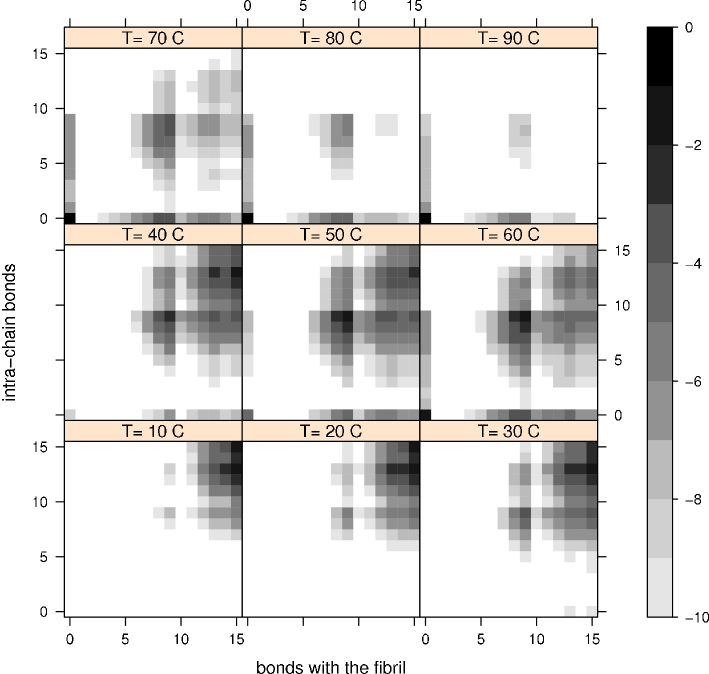
In order to gain a further understanding of the role played by intra-chain - hydrogen bonds we computed for different temperatures the equilibrium occupation probabilities of macroscopic conformational states, which are defined according to the number of formed intra- or inter-chain hydrogen bonds. In Fig. 7 and Fig. 8 the results are shown for concentration and for the two different growth modes. Occupation probabilities are shown in logarithmic scale, so that the resulting data could be interpreted as (the opposite of) effective free energies or mean force potentials. At high temperature, the bottom left corner is mostly populated, corresponding to conformations with very few or none intra- and inter-chain hydrogen bonds formed, typical of a mobile chain not yet attached to the fibril end. On the other hand, at very low temperature, the opposite top right corner is populated, describing structures with almost all the hydrogen bonds formed that correspond to mobile chains found already completely associated to the fibril end with a significant probability.
Consistently with the previous analysis, based on Fig. 6 data, the elongation process is complex, taking place in several stages. Macrostates with only intra-chain hydrogen bonds are found to be populated to some extent at high temperatures, hinting to the possibility of a pre-structuring of the mobile chain before docking to the fibril tip, yet the pathway more significantly visited involves the population of first the 9 fibrillar hydrogen bonds between strand and and then the analogous intra-chain bonds (see C in Fig. 7 and Fig. 8).
After this first stage, that we already identified with docking, two different scenarios emerge again clearly, depending on the growth mode. The overall process is visibly more cooperative for bottom side elongation (Fig. 8) with respect to top side elongation (Fig. 7), since the spreading of significantly visited macrostates is restricted to a narrower temperature range in the former case. Moreover, around room temperature (C), the most populated state for bottom side elongation has 15 fibrillar and 13 intra-chain hydrogen bonds formed corresponding to a chain almost completely attached to the fibril end (only strand is left wiggling a bit). Instead, the most populated state for top side elongation has all 15 inter- but only 9 intra-chain hydrogen bonds locked into the fibrillar conformation, signalling again that the stability of intra-chain - hydrogen bonds is strongly weakened with respect to bottom side elongation.
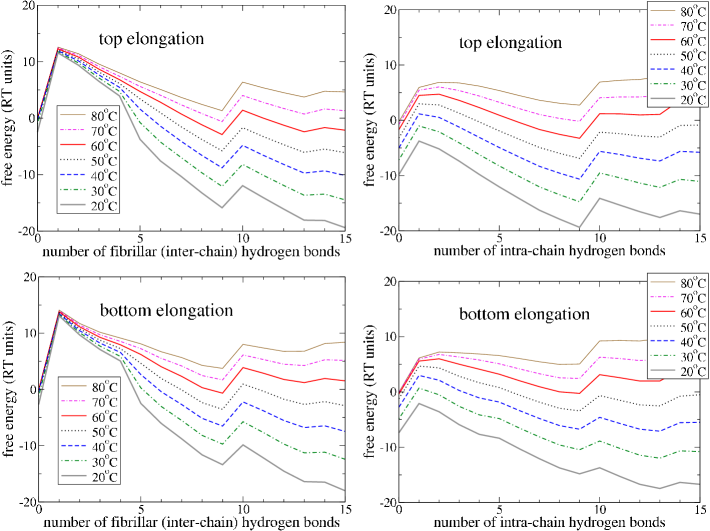
In order to appreciate more easily the variations with temperature in the population of the different macrostates, we computed unidimensional free energy profiles as a function of the number of either intra- or inter-chain hydrogen bonds. The results are shown in Fig. 9 for concentration and for the two different growth modes.
Fig. 9 pictures confirm the multistage nature of the association process with different macrostates that become the global free energy minimum at different temperatures. The free energy profiles as a function of the number of fibrillar hydrogen bonds are similar in both elongation modes. The main difference is the value of the temperature below which the free state (none fibrillar hydrogen bond is formed) is not the free energy minimum anymore: C for top elongation and C for bottom elongation, consistently with Table 1.
The free energy of the free state and the free energy barrier that separates it from the competing minimum with fibrillar bonds (the ones formed between the -strands and that are the first to be stabilized in the association process) do not basically depend on temperature. This is a signature of their entropic origin (free energies in fig. 9 are plotted in units), as they are both dominated by the roto-translational entropy of the free chain.
On the other hand, the free energy profiles as a function of the number of intra-chain hydrogen bonds display a relevant difference between the two elongation modes, consistently with previous observations. For top elongation, the free energy minimum at C is the macrostate with only intra-chain hydrogen bonds (i.e. the -strands and are not yet paired), whereas for bottom elongation the free energy minimum at C is the macrostate with intra-chain hydrogen bonds (i.e. the -strands and are already paired).
Interestingly, the above difference is due to the macrostate with intra-chain hydrogen bonds being entropically stabilized for top elongation with respect to bottom elongation. Indeed, the free energies for intra-chain hydrogen bonds do not differ in the two elongation modes. Moreover, the free energy difference between the two elongation modes for intra-chain hydrogen bonds has to be entropic, since the energy of that macrostate is the same in both cases, being given by the intra-chain plus the inter-chain hydrogen bonds (the latter is the global free energy minimum at C for both elongation modes).
III.5 Topological origin of fibril growth polarity
Our analysis clearly established that fibril growth exhibits a deeply different thermodynamic behaviour depending on the side from which elongation proceeds: at room temperature only bottom side elongation is thermodynamically stable. What is the physical reason for the existence of such a strong growth polarity? Since our simulation study is based only on the knowledge of the fibril structure and not on the specificity of the amino-acid sequence, we can expect that growth polarity is a consequence of the topological properties of the structure.
There is indeed a deep topological difference between the deposition mechanisms of HET-s PFD on the two different sides of the fibril. In the first docking stage, common to both elongation modes, the formation of both inter- and intra-chain hydrogen bonds between and implies the positioning of the latter strands into a conformation already compatible with the final fibrillar structure. The remaining strands, then, yet to be positioned, acquire distinct topological roles, since and are in a loop between the two chain portions already pinned down in the fibrillar structure, whereas and are in the C-terminal tail of the chain. One can then predict that, for entropic reasons, the former pair can be accomodated into the final fibrillar structure more easily than the latter pair. Nevertheless, different elongation modes may change this hierarchy.
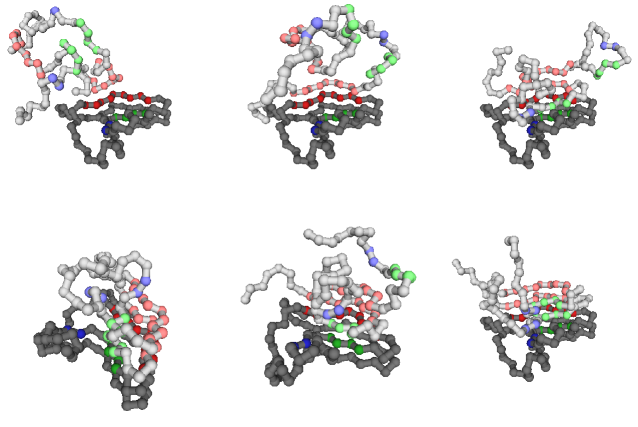
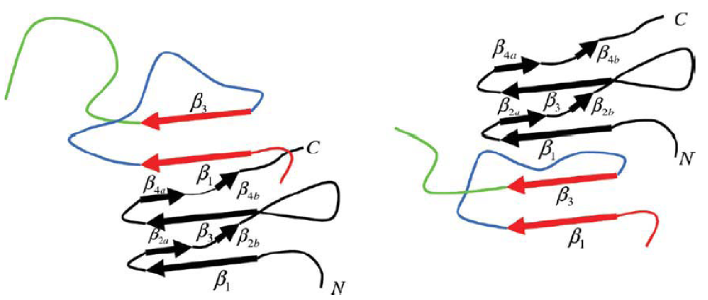
When elongation proceeds from the top side, the attaching chain wraps up onto the fibril tip starting with its N-terminal part (see Fig. 10). The ‘loop’ strands and (fibrillar) need to be positioned before the ‘tail’ ones and (intra-chain), consistently with the topological order suggested above. Indeed we do observe this hierarchy for top side elongation; even at low temperature intra-chain hydrogen bonds between the short strand pairs are not yet stable.
When elongation proceeds from the bottom side, the attaching chain wraps up onto the fibril tip starting with the C-terminal part (see Fig. 10). The ‘tail’ strands and (fibrillar) need now to be positioned before the ‘loop’ ones and (intra-chain). Elongation order takes over the topological order so that the difficult positioning of ‘tail’ strands is assisted by the easier positioning of ‘loop’ strands and both are stabilized at room temperature (with the partial exception of the shortest strand ).
IV Discussion
In this work we have used Monte-Carlo simulations of a coarse-grained representation of HET-s PFD domain in order to get information about the elongation of the corresponding amyloid fibril by attaching of a mobile chain to a pre-fixed fibrillar structure. Our approach, based on the knowledge of the fibrillar structure, relies on the currently well accepted assumption that protein topology plays a pivotal factor in determining unimolecular folding and protein assembly. At variance with other Go-like studies Ding et al. (2002); Jang et al. (2004), based on a hypothetical structure, the reliability of our study is justified by the knowledge of a high-resolution NMR structure of a plausibly functional amyloid fibril.
There are two main results of our thermodynamic study. First, we observe that fibril elongation is driven by the formation of inter-chain and intra-chain hydrogen bonds between the long strands and , followed by the positioning of the rest of the attaching chain onto the growing fibril. This mechanism is known as dock and lock mechanism Esler et al. (2000); O’Brien et al. (2009). We identify the docking stage as that part of the association process whose onset temperature displays a concentration dependance. A similar feature, i.e. the docking temperature range varies with concentration, was previously found in a thermodynamic study of A-peptide fibril growth Takeda and Klimov (2009). Within our Go-like approach, we find a complex multistage association process, where both the docking and the locking stages proceed in several steps in a free energy landscape characterized by several different minima separated by barriers. In the case of A-peptide fibril elongation, it was found on the contrary that docking is continuous and proceeds without the presence of intermediate or free energy barriers Takeda and Klimov (2009). Our finding of a multistage docking behaviour might be due to the non-trivial intra-chain topology of HET-s PFD monomer, lacking in the A-peptide case. Alternatively, it might be an artifact caused by our neglecting of non-native interactions.
Secondly, we predict that one side of the structure is more suitable to substain the growth of the fibril.
The predicted fibril growth polarity can be rationalized by analyzing elongation topological properties, which turn out to be intrinsically different from the two fibril sides. The argument is based on the complex tertiary structure of the monomeric unit within HET-s fibril, resulting into alternating intra- and inter-chain pairs of -strands. After the first hydrogen bonds have been formed in the initial docking onto the growing fibril, the portion of the attaching chain which is going to acquire -structure in the following locking stage, is partitioned into a ‘loop’ and a ‘tail’ part (see Fig. 10). As a consequence, the entropy loss of the two parts upon locking is different, implying a ‘topological’ hierarchy. The latter may or may not be affected by the ‘winding’ hierarchy dictated by the choice of the growth side, thus resulting in a strong growth polarity. Bottom side elongation is more sustainable because the ‘loop’ part may assist the ‘tail’ part to lock. The entropic origin of the growth polarity observed in our results is further confirmed by the free energy profiles shown in Fig. 9. As discussed in section III.4, the macrostate populated after docking and before locking (with inter-chain and intra-chain hydrogen bonds) is entropically stabilized in the top elongation mode with respect to bottom elongation.
Being based on a topological argument, we believe our prediction to be robust against both variations of the details in the implementation of our Go-like approach (changing the coarse-graining of protein chain representation, employing in the energy function general pairwise contacts and not only hydrogen bonds, using different hydrogen bond rules) and relaxation of other simplifying assumptions that we made, namely the fibril tip is represented by just one chain and kept completely frozen. This latter point is further motivated by the experimental observation Sabaté et al. (2009) that the HET-s fibril accomodates incoming prion monomers without a substantial disorganization of its structure. This behaviour is quite different from those of A fibrils where it was experimentally observed Kusumoto et al. (1998) an entropy gain in the elongation reaction which was related to an unfolding of the organized fibril end to accomodate the addition of the incoming monomers.
We thus suggest our prediction may be accessible to experimental validation, for instance using the single fiber growth assay employed in DePace and Weissman (2002) for SUP35 yeast prion, based on two variants of the prion domain that can be differentially labelled and distinguished by atomic force microscopy.
The same topological argument cannot be used for simpler amyloid structure such as the solid state NMR-model suggested for the Alzheimer’s -peptide Petkova et al. (2002), in the absence of intra-chain hydrogen bonds. In fact, experimental evidence shows bidirectional fibril growth with no clear signs of growth polarityBlackley et al. (2000). Interestingly, the presence of asymmetrical topological properties of fibril ends was indeed suggested for the -peptide Fawzi et al. (2007); Takeda and Klimov (2009), depending on the different possible quaternary arrangements of the fibril Petkova et al. (2006). On the other hand, a clear evidence of growth polarity was demonstrated for SUP35 fibrils DePace and Weissman (2002), a yeast prion protein believed to have a functional role, similarly to HET-s prion. There is no high-resolution information on the structure of SUP35 fibrils and different conflicting structural models have been recently proposed Krishnan and Lindquist (2005); Shewmaker et al. (2006), yet some of the available data suggests the existence of a complex intra-chain structure Tessier and Lindquist (2009), which could justify the observed growth polarity within a framework similar to the one we propose here for HET-s.
A peculiar feature of HET-s PFD is the presence of a long loop in the fibrillar structure that connects strands and (aa 246-260), which then contributes to increasing the length of the chain portion partitioned as ‘loop’ in the topological argument discussed above (in blue in Fig. 10). An interesting question is whether increasing such length favours or disfavours growth polarity according to the mechanism suggested here. One could argue that a longer loop may further decrease the fluctuations available to the ‘tail’ part, thus enhancing its assisted locking for bottom side elongation. Indeed, it is known that a large deletion in such loop (248-256) led to loss of HET-s function and infectivityRitter et al. (2005). Even though no evidence is known about the possible biological relevance of fibril growth polarity in fungal and yeast prions, it is tempting to speculate that the role of the loop might be to enhance growth polarity as a way to control the elongation process more thoroughly in the context of the propagation of a functional prion. Numerical simulations performed within the same Go-like approach, based on a model structure to be built on the basis of HET-s PFD but with a shorter loop, will shed further light on this hypothesis.
Our coarse-grained approach turned out to be effective in studying structural rearrangements which could not be tackled using more detailed protein chain representations. On the other hand, we are neglecting factors which may play an important role in the elongation process, such as the possible presence of oligomeric conformers of HET-s PFD in the non-fibrillar soluble state Sabaté et al. (2009). In order to capture similar effects, one needs to increase the accuracy of the energy function by introducing amino-acid specificity. This can be done by using coarse-grained potentials which take into account the different ability of each pair of amino-acids in forming hydrogen bonds in -strands Trovato et al. (2006, 2007), coupled with similar potentials describing residue pairwise interactions Miyazawa and Jernigan (1996) or local conformational biases Fang and Shortle (2005). Such potentials might be used to modulate the Go-like energy function presented in this work. The use of a more realistic description of the protein chain involving side chain atoms may also cause the amino-acid sequence to affect the elongation process in a side-depending manner by imposing chiral stereochemical constraints. The latter are not present in our Cα-based representation, thus reinforcing the topological origin of growth polarity in our results.
Finally, the approach presented here could be also used to study the nucleation process of HET-s PFD, and further extended to study the aggregation of the full HET-s protein. The HET-s N-terminal domain in the non-fibrillar soluble form is structured into a globular protein fold whose high-resolution structure has been very recently releasedGreenwald et al. (2010) (PDB code 2wvn.pdb). Such structure is known to lose partially its order upon ordering and aggregation of HET-s PFD into the unsoluble fibrillar form Wasmer et al. (2009). A Go-like approach would be especially suited to study the resulting competition between the ordered structures of the two domains in the two different forms Zamparo et al. (2010).
Acknowledgements.
We thank F. Chiti and R. Riek for enlightening discussions. We acknowledge financial support from University of Padua through Progetto di Ateneo n. CPDA083702.References
- Aguzzi et al. (2008) A. Aguzzi, C. Sigurdson, and M. Heikenwaelder, Annu. Rev. Phatol. 3, 11 (2008).
- Prusiner (1982) S. Prusiner, Science 216, 136 (1982).
- Wells et al. (1987) G. Wells, A. Scott, C. Johnson, R. Gunnig, R. Hancock, M. Jeffrey, M. Dawson, and R. Bradley, Veterinary Record 121, 419 (1987).
- Will et al. (1996) R. Will, J. Ironside, M. Zeidler, S. Cousens, K. Estibiero, A. Alperovitch, S. Poser, M. Pocchiari, A. Hofman, and P. Smith, Lancet 347, 921 (1996).
- Tuite and Serio (2010) M. Tuite and T. Serio, Nat. Rev. Mol. Cell. Biol. 11, 823 (2010).
- Lange and Meier (2008) A. Lange and B. Meier, Comptes Rendue Chemie 11, 332 (2008).
- Saupe (2000) S. Saupe, Microbiol. Mol. Biol. Rev. 64, 489 (2000).
- Baulgerie et al. (2003) A. Baulgerie, S. D. Reis, C. Ritter, B. C.-S. S. Chaignepain, V. Forge, K. Bathany, I. Lascu, J. Schmitter, R. Riek, and S. Saupe, EMBO J. 22, 2071 (2003).
- Ritter et al. (2005) C. Ritter, M. Maddelein, A. Simmer, T. Luhrs, M. Ernst, B. Meier, S. Saupe, and R. Riek, Nature 435, 844 (2005).
- Wasmer et al. (2008) C. Wasmer, A. Lange, H. V. Melckebe, A. Siemer, R. Riek, and B. Meier, Science 319, 1523 (2008).
- Castellani et al. (2002) F. Castellani, B. van Rossum, A. Diehl, M. Schubert, K. Rehbein, and H. Oschkinat, Nature 420, 98 (2002).
- Lange et al. (2005) A. Lange, S. Becker, K. Seidel, K. Giller, O. Pongs, and M. Baldus, Angew. Chem. Int. Ed. 44, 2441 (2005).
- Baumketner and Shea (2007) A. Baumketner and J. Shea, J. Mol. Biol. 366, 275 (2007).
- Buchete and Hummer (2007) N. Buchete and G. Hummer, Biophys. J. 92, 3032 (2007).
- Cecchini et al. (2006) M. Cecchini, R. Curcio, M. Pappalardo, R. Mekl, and A. Caflisch, J. Mol. Bio. 357, 1306 (2006).
- Huet and Derremaux (2006) A. Huet and B. Derremaux, Biophys. J. 91, 3829 (2006).
- Ma and Nussinov (2006) B. Ma and R. Nussinov, Curr.Opin. Chem. Biol. 10, 445 (2006).
- O’Brien et al. (2009) E. O’Brien, Y. Okamoto, J. Straub, B. Brooks, and D. Thirumalai, Journal of Physical Chemistry B 113, 14421 (2009).
- Tarus et al. (2006) B. Tarus, J. Straub, and D. Thirumalai, J. Am. Chem. Soc. 128, 16159 (2006).
- Reddy et al. (2009) G. Reddy, J. Straubb, and D. Thirumalai, Proc. Natl. Acad. Sci. USA 106, 11948 (2009).
- Takeda and Klimov (2010) T. Takeda and D. Klimov, J. Phys. Chem. B 114, 4755 (2010).
- Wei et al. (2010) G. Wei, A. Jewett, and J. Shea, Phys. Chem. Chem. Phys. 12, 3622 (2010).
- Hardy and Selkoe (2002) J. Hardy and D. Selkoe, Science 297, 353 (2002).
- Esler et al. (2000) W. Esler, E. Stimson, H. V. J.J. Jennings, J. Ghilardi, J. Lee, P. W. Mantyh, and J. Maggio, Biochemistry 39, 6288 (2000).
- Cannon et al. (2004) M. Cannon, A. Williams, R. Wetzel, and D. Myszka, Anal. Biochem. 328, 67 (2004).
- Straub and Thirumalai (2010) J. Straub and D. Thirumalai, Current Opinion in structural biology 20, 187 (2010).
- Takeda and Klimov (2009) T. Takeda and D. Klimov, Biophys. J. 96, 442 (2009).
- Lange et al. (2009) A. Lange, Z. Gattin, H. van Meleckebeke, C. Wasmer, A. Soragni, W. van Gunsteren, and B. Meier, ChemBioChem 10, 1657 (2009).
- Sabaté et al. (2009) R. Sabaté, V. Castillo, A. Espargaró, S. Saupe, and S. Ventura, FEBS J. 276, 5053 (2009).
- Auer and Kashiev (2010) S. Auer and D. Kashiev, Proteins-Structure Function and Bioinformatics 78, 2412 (2010).
- Auer et al. (2009) S. Auer, A. Trovato, and M. Vendruscolo, Plos Computational Biology 5, e1000458 (2009).
- Hoang et al. (2006) T. Hoang, L. Marsella, A. Trovato, F. Seno, J. Banavar, and A. Maritan, Proc. Natl. Acad. Sci. USA 103, 6883 (2006).
- Borroguero et al. (2005) J. Borroguero, B. Urbanc, N. Lazo, S. Buldyrev, D. Teplow, and H. Stanley, Proc. Natl. Acad. Sci. USA 102, 6015 (2005).
- Favrin et al. (2004) G. Favrin, A. Irback, and S. Mohanty, Biophys. J. 87, 3657 (2004).
- Fawzi et al. (2005) N. Fawzi, V. Chubukov, L. Clark, S. Brown, and T. Heat-Gordon, Protein Sci. 14, 993 (2005).
- Nguyen and Hall (2006) H. Nguyen and C. Hall, J. Am. Chem.Soc. 128, 1890 (2006).
- Urbanc et al. (2004) B. Urbanc, L. Cruz, F. Ding, D. Sammond, S. Khare, S. Buldyrev, H. Stanley, and N. Dokholyan, Biophys. J. 87, 2310 (2004).
- Wei et al. (2004) G. Wei, N. Mousseau, and P. Derreumaux, Biophys. J. 87, 3648 (2004).
- Lam et al. (2008) A. Lam, D. B. Teplow, H. Stanley, and B. Urbanc, J. Am. Chem. Soc. 130, 17413 (2008).
- Rojas et al. (2010) A. Rojas, A. Liwo, D. Browne, and H. Scheraga, J. Mol. Biol. 404, 537 (2010).
- Urbanc et al. (2010) B. Urbanc, M. Betnel, L. Cruz, G. Bitan, and D. Teplow, J. Am. Chem. Soc. 132, 4266 (2010).
- Go and Scheraga (1976) N. Go and H. Scheraga, Macromolecules 9, 535 (1976).
- Alm and Baker (1999) E. Alm and D. Baker, Current Opinion in Structural Biology 9, 189 (1999).
- Baker (2000) D. Baker, Nature 405, 39 (2000).
- Clementi et al. (2000) C. Clementi, H. Nymeier, and J. Onhucic, J. Mol. Biol. 298, 937 (2000).
- Hubner et al. (2004) I. Hubner, M. Oliveberg, and E. Shakhnovich, Proc. Natl. Acad. Sci. USA 101, 8354 (2004).
- Lam et al. (2007) A. Lam, J. Borreguero, F. Ding, N. Dokholyan, S. Buldyrev, H. Stanley, and E. Shaknovich, J. Mol. Biol. 373, 1348 (2007).
- Levy et al. (2005) Y. Levy, S.S.Cho, J. Onuchic, and P. Wolynes, J. Mol. Biol. 346, 1121 (2005).
- Micheletti et al. (1999) C. Micheletti, J. Banavar, A. Maritan, and F. Seno, Phys. Rev. Lett. 82, 3372 (1999).
- Sulkowska et al. (2009) J. Sulkowska, P. Sulkowski, and J. Onuchic, Proc. Natl. Acad. Sci. USA 106, 3119 (2009).
- Ding et al. (2002) F. Ding, N. Dokholyan, S. Buldyrev, H. Stanley, and E. Shaknovich, J. Biol. Mol. 324, 851 (2002).
- Jang et al. (2004) H. Jang, C. Hall, and Y. Zhou, Biophys. Journal 86, 31 (2004).
- Bryngelson and Wolynes (1987) J. Bryngelson and P. Wolynes, Proc. Natl. Acad. Sci. USA 84, 7524 (1987).
- Greenwald et al. (2010) J. Greenwald, C. Buthz, C. Ritter, W. Kwiatkowski, S. Choe, M. Maddelein, F. Ness, S. Cescau, A. Soragni, D. Leitz, et al., Molecular Cell 38, 889 (2010).
- Blackley et al. (2000) H. Blackley, G. Sanders, M. Davies, C. Roberts, S. Tendler, and M. Wilkinson, J. Mol. Biol. 298, 833 (2000).
- DePace and Weissman (2002) A. DePace and J. Weissman, Nat. Struct. Biol. 9, 389 (2002).
- Fawzi et al. (2007) N. Fawzi, Y. Okabe, E.-H.Yap, and T. Head-Gordon, J. Mol. Biol. 365, 535 (2007).
- Hoang et al. (2004) T. Hoang, A. Trovato, F. Seno, J. Banavar, and A. Maritan, Proc. Natl. Acad. Sci. USA 101, 7960 (2004).
- Tesi et al. (1996) M. Tesi, E. vanRensburg, E. Orlandini, and S. Whittington, J. Stat. Phys. 82, 155 (1996).
- Metropolis et al. (1953) N. Metropolis, A. Rosenbluth, M. Rosenbluth, A. Teller, and E. Teller, J. Chem. Phys. 21, 87 (1953).
- Wang and Landau (2001) F. Wang and D. Landau, Phys. Rev. Lett. 86, 2050 (2001).
- Kusumoto et al. (1998) Y. Kusumoto, A. Lomakin, D. Teplow, and G. Benedek, Proc. Natl. Acad. Sci. USA 95, 12277 (1998).
- Petkova et al. (2002) A. Petkova, Y. Ishii, J. Balbach, O. Antzutkin, D. Gordon, S. Meredith, and R. Tycko, Proc. Natl. Acad. Sci. USA 99, 16742 (2002).
- Petkova et al. (2006) A. Petkova, W.-M. Yau, and R. Tycko, Biochem. 45, 498 (2006).
- Krishnan and Lindquist (2005) R. Krishnan and S. Lindquist, Nature 447, 453 (2005).
- Shewmaker et al. (2006) F. Shewmaker, R. Wickner, and R. Tycko, Proc. Natl. Acad. Sci. USA 103, 19754 (2006).
- Tessier and Lindquist (2009) P. Tessier and S. Lindquist, Nat. Struct. Mol. Biol. 16, 598 (2009).
- Trovato et al. (2006) A. Trovato, F. Chiti, A. Maritan, and F. Seno, Plos Computational Biology 2, 1608 (2006).
- Trovato et al. (2007) A. Trovato, F. Seno, and S. Tosatto, Protein Engineering Design and Selection 20, 521 (2007).
- Miyazawa and Jernigan (1996) S. Miyazawa and R. L. Jernigan, J. Mol. Biol. 256, 623 (1996).
- Fang and Shortle (2005) Q. Fang and D. Shortle, Proteins 60, 90 (2005).
- Wasmer et al. (2009) C. Wasmer, A. Shutz, A. Loquet, C. Buhtz, J. Greenwald, R. Riek, A. Bockmann, and B. Meier, J. Mol. Biol. 319, 1523 (2009).
- Zamparo et al. (2010) M. Zamparo, A. Trovato, and A. Maritan, Phys. Rev. Lett. 105, 108102 (2010).
Table Legends
| top side elongation | ||||||
| 115 | 85 | 64 | 43 | 12 | -1 | |
| 88 | 71 | 63 | 44 | 11 | -2 | |
| 75 | 70 | 62 | 43 | 8 | -3 | |
| bottom side elongation | ||||||
| 108 | 80 | 50 | 42 | 45 | 6 | |
| 85 | 68 | 47 | 40 | 43 | 7 | |
| 65 | 63 | 50 | 41 | 44 | 6 | |