Unconventional RF Photo-Response from a Superconducting Spiral Resonator
Abstract
Superconducting thin film resonators employing strip geometries show great promise in /microwave applications due to their low-loss and compact nature. However, their functionality is limited by non-linear effects at elevated /microwave powers. Here, we show that by using a planar spiral geometry carrying parallel currents in adjacent turns, this limitation can be minimized. We investigate the current distributions in spiral resonators implemented with Nb thin films via Laser Scanning Microscopy. The current density profile along the width of the individual turns of the resonators reveals an unconventional trend: maximum current in the middle of the structure and decaying towards its edges. This unusual behavior is associated with the circular nature of the geometry and the cancellation of magnetic field between the turns, which is favorable for handling high powers since it allows the linear characteristics to persist at high current densities.
pacs:
74.25.N-, 74.81.-g, 74.62.Dh, 74.25.nn, 74.70.-bI INTRODUCTION
Superconducting thin film /microwave resonators play a prominent role in many applications including quantum computing Schoelkopf ; Bialczak , single photon detection Goltsman , bifurcation amplifiers Metcalfe along with the quest to develop novel devices Burke ; Mazin and media such as metamaterials KurterAPL ; KurterEIT ; AnlageJOpt . However, superconductors show nonlinear response when driven strongly by signals/microwaves Samoilova ; Hein ; Ghigo ; Ku , that manifests itself with a significant dependence of the surface resistance and reactance on the input power Chin ; OatesPRL ; WosikIEEE ; KurterNonlin , . It is important to find an effective way to keep the resonant characteristics linear for a long range of to maximize the power handling capability of the resonators and expand their range of applicability.
Many superconducting resonators generally employ planar geometries made up of finite-width thin strips to carry a longitudinal high frequency current. The magnetic fields generated by flowing currents along the strips have a common characteristic of being perpendicular to the edges of the strip. Such a field configuration poses a challenge to the superconductor. In order to remain in the Meissner state, the strip must generate strong diamagnetic shielding currents to screen the perpendicular magnetic field from its interior. This gives rise to a large current build-up at the edges of a superconducting film shaped into a strip-geometry resonator RicciIEEE ; ZhuravelAPL06 . Screening currents can approach or exceed the critical current at the edges leading to a local breakdown of superconductivity and the onset of nonlinear behavior ZhuravelIEEE07 . Therefore, the microwave properties of superconducting resonators are strongly dependent on the geometry of the design KurterNonlin .
Apart from simple single strip-lines, co-planar waveguides GhigoAPL ; ZhuravelAPL06 , hairpin Willemsen and meander-line resonators ZhuravelJAP are other planar designs based on strip geometries. Many of these designs include parallel conductors where the currents in neighboring strips flow in opposite directions, see Fig. 1(a). This causes the induced normal oriented magnetic fields to be enhanced between the strips, and in turn results in an accumulation of screening currents at the edges. Such an inhomogeneous current density, can create changes in the superconducting properties of the film, therefore limiting the functionality of the superconducting resonator by leading to non-linearity in its response even at low stimulus.
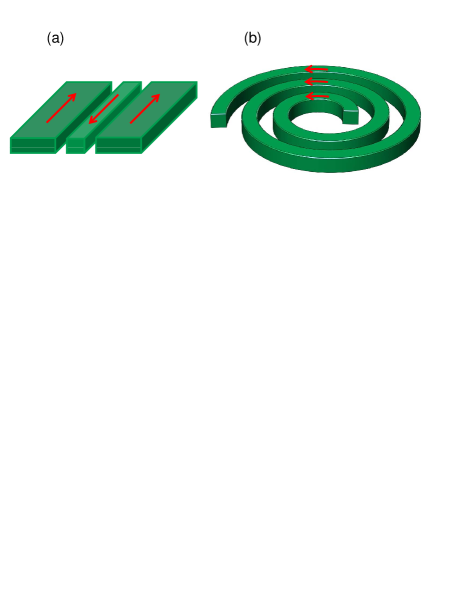
Here we consider a unique resonator in the form of a continuous planar spiral designed to generate a strong electromagnetic response below 100 MHz. The spirals are intended to be deep sub-wavelength meta-atoms of a metamaterial which could be utilized, e.g., in magnetic resonance imaging applications as compact and low loss flux guides Wiltshire ; KurterIEEE . The resonators have a superior geometry in which the currents flowing in neighboring strips are in the same direction and approximately equal in magnitude, at least for the first few resonant modes, see Fig. 1(b). The perpendicular components of the induced magnetic fields largely cancel in the region between the windings, leading to a magnetic field pattern mainly parallel to the plane of the strips. This renders the distribution of total current density to be relatively uniform within the sample compared to the anti-parallel current case discussed above, eliminating current build-up at the edges of the windings. This kind of configuration maintains the linear characteristics at elevated excitation power, and can be a better candidate in applications requiring linear /microwave response.
We have applied the spatially-resolved technique of low-temperature Laser Scanning Microscopy () to map current distributions globally (on the entire sample) and locally (in an individual winding) on spiral resonators made of Nb thin films. From the two dimensional (2D) images of the spirals excited at the fundamental resonance we have observed an unconventional current pattern with the absence of a build-up at the edges of the turns until a critical power value is reached. The evolution of the current distribution with increasing has been examined to investigate the power handling capability of these resonators.
The technique has various contrast modes for imaging ZhuravelLTP . Here, we have utilized only two of them: optical reflectivity and ordinary high-frequency photoresponse modes. As was demonstrated in previous works ZhuravelAPL06 ; ZhuravelIEEE07 , the response of the ordinary high-frequency photoresponse mode is a superposition of two components; inductive and dissipative/resistive responses. Both generally require the superconducting sample to show a nonlinear response under laser irradiation. At low values, only laser heating plays a significant role in the nonlinearity, however once the power is elevated, extra dissipation mechanisms will be added due to heating. Such a response in superconductors well below their critical temperature, is mainly attributed to the formation of local dissipative (non-superconducting) domains where may exceed the local critical current density, . The superconducting state is extremely sensitive to variations in the superfluid density that changes either with temperature or magnetic field, hence nonlinearity is inevitable KurterNonlin . The effect manifests itself globally as distortion and/or bistable switching in the resonant transmission as a function of frequency, , at some microwave powers Ghigo ; Ku ; KurterNonlin ; Brenner due to increased absorption of microwave radiation by quasi-particles.
II Sample
The measurements presented in this paper use planar spiral resonators fabricated with 200 nm Nb thin films sputtered onto 350 thick single crystal quartz substrates. Photolithography and reactive ion etching (:, 90:10) are applied to give a spiral shape to the thin film. The of the Nb film (9.2 K) is obtained from resistance vs temperature measurements KurterIEEE . Below the of Nb, the microwave surface resistance, of the film will be very small (about at and ) Pambianchi94 .
Each spiral is made up of 40 turns, has an outer diameter of 6 mm and an inner diameter of 4.4 mm. The windings in the spirals and the spacing between them are of 10 width. Prior results show that the spirals act as very compact self-resonant strips, supporting up to 10 half-wavelength standing waves of current along their length KurterIEEE .
III RF Excitation
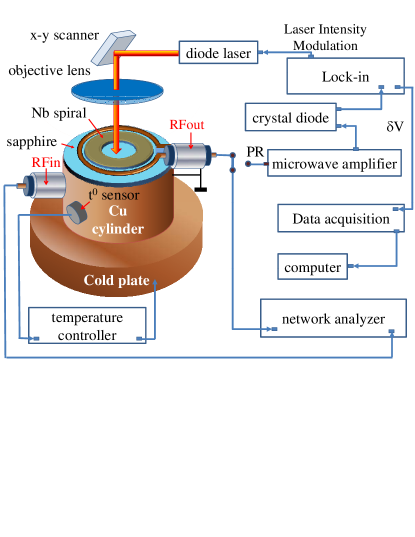
A single spiral resonator is placed on a sapphire disk plate (50 mm in diameter, 2 mm in thickness) where a thermometer is attached nearby, in a cryogenic environment. The sample is stimulated with power applied via two coaxial cables terminated by shorted loops at the end with a diameter slightly larger than the outer diameter of the spiral as shown in Fig. 2. The planes containing the excitation ( in) and the pickup loops ( out) are parallel and the two loops are placed sandwiching the sample between them KurterAPL . The sample temperature is controlled with a heater located on the Cu cylinder on the cold head supporting the sapphire plate. The global resonant response was characterized with transmission measurements at different power levels between = -30 dBm and +30 dBm and at a bath temperature of = 4.5 K using a Microwave Vector Network Analyzer (Anritsu MS4640A). From these measurements, the fundamental resonant frequency is found to be 74 MHz, followed by higher harmonics.
IV Cryogenics
Cooling the spiral samples in the range 4.5 K takes place inside the vacuum cavity of a variable temperature optical cryostat. The temperature of the cold Cu cylinder below the sample (50 mm in outer diameter with a 5 mm thick wall), see Fig. 2, is stabilized with an accuracy of 1 mK. The cylinder temperature is controlled with a bifilar coil heater connected to the temperature controller and wound around the cold Cu plate having the same temperature as the cylinder. This Cu cylinder also cools both coaxial cables to eliminate a possible temperature gradient with the sample. The top surface of the sample faces the laser probe while the bottom surface is temperature stabilized by gluing it to the sapphire disk with cryogenic vacuum grease, assuring a reliable thermal heat sink. The same grease is used on the thermally conducting interface between the sapphire and Cu cylinder.
V Laser Scanning Microscopy (LSM)
For imaging, the spirals are excited by signals, (while being kept well below the of Nb) and illuminated by a focused laser beam acting as a non-contact optical probe. The photoresponse dominantly comes from thermally-induced changes in the transmission characteristics of the spiral due to absorption of the laser light with a wavelength of 670 nm. The smallest diameter of the laser probe spot is 1.5 when a 20x magnification (NA=0.42) objective lens is used for detailed imaging (scan area up to 250x250 ). Large scale (up to an area of 50x50 ) images are acquired with an f-theta objective lens creating a 20 diameter laser illuminated spot. The intensity of the laser is modulated at a frequency of 100 kHz creating an oscillating thermal and/or optical probe. Changes in due to the laser heating are synchronously detected with a lock-in amplifier.
In the bolometric (thermal) regime, the (/) due to local temperature change , can be uniquely decomposed into inductive and resistive components. ZhuravelAPL06 The inductive photoresponse, is proportional to , where is the area heated by the laser spot and is the local value of the penetration depth at position and can be interpreted as arising from the changes in penetration depth, induced by the laser heating. When and have uniform values, the has a profile proportional to the local value of current density squared, . The resistive photoresponse, arises from thermally caused changes in the local resistance of the sample and is a convolution of the laser modulated surface resistance, weighted by the local value of .
In non-equilibrium (non-thermal) mode, the main mechanism of the contrast is the following. Below , the absorbed portion of laser power, causes nonequilibrium changes in the quasiparticle population, , resulting from the high-energy excitation of the superconducting film by individual optical photons with an energy of = 1.85 eV where is the superconducting energy gap of Nb, is Planck’s constant, and is the laser (irradiation) frequency. Because of electron-electron and electron-phonon scattering as well as direct Stokes-like depairing (with continuous frequency spectrum ), every high-energy quasiparticle is capable of producing an extra population of low-energy excitations, = /, where is the quantum efficiency and smaller than 1. The excess quasiparticles create a non-equilibrium superconducting state due to the reduced superfluid density beneath the laser probe. As a result, local changes in cause modifications in the surface impedance = due to as well as photoinduced changes in local kinetic inductance, . Here, = is the radial coordinate on the sample surface relative to the position of the laser probe focus.
We observe that the Nb samples do not show any significant inductive photoresponse, at temperatures well below . While increasing both and/or laser power, it has been found that resistive photoresponse, is produced at a lower critical power, corresponding to the first local switching of the sample into the nonlinear regime. The first detectable resistive component of can be written as
| (1) |
for a condition of combining the effects of the local microwave field (first term) and suppression of the critical current by the laser beam (second term).
It has been shown in the literature (see, for instance, Refs. Zharov ; KurterNonlin ) that the first nonlinear distortion of appears as a deviation where the curves fall on to curves with smaller quality factor, , in a narrow-band near the resonant frequency (with exceeding ). In the case of a small optical probe perturbation , the resistive component of may be undetectable outside this narrow band, while strong signals are generated inside the band.
The work presented here follows a modified procedure originally developed in Ref. ZhuravelIEEE07 which is based on the insertion loss component of the photoresponse, , rather than and measured at a frequency in the vicinity of . At a fixed frequency and spatially independent laser probe perturbation, the is proportional to the laser-beam-induced changes in resonator transmission, that can be expressed in a form close to that introduced in Ref. ZhuravelMSMW .
| (2) |
where the transmission coefficient, [ratio of the transmitted power, , to the input power, ] as a function of driving frequency is given in the limit of weak coupling by Petersan
| (3) |
and is the maximum of the transmission coefficient at the peak of the resonance. By substitution of Eq. 3 in Eq. 2, one finds that the inductive
| (4) |
and the resistive
| (5) |
components of total are nulled at , while the insertion loss component
| (6) |
is peaked at .
In terms of local photo induced changes, is directly linked with Ohmic dissipation generated by the laser probe at position , ZhuravelMSMW2010 ; Culb
| (7) |
In the frame of the paradigm described in Ref. ZhuravelIEEE07 (in the case of a linear response function and a small probe perturbation) for a strip geometry oriented along the path in the direction, the change in surface resistance due to a change in local critical current [] at a specific laser probe position may be described as
| (8) |
for large scale imaging mode () where is the path along the entire spiral with total length of , is the width of the film, is the circulating power in the resonator and is the characteristic healing length describing spatial decay of at a distance outside the intense beam focus.
As was postulated in Ref Gross , one can assume that both quantities / and / are invariable in the probed sample area if , and are spatially uniform through the whole resonator structure. Combining Eq. 7 with the integral value of Eq. 8 over the laser probe profile leads to
| (9) |
at location in the one dimensional strip geometry.
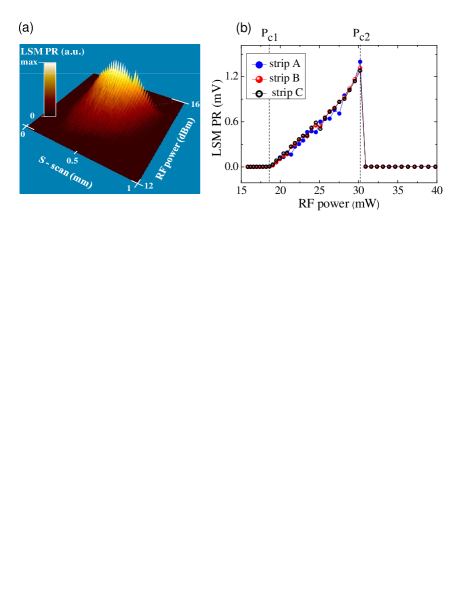
Note that Eq. 9 demonstrates a threshold mechanism of generation relative to excitations by both and . In the undercritical state of the superconducting structure at , the value of / is zero at any position of the laser probe. In this case there is no detectable by the technique at in microwave imaging mode. In addition, very weak response is observed in purely normal regions of the sample. A detectable signal is generated only in the narrow range of power between and (upper critical power). Note that (see Fig. 4b) denotes the total () power initiating the first local dissipative source that destroys superconductivity. By we denote the power of this source giving rise to normal state switching. As seen from Eq. 9, is proportional to in this range and spatial variations of amplitude directly show the distribution of along that part of the standing wave that generates an overcritical state in the superconducting strips. Any deviation of from the shape of a sinusoidal standing wave pattern then gives evidence for an inhomogeneous distribution of due to the term / in Eq. 9. Also, it is clear that manipulations by both and may be used to probe local values of as either or is increased.
In the case of 2D probing (characteristic length of the laser-probe induced non-equilibrium state, strip width, W), the main imaging mode results from laser probe induced redistribution of the microwave current around the illuminated area. This effect leads to additional Ohmic dissipation in the nearby unilluminated areas of the superconducting strip generating
| (10) |
The effect is linked with the laser-induced modulation of the local critical current,
| (11) |
underneath the laser probe allowing direct measurement of . Here, / if and are independent of the beam position. Larger critical current densities produce larger as a result of redistribution of through the cross-section of the undercritical currents of width , thus increasing the averaged flowing there. Here denotes the width of the critical region.
As one can see from Eq. 10, the highest microwave current densities produce the largest resulting in quantitative profiles of in the area of the laser beam raster on the superconductor surface.
VI GLOBAL PHOTORESPONSE RESULTS
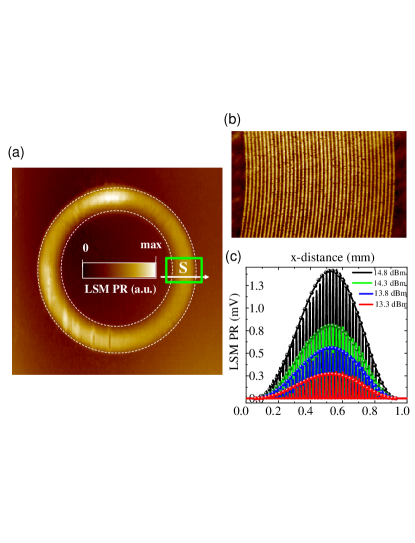
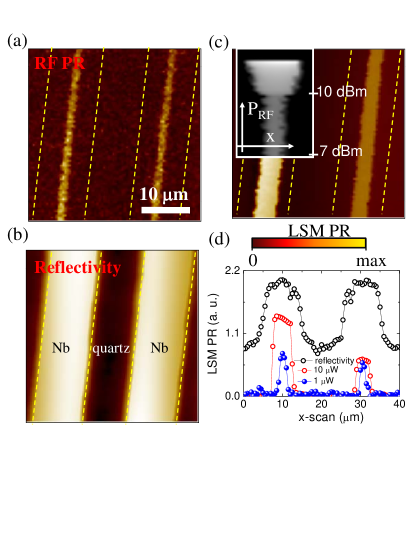
To characterize the resilience of the superconducting spiral resonators at high , it is important to examine how current is distributed in the entire sample when driven by strong signals. Fig. 3(a) is a 2D image showing the global photoresponse of a Nb spiral excited at its fundamental resonant mode of 74 MHz. The laser is scanned over a 7.6 x 7.6 area at = 4.5 K, = 14.8 dBm and 1 laser power. The contrast in the image is mainly produced by where the bright areas can be interpreted as to first approximation, and illustrates a mode in which a single half-wavelength of standing wave current spans the length of the spiral. As seen, current mainly flows in the middle windings in a quite uniform way, and diminishes towards the inner and outer edges of the spiral. Fig. 3(b) is a 2D reflectivity image of the same spiral and shows the turns in an area on the spiral shown with the green box in (a).
The evolution of the coming from the individual windings along the cross section of the spiral [marked as S in (a)] is shown in Fig. 3(c) for four different values and reveals the distribution in greater detail; note that the maximum corresponds to the center of the S cut line, and the ends show no response, confirming what is seen in (a). The asymmetric shape of the standing wave profile in the fundamental mode is understood from the fact that the spiral turns at larger radius have a greater circumference. The dots show the estimated along the cut for the case of a half sinusoid wave wrapped into a spiral. These dots describe well the observed , indicating that the measured distribution is quite similar to the naive interpretation of imaging .
In Fig. 4(a), the individual line-scans of at different incident power levels are shown in a three dimensional (3D) image. Fig. 4(b) shows power-dependent evolution of at three fixed positions of the laser probe coinciding with the centers of three neighboring Nb strips (strips A, B and C) exposed to maximum near the peak of the microwave standing wave. Note that a linear power scale is used. In the purely superconducting or normal states, is not observable [notice the zero at the low and high limits of values in (a)]. As evident from Fig. 4(b), shows an almost linear trend for a long range of nonequilibrium states of the Nb film starting from an corresponding to the first observable at up to a switching to the normal state at = 14.8 dBm where the drops. These observations validate Eq. 9 in explaining our results. Also, one can see that based on the values of , the of all three strips is practically the same, indicating a spatial uniformity in Nb film microstructure.
VII LOCAL PHOTORESPONSE RESULTS
Upon more detailed examination of the Nb resonators, one can see that the is also the strongest at the center of an individual turn forming the spiral, following the same trend of the global behavior shown in Fig. 3. Fig. 5(a) shows 2D of a 40x40 area on the same resonator scanned with a 1.5 diameter laser probe in the fundamental resonant mode of the spiral, a of 4.5 K, and of 7 dBm, and laser power of 1 , while Fig. 5(b) is a reflectivity image obtained from the same area. By comparing the simultaneously measured and reflectivity one finds that the is centered in the windings and does not extend to the edge of the strip. This observation is verified by studying the images as a function of increasing temperature or , and noting that the spreads out laterally in both directions from the center of the strip as the critical temperature and power are approached (see the power evolution of coming from Nb turns in Fig. 5(c); beyond +10 dBm the entire strip starts to show strong resistive response).
The accumulation of in the center of the turns is in contrast with previously published profiles of strip-geometries that show substantial concentration of the at the edges of current-carrying strips ZhuravelAPL02 ; Culb ; ZhuravelJSNM ; ZhuravelLTP . Qualitatively, this fact can be easily understood. Here, the vertical components of magnetic field between the strips are partially cancelled, as discussed above, since adjacent strips have nearly equal and parallel currents (at least in the fundamental mode). The spiral effectively acts like a disk carrying an approximately homogeneous current distribution, in which the current density goes to zero at the inner and outer radii of the disk.
As well as , laser power has an impact on the profile in the spirals. Fig. 5(d) shows the initial depression of by modulated laser power, = 1 in detail (blue curve). The main feature of induced by is generated only inside a very narrow resistive strip, directed along the center of the strip-line. Moreover, no spatial modulation in is visible in the scanned area along the direction of current flow, indicating that the Nb film is quite homogenous, which rules out a structure-related mechanism of hot-spot formation. Taking Eqs. 1 and 10 into account, as well as considering the fact that the laser beam illumination is spatially uniform, one can deduce that current is peaked half way between the Nb strip-line edges reaching local maxima of there. Larger laser power (see the red curve in Fig. 5(d) corresponding to = 10 ) increases the area of the strip in the critical state and consequently adjusts itself accordingly, since in the superconducting state, cannot exceed . Thus, the distribution of spreads all over the strip occupying the dissipative regions of the still superconducting strip.
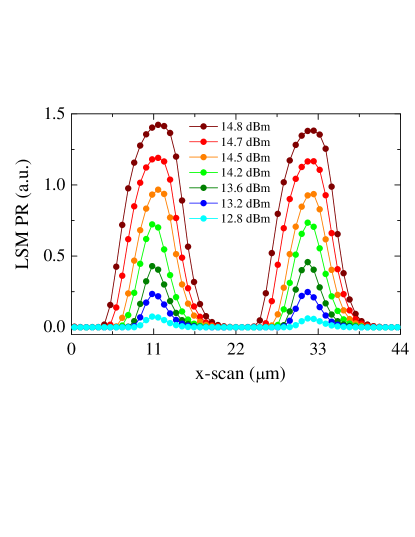
Line-scan profiles across two strips of such spatial evolution of are shown in Fig. 6 as a function of . Small laser probe perturbation (= 1 W ) generates the first observable exactly at the centers of the superconducting strips carrying a current density = at = = 12.8 dBm, described by Eq. 10. Emergence of this signal is linked with the creation of sub-micron critical-state nonequilibrium domains at the centers of the strips, much smaller than the size of the laser probe. The full width half maximum (FWHM) of the position dependent is about 2 (see Fig. 5d and Fig. 6). Further increase in leads to a broadening of the critical state area which results in an increase of the FWHM of the dissipative profiles. With reference to Eq. 10 we see that as increases, the width of the film in the critical state () will increase, forcing more current into the under-critical region () and thus increasing .
Further, we estimate by using the measured . In the inset of Fig. 5(c), there is a sharp transition from a center concentrated strip-like resistive state to an almost uniform resistive state where covers the whole width of the strip. For a wide range of below 10 dBm, the is almost independent of stimulus. We associate this effect with the auto-adjusting of instantaneous circulating to a value which could be accommodated in the superconducting resonator with varying local values of . Considering the absence of visible imperfections in the reflectivity data taken from the same area of this spatial power dependence we can confirm that this transition results from heating effects generated by hot-spot formation at a location far from the scanned line. Thus, this defect-free section of the scan is chosen for rough estimation of the limit for our resonator. Estimation is done based on measurements of generating the first detectable resistive image similar to that shown in Fig. 5(a).
Since the use of smaller laser power is favorable in these measurements in terms of eliminating extra dissipation, we have scanned the spiral surface at = 500 nW and found that 9.5 dBm. There is no observed below this laser power except only at very high . Using measured data [= 8.91 mW (9.5 dBm), = 10 , = 0.2 , = 545.4, = 0.1553, harmonic number = 3 and = 96 which is the characteristic impedance estimated for a co-planar waveguide of similar geometry] and a simple model for homogenous current distribution in the stripline we estimate an upper limit of as Oates
| (12) |
and obtain 2.7 from Eq. 12. This value is more than an order of magnitude smaller than the theoretical estimation for the depairing current density , which is 0.44 at 4.5 K (using = 1.26 for Nb at = 0 K Yu ). This result implies that the measured critical current is limited by factors other than the depairing limit.
VIII HIGHER HARMONICS
We observe that higher order harmonic modes of the Nb spiral resonator have more inhomogeneous current distributions in the windings due to the larger spatial gradients of the current. Moreover, the resonant characteristics of the Nb spiral are more power dependent in those higher modes than the fundamental mode.
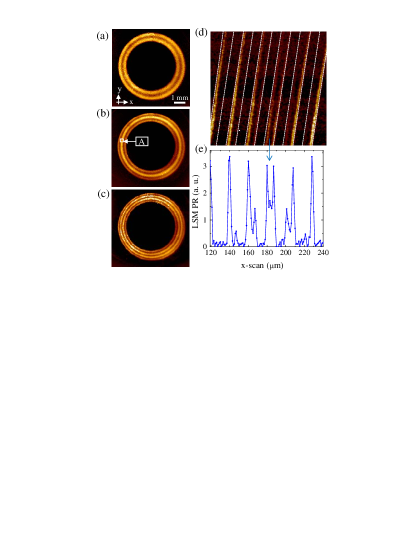
Fig. 7(a)-(c) show in the to harmonic standing wave patterns over a 7x7 area. If we focus on a small area (125x125 ) in the 3rd harmonic image shown in (b), we see a different scenario from that discussed above, Fig. 7(d). In locations where there is a gradient in the current in the radial direction, a more traditional current profile is observed (notice the turn from left in d). Fig. 7(e) shows the profile of this as a function of position in the radial direction. The PR is uniformly distributed across the strip at the peak of the standing wave pattern. However in regions where there is a significant change in the amount of current flowing in neighboring strips, the tends to be concentrated along one edge of the strip. For example on the right hand side of Fig. 7(d) there are decreasing magnitudes of current flowing through the strips to the right. This leads to an asymmetry of the perpendicular magnetic field so that there is a larger field on the left side of each gap compared to the right. This in turn leads to an asymmetric buildup of current on the right side of each strip to screen out the field. The analogous phenomenon occurs on the other side of the peak in the current distribution as the current carried by windings further to the left decrease in magnitude.
We have seen similar effects in the third harmonic standing wave pattern of similar spirals implemented with . Two distinct photoresponse peaks are seen on the edges of the strip. The maximum of the standing wave pattern is visible in the middle strip, and the current decreases to either side.
IX CONCLUSIONS
In conclusion, we have mapped the global and local current profile in planar spiral resonators implemented with superconducting Nb thin films via imaging. The PR analyses reveal that the current in the fundamental mode mainly flows at the center of the turns of the spiral, which is contrary to the profile that is traditionally seen in stripline and coplanar waveguide resonators. The continuous spiral geometry plays an important role in this unusual current profile contrasting with the conventional strip resonator case having anti-parallel currents in adjacent elements where current accumulates at the edges.
ACKNOWLEDGEMENTS
We gratefully acknowledge the contributions of John Abrahams, Tian Lan, Liza Sarytchev, Brian Straughn, and Frederic Sirois. The work at Maryland was supported by ONR Grants No. N000140811058 and No. 20101144225000, the US DOE DESC 0004950, the ONR/University of Maryland AppEl Center, Task D10 (N000140911190), and Center for Nanophysics and Advanced Materials (CNAM). The work in Karlsruhe is supported by the Fundamental Researches State Fund of Ukraine and the German Federal Ministry of Education and Research under Grant No. UKR08/011, the Deutsche Forschungsgemeinschaft (DFG) and the State of Baden-W urttemberg through the DFG Center for Functional Nanostructures (CFN), and a National Academy of Sciences of Ukraine program on Nanostructures, Materials and Technologies. S.M.A. acknowledges sabbatical support from the CFN at Karlsruhe Institute of Technology.
References
- (1) R. J. Schoelkopf and S.M. Girvin, Nature 451, 664 (2008).
- (2) R. C. Bialczak, M. Ansmann, M. Hofheinz, M. Lenander, E. Lucero, M. Neeley, A. D. O’Connell, D. Sank, H. Wang, M. Weides, J. Wenner, T. Yamamoto, A. N. Cleland, and J. M. Martinis, Phys. Rev. Lett. 106, 060501 (2011).
- (3) G. Goltsman, A. Korneev, A. Divochiy, O. Minaeva, M. Tarkhov, N. Kaurova, V. Seleznev, B. Voronov, O. Okunev, A. Antipov, K. Smirnov, Yu. Vachtomin, I. Milostnaya, and G. Chulkova, J. Mod. Opt. 56, 1670 (2009).
- (4) M. Metcalfe, E. Boaknin, V. Manucharyan, R. Vijay, I. Siddiqi, C. Rigetti, L. Frunzio, R. J. Schoelkopf, and M. H. Devoret, Phys. Rev. B 76, 174516 (2007).
- (5) P. J. Burke, R. J. Schoelkopf, D. E. Prober, A. Skalare, W. R. McGrath, B. Bumble, and H. G. LeDuc , Appl. Phys. Lett. 68, 3344 (1996).
- (6) Benjamin A. Mazin, Daniel Sank, Sean McHugh, Erik A. Lucero, Andrew Merrill, Jiansong Gao, David Pappas, David Moore, and Jonas Zmuidzinas, Appl. Phys. Lett. 96, 102504 (2010).
- (7) Cihan Kurter, John Abrahams, and Steven M. Anlage, Appl. Phys. Lett. 96, 253504 (2010).
- (8) Cihan Kurter, Philippe Tassin, Lei Zhang, Thomas Koschny, Alexander P. Zhuravel, Alexey V. Ustinov, Steven M. Anlage, and Costas M. Soukoulis , Phys. Rev. Lett. 107, 043901 (2011).
- (9) S. M. Anlage, J. Opt. 13, 024001 (2011).
- (10) T. B. Samoilova, Supercond. Sci. Tech. 8, 259 (1995).
- (11) M. Hein, High-temperature-superconductor thin films at microwave frequencies (Springer-Verlag, Berlin, 1999).
- (12) G. Ghigo, R. Gerbaldo, L. Gozzelino, F. Laviano, E. Mezzetti , Phys. Rev. B 82, 054520 (2010).
- (13) J. Ku, V. Manucharyan, and A. Bezryadin , Phys. Rev. B 82, 134518 (2010).
- (14) C. C. Chin, D. E. Oates, G. Dresselhaus and M. S. Dresselhaus, Phys Rev B 45, 4788 (1992).
- (15) D. E. Oates, S. H. Park and G. Koren, Phys. Rev. Lett. 93, 197001 (2004).
- (16) J. Wosik, L.- M. Xie, R. Grabovickic, T. Hogan, and S. A. Long , IEEE Trans. Appl. Supercond. 9, 2456 (1999).
- (17) C. Kurter, A. P. Zhuravel, A. V. Ustinov, S. M. Anlage, Phys. Rev. B 84, 104515 (2011).
- (18) M. Ricci, H. Xu, R. Prozorov, A. P. Zhuravel, A. V. Ustinov, S. M. Anlage , IEEE Trans. Appl. Supercond. 17, 918 (2007).
- (19) A. P. Zhuravel, S. M. Anlage, A. V. Ustinov, Appl. Phys. Lett. 88, 212503 (2006).
- (20) A. P. Zhuravel, S. M. Anlage, A. V. Ustinov, IEEE Trans. Appl. Supercond. 17, 902 (2007).
- (21) G. Ghigo, R. Gerbaldo, L. Gozzelino, F. Laviano, G. Lopardo, E. Monticone, C. Portesi, and E. Mezzetti, Appl. Phys. Lett. 94, 052505 (2009).
- (22) B. A. Willemsen, T. Dahm, and D. J. Scalapino, Appl. Phys. Lett. 71, 3898 (1997); T. Dahm and D. J. Scalapino, J. Appl. Phys. 82, 464 (1997).
- (23) A. P. Zhuravel, S. M. Anlage, S. K. Remillard, A. V. Lukashenko, and A. V. Ustinov, J. Appl. Phys. 108, 033920 (2010).
- (24) M. C. K. Wiltshire, J. B. Pendry, I. R. Young, D. J. Larkman, D. J. Gilderdale, and J. V. Hajnal, Science 291, 849 (2001).
- (25) C. Kurter, A. P. Zhuravel, J. Abrahams, C. L. Bennett, A. V. Ustinov, and S. M. Anlage, IEEE Trans. Appl. Supercond. 21, 709 (2011).
- (26) A. P. Zhuravel, A. G. Sivakov, O. G. Turutanov, A. N. Omelyanchouk, S. M. Anlage, A. Lukashenko, A. V. Ustinov, and D. Abraimov, Low Temp. Phys. 32, 592 (2006).
- (27) Matthew W. Brenner, Sarang Gopalakrishnan, Jaseung Ku, Timothy J. McArdle, James N. Eckstein, Nayana Shah, Paul M. Goldbart, Alexey Bezryadin, Phys. Rev. B 83, 184503 (2011).
- (28) M. S. Pambianchi, S. M. Anlage, E. S. Hellman, J. E. H. Hartford, M. Bruns, and S. Y. Lee, Appl. Phys. Lett. 64, 244 (1994); M. S. Pambianchi, L. Chen, and S. M. Anlage, Phys. Rev. B 54, 3508 (1996).
- (29) A. A. Zharov, and A. N. Reznik, Technical Physics 43, 117 (1998).
- (30) A. P. Zhuravel, S. M. Anlage, S. Remillard, A. V. Ustinov, Proceedings of the Sixth International Symposium on Physics and Engineering of Microwaves, Millimeter and Sub-millimeter Waves, (IEEE, 2007), Vol. 1, pp. 404 406.
- (31) P. J. Petersan and S. M. Anlage, J. Appl. Phys. 84, 3392 (1998).
- (32) A. P. Zhuravel, S. M. Anlage, and A. V. Ustinov, Proceedings of the Seventh International Symposium on Physics and Engineering of Microwaves, Millimeter and Sub-millimeter Waves (IEEE, 2010), Vol. 1, pp. 1 3.
- (33) J. C. Culbertson, H. S. Newman, and C. Wilker, J. Appl. Phys. 84, 2768 (1998).
- (34) R. Gross and D. Koelle, Rep. Prog. Phys. 57, 651 (1994).
- (35) A. P. Zhuravel, A. V. Ustinov, K. S. Harshavardhan, and S. M. Anlage, Appl. Phys. Lett. 81, 4979 (2002).
- (36) A. P. Zhuravel, S. M. Anlage, A. V. Ustinov, J. Supercond. Nov. Magn. 19, 625 (2006).
- (37) D. E. Oates, A. C. Anderson, P. M. Mankiewich, J. Supercond. 3, 251 (1990).
- (38) A. Yu. Rusanov, M. B. S. Hesselberth, and J. Aarts, Phys. Rev. B 70, 024510 (2004).