Tata Institute of Fundamental Research, Homi Bhabha Road, Colaba, Mumbai, 400 005, INDIA.
Saha Institute of Nuclear Physics, 1/AF, Bidhannagar, Kolkata, 700 064, INDIA.
11email: amit@iiap.res.in
Multiwavelength study of TeV Blazar Mrk421 during giant flare
Abstract
Context. The nearby (z=0.031) TeV blazar Mrk421 was reported to be in a high state of flux activity since November, 2009.
Aims. To investigate possible changes in the physical parameters of Mrk421 during its high state of activity using multiwavelength data.
Methods. We have observed this source in bright state using High Altitude GAmma Ray (HAGAR) telescope array at energies above 250 GeV during February 13 – 19, 2010. Optical, X-ray and -ray archival data are also used to obtain the SEDs and light curves.
Results. Mrk421 was found to undergo one of its brightest flaring episodes on February 17, 2010 by various observations in X-rays and -rays. HAGAR observations during February 13 – 19, 2010 at the energies above 250 GeV show an enhancement in the flux level, with a maximum flux of 7 Crab units being detected on February 17, 2010. We present the spectral energy distributions during this flaring episode and investigate the correlation of the variability in X-ray and -ray bands.
Conclusions. Our multiwavelength study suggests that the flare detected during February 16 and 17, 2010 could arise due to a passing shock in the jet.
Key Words.:
Astroparticle physics – BL lacertae objects: individual (Mrk421) – Telescopes – Gamma rays: galaxies1 Introduction
Blazars are a subclass of Active Galactic Nuclei (AGN) characterized by nonthermal emission extending from radio to high energies. The broadband radiation originates within a relativistic jet that is oriented very close to the line of sight. Spectral energy distribution (SED) of high energy peaked TeV blazars show two broad peaks. The first peak is located between infrared to X-ray energies and the second peak at -ray energies. It is believed that the first peak of the SED originates due to synchrotron radiation by relativistic electrons gyrating in the magnetic field of the jet. The origin of the high energy GeV/TeV peak is still under debate. This high energy peak might originate either due to interaction of electrons with photon field via Inverse Compton (IC) scattering as in leptonic models or due to interactions of protons with matter, magnetic field or photon fields in hadronic models. The seed photon field for IC scattering in leptonic models may come from synchrotron emission by the same population of electrons which produce the low energy bump (for a recent review of observations and models, see Krawczynski (2004)) in synchrotron self-Compton (SSC) model and from the external photons from accretion disk (Dermer & Schlickeiser 1993) or broad line region (BLR) (Ghisellini & Madau 1996) in external Compton models. The hadronic models suggest that high energy peak could be due to extremely energetic protons gyrating in a strong magnetic field emitting synchrotron radiation (Aharonian 2000; Mücke et al. 2003), or as inverse Compton and synchrotron emission from a proton-induced cascade (Mannheim 1998).
The blazar, Mrk421 (), is the first extragalactic source to be detected at -ray energy GeV (Punch et al. 1992). Since the first detection by the Whipple Observatory -ray telescope in 1992, Mrk421 has been detected by various other Atmospheric Cherenkov Telescopes (ACT) and air shower experiments (Petry et al. 1996; Zweerink et al. 1997; Aharonian et al. 1999; Bose et al. 2007; Yadav et al. 2007; Aleksić et al. 2010; Di Sciascio & ARGO-YBJ Collaboration 2010), and its -ray flux has been found to be highly variable.
Mrk421 was reported to be in a high state of activity during November 2009 to April 2010, with flaring behavior in X-ray (Isobe et al. 2010) and -ray bands detected in February, 2010. One of the brightest flaring episodes of this source was observed by various experiments on February 17, 2010. Preliminary results from different experiments show rapid flux variation in the very high energy (VHE) -rays from minute to hour time scales. During this bright outburst, the maximum VHE -ray flux ( GeV) reached above 9 Crab units (Ong 2010), with an average flux of 4 Crab units.
Using the newly commissioned High Altitude GAmma Ray (HAGAR) telescope system, we observed Mrk421 in its high state of activity during February to April, 2010 and also detected a very bright flare above 250 GeV.
In this paper, we study the multiwavelength behavior of Mrk421 during its high state of activity in February, 2010 and follow the evolution of its SEDs over a period of seven days, based on data from HAGAR, Fermi-LAT, RXTE-PCA and Swift-XRT. We also present a brief introduction to the HAGAR telescope and the data analysis techniques used to detect point like -ray sources with HAGAR.
2 HAGAR
HAGAR, an array of ACTs using wave front sampling technique, is located at the Indian Astronomical Observatory (IAO), Hanle (32∘ 46′ 46′′ N, 78∘ 58′ 35′′ E), in the Ladakh region of India, at an altitude of 4270 m. The main motivation behind setting up the -ray array at a high altitude is to exploit the higher Cherenkov photon density and thus achieve lower energy threshold (Cowsik et al. 2001). HAGAR consists of an array of seven telescopes in the form of a hexagon, with one telescope at the center. All the seven telescopes have seven para-axially mounted front coated parabolic mirrors of diameter m, with a UV sensitive photo-tube at the focus of individual mirrors. Each telescope is separated by m distance from its neighboring telescope. The seven PMT pulses of a telescope are linearly added to form a telescope output called the Royal sum pulse. A coincidence of at least 4 Royal sum pulses out of seven, above a predetermined threshold, is taken within a time window of 150 ns or 300 ns depending on the zenith angle of pointing direction to generate a trigger for initiating data recording. The HAGAR Data Acquisition (DAQ) system is CAMAC based. Data recorded for each event consist of
-
a.
Relative arrival time of the Cherenkov shower front at each mirror, as measured by TDCs with a resolution of 250 ps.
-
b.
A Real Time Clock (RTC) module synchronized with GPS is used to record the absolute arrival time of these events accurate upto s.
-
c.
The density of Cherenkov photons at each telescope is measured by the total charge present in PMT pulses (this is recorded by using 12 bit QDCs).
-
d.
Information on Royal sum pulses are also recorded like the individual PMT pulses.
-
e.
Latch information to indicate the triggered telescopes and other house keeping information on various scalar readings.
In addition, a parallel DAQ using commercial waveform digitizers with a sampling rate of 1 GS/s (ACQIRIS make model DC271A) is also used. The direction and energy of -rays are estimated by measuring relative time delays and densities of Cherenkov photons at each telescope respectively.
The performance of the HAGAR array has been studied by simulations, which are done in two steps: (1) Cherenkov emission due to -ray and cosmic ray induced air showers in the atmosphere, by using the Monte Carlo simulation package CORSIKA, developed by the KASCADE group (Heck et al. 1998), (2) study of the response of the array towards the Cherenkov radiation produced by the simulated showers. The performance parameters such as energy threshold, collection area and sensitivity of the experiment are obtained by a detector simulation package indigenously developed by the HAGAR collaboration. Energy threshold of the HAGAR telescope is estimated as 204 GeV in case of vertically incident -ray showers for a 4-Fold trigger condition, for which the corresponding collection area is cm2. HAGAR sensitivity is such that it will detect a Crab nebula like source at a significance level of in 15 hours of observation (Saha et al. 2011).
Cherenkov emission due to induced air showers forms a spherical wavefront with a large radius of curvature and thickness of 1 m at the observation level. This Cherenkov emission mainly originates at the shower maximum region which is at a height of about 5 km above the ground level at Hanle. This spherical wavefront is approximated as a plane wavefront in the data analysis procedure, which is a good approximation at the observation level. The arrival direction of each shower in Cherenkov light pool is computed by measuring the relative arrival times of shower front at different telescopes. The normal to this plane front gives the arrival direction of the incident shower. The angle between the direction of the shower axis and the pointing direction of the telescope is defined as Space Angle (). The Space Angle is estimated for every event by measuring the relative arrival time of the shower front at each telescope.
The observations were carried out by pointing all seven telescopes towards the source or background direction at a time. Each source run was followed (or preceded) by a background run with the same exposure time (typically minutes) and covered the same zenith angle range as that of the source to ensure that observations were carried out at almost the same energy threshold. Data selection was done by using parameters which characterize good quality data, in order to reduce systematic errors.
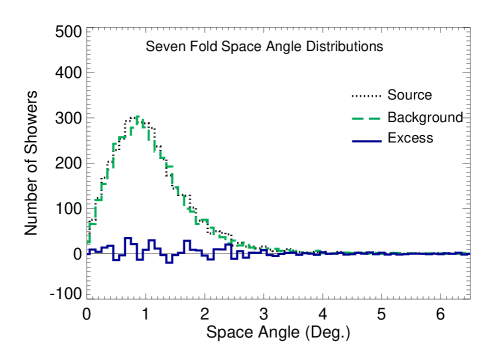
Extraction of the -ray signal was carried out by comparing the ON source and OFF source space angle distributions obtained during the same night. The excess events were computed from 0∘ to Lower Limit (LL), where LL is defined as the foot of distant half maximum point computed by fitting a Gaussian function to the space angle distribution. Background space angle distribution was normalized with source space angle distribution by comparing the tails of the distributions (LL to 6.5∘), since no -ray events are expected in this region. This normalization is required to compensate for possible changes in observation conditions or sky conditions during ON source and OFF source regions. Thus the number of -ray events are estimated as
| (1) |
where and are source and background events respectively and is the normalization constant obtained using the tail of the space angle distribution.
A typical space angle plot obtained for seven fold trigger is shown in Figure 1. The dotted (black) line histogram corresponds to source observations, dashed (green) line histogram corresponds to background observations. The histogram shown as solid (blue) line corresponds to the estimation of -ray events computed as the excess of ON source events over the normalized OFF source background events.
3 Multiwavelength observations and Analysis
Data obtained on Mrk421 by HAGAR during its high state in 2010 are combined with archival data from Fermi-LAT, RXTE-ASM, Swift-BAT, Swift-XRT, RXTE-PCA, SPOL and OVRO for a multiwavelength study. Details of the observations and analysis procedure used for each data set are discussed in this section.
3.1 HAGAR
The HAGAR observations of Mrk421 were carried out for three months on moonless nights, during February to April, 2010 at a mean zenith angle of 6∘. A total of 30 hours of data were collected during these observations. Suitable cuts were applied to the difference in the trigger rates of ON source and OFF source regions to ensure that observations were carried out at almost the same energy threshold. Some data were also rejected due to unavailability of all seven telescopes at the time of observations. After imposing such data quality cuts, a total of 18 hours of observation is used for further analysis. Data were analyzed according to the procedure discussed in §2 and Bose et al. (2007). We have analyzed only events with signals in at least 5 telescopes ( 5-Fold) in order to reduce systematic errors in our data. The 5-Fold events correspond to an energy threshold of about 250 GeV.
3.2 Fermi-LAT
The Large Area Telescope (LAT) is a pair production telescope (Atwood et al. 2009) on board Fermi spacecraft. It covers the energy range from 20 MeV to more than 300 GeV with a field of view 2.5 sr. Fermi-LAT data111http://fermi.gsfc.nasa.gov/ of Mrk421 obtained during 2010 February 12 – 22 above 100 MeV were analyzed using the standard analysis procedure (ScienceTools) provided by the Fermi-LAT collaboration. A circular region of 10∘ radius “region of interest (ROI)” was chosen around Mrk421 for event reconstruction from the so-called “diffuse” event class data which has the maximum probability of being the source photons. We only retained events having a zenith angle 105∘ to avoid the background from Earth albedo. The spectral analysis on the resulting data set was carried out by including galactic diffuse emission component model (glliemv02.fit) and an isotropic background component model (isotropiciemv02) with post-launch instrumental response function P6V3 DIFFUSE, by using unbinned maximum likelihood analysis (Cash 1979; Mattox et al. 1996). A power law spectrum was used to model the source spectrum above 100 MeV, with integral flux and photon index as free parameters. The flux, spectrum and source location are determined by using unbinned GTLIKE algorithm.
3.3 X-ray data from RXTE and Swift
Proportional Counters Array (PCA) (Bradt et al. 1993) is an array of five identical xenon filled proportional counter units (PCUs). The PCUs cover energy range from 2 – 60 keV with a total collecting area of 6500 cm2. The archival X-ray data from PCA on board RXTE during 2010 February 13 – 19 was analyzed to obtain the X-ray spectrum and light curve. We have analyzed standard 2 PCA data which has a time resolution of 16 seconds with energy information in 128 channels. Data analysis was performed using FTOOLS (version 5.3.1) distributed as a part of HEASOFT (version 5.3). Data were filtered using the standard procedure given in the RXTE Cook Book 4 for each of the observations. The background models were generated with the tool “pcabackest”, based on RXTE GOF calibration files for a ’bright’ source (more than 40 ct/sec/PCU). The PCA spectrum in the the energy range of 3 – 30 keV was fitted by using XSPEC with a cutoff powerlaw with line of sight absorption. The line of sight absorption was fixed to neutral hydrogen column density at 1.381020 cm-2 (Dickey & Lockman 1990).
The XRT on board Swift (Burrows et al. 2005) uses a grazing incidence Wolter I telescope to focus X-rays onto a CCD. The instrument has an effective area of 110 cm2, 23.6 arcmin FOV, 15 arcsec resolution (half-power diameter), and an energy range of 0.2 – 10 keV. The Windowed Timing (WT) mode data were used to obtain spectrum (0.3 – 3 keV) from Swift-XRT during 2010 February 13- 19. Source photons were extracted using a box region with the length of 40 pixels and width about 20 pixels. Events with grades 0 – 2 were selected for the WT mode data. The spectral data were rebinned by GRPPHA 3.0.0 with 20 photons per bin. Standard auxiliary response files and response matrices were used. Spectra for this source were fitted using XSPEC version 12.3.1 with a model consisting of absorbed power law over the energy range of 0.3 – 10 keV.
The “Dwell” data from RXTE-ASM was obtained from ASM website222http://xte.mit.edu/ and these data were analyzed by the method discussed in Chitnis et al. (2009). A daily average flux between 15 – 50 keV from Swift-BAT was obtained from BAT website333http://heasarc.nasa.gov/docs/swift/results/transients/.
3.4 Optical and radio data
The optical and radio data made available in the Fermi multiwavelength support program websites444http://james.as.arizona.edu/ psmith/Fermi/,555http://www.astro.caltech.edu/ovroblazars/index.php?page=home are used in this study.
The optical observations were made using the SPOL CCD Imaging/Spectropolarimeter at Steward Observatory (Smith et al. 2009). The optical V band photometric data were obtained.
The 15 Ghz radio observations were made by using a 40 meter single dish telescope at Owens Valley Radio Observatory (OVRO). Details of the analysis are described in Richards et al. (2011).
4 Results
Mrk421 was found to be in a high state of activity during the entire period of HAGAR observations during February – April, 2010, and was in its brightest state in February, 2010. The -ray and X-ray fluxes decreased in the later months, but were still higher than that during the quiescent state. Results of observations of Mrk421 using HAGAR during the three months period are given in Table 1.

Figure 2 contains the daily light curve of Mrk421 during February – April, 2010. The upper panel shows the daily average of VHE -ray flux obtained from HAGAR. Bottom panel shows daily average from ASM on board RXTE in 1.5 – 12 keV. It is clearly seen in the HAGAR as well as RXTE – ASM light curves that Mrk421 was in its brightest state in February, 2010 in both VHE -rays and X-rays.
HAGAR telescope detected Mrk421 in a high state of VHE -ray flux, during the period February 13 – 19, 2010. One of the brightest flaring episodes was observed on February 17, 2010 (see Figure 2), with the maximum flux between 6 – 7 Crab units. The source was detected with 5 sigma significance in less than 40 minutes of observations. We investigate in the following the multiwavelength behaviour of Mrk421 during the flaring episode.
| Month | Total | Excess number | Mean | Signi- |
|---|---|---|---|---|
| 2010 | duration | of on source | -ray rate | ficance |
| (min) | events | (/min) | ||
| February | 479 | 6418.22 | 13.41.05 | 12.7 |
| March | 478 | 2524.23 | 5.31.1 | 4.8 |
| April | 116 | 414 | 3.52.1 | 1.7 |

4.1 Flux Variability during February 10 – 26, 2010
The multiwavelength (radio to -rays) quasi-simultaneous light curve of Mrk421 during February 10 – 26, 2010 based on observations in §3, is shown in Figure 3. The top eight panels correspond to data from OVRO, SPOL, Swift – XRT, RXTE – ASM, RXTE – PCA, Swift – BAT, Fermi-LAT (0.2 – 2 GeV) and Fermi-LAT (2 – 300 GeV) respectively. The bottom panel corresponds to HAGAR data above 250 GeV.
A clear variation of flux over a period of seven days is observed in the optical, X-rays and -rays during February 13 – 19, 2010. The peak flux in optical, X-rays and low energy -rays are observed to be around February 16, 2010 while in the VHE -ray band, the peak is seen on February 17, 2010 with a possible one day lag compared to the situation at lower energies. The radio flux has not changed significantly during this time.

4.2 Intra-Day and spectral variability during February 10 – 26, 2010
Fermi-LAT data indicate an intra-day flux variability at energies 200 MeV during the TeV flare on February 17, 2010. An increase in the flux is seen in the first 9 hours (MJD55244.0 – 55244.4) of LAT observations, followed by a quiescence that lasts for a few hours (MJD55244.4 – 55244.6) before the occurrence of another increase in flux during MJD55244.7 to MJD55244.85. A similar trend was detected by the VERITAS collaboration (Ong 2010). HAGAR also observed a continuous decrease in the flux over a period of 2 hrs (MJD55244.8 – 55244.86), which were simultaneous with LAT during later part of the night (see Figure 4).
Spectral variation also has been detected over eleven days (February 12 – 22) of Fermi-LAT observations and seven days (February 13 – 19) of RXTE-PCA observations. A photon index of , implying a flat/hard energy spectrum was observed in the Fermi-LAT data at energies above 100 MeV on February 17, 2010. On the other hand maximum hardening in RXTE-PCA data was observed on February 16 (Figure 5 and Table 2). Spectral hardening in the X-rays (Tanihata et al. 2004) and -rays (Zweerink et al. 1997) during strong flares has been reported earlier also.
| State | Cutoff PCA (keV) | Index PCA | Index LAT |
|---|---|---|---|
| Pre Flare | 29.16.3 | 2.340.05 | 1.650.03 |
| Moderate Flare | 19.51.5 | 1.910.03 | 1.670.15 |
| TeV Flare | 26.82.2 | 2.030.02 | 1.390.16 |
| Post Flare | 35.22.3 | 2.190.02 | 2.060.04 |

5 Discussion
Mrk421 has shown several high states of flux activity in X-rays and -rays over the period of the past two decades (Buckley et al. 1996; Gaidos et al. 1996; Krennrich et al. 1999; Takahashi et al. 2000; Bhatt et al. 2002; Błażejowski et al. 2005; Bose et al. 2007; Giebels et al. 2007; Albert et al. 2007; Fossati et al. 2008; Horan et al. 2009; Vernetto & Argo-Ybj Collaboration 2011; Binks 2010). It was observed in the brightest state of TeV -ray flux during the years of 2000-2001, when its maximum flux reached as high as 14 Crab units above 1 TeV (Tluczykont et al. 2010). It has also shown several mild high states since 2001, but was not found to be in an extreme high state till 2010. Mrk421 had brightened up again in November 2009 and was observed by the VERITAS collaboration in an extreme high flux state on February 17, 2010. The VERITAS collaboration reported a maximum flux of 9 Crab units above 100 GeV (Ong 2010) and the HESS collaboration (Tluczykont 2011) also found this source in a high state during their follow up observations.
We have also detected this flare using the HAGAR telescope system, a few hours after the VERITAS observations, with a maximum flux of 6 – 7 Crab units above 250 GeV (1 Crab unit 4.2 -rays/minute above 250 GeV). HAGAR continued the observations of Mrk421 over the next two months. The average flux during February, 2010 was found to be 3 Crab units and 1 Crab unit during March and April, 2010.
5.1 Spectral Energy Distribution
The Spectral Energy Distribution of TeV blazars has a typical two-bump shape. It is often believed that the broadband emission from these sources is produced by synchrotron self-Compton (SSC) mechanism. The lower energy bump, which peaks at infrared to X-ray is interpreted as synchrotron emission emitted by relativistic electrons gyrating in the magnetic field of the jet, and the GeV/TeV bump is attributed to IC scattering of synchrotron photons by the same population of electrons which produces the synchrotron radiation.
A one zone homogeneous SSC model developed by Krawczynski et al. (2004) is used to fit the multiwavelength data to obtain the SED. This model assumes a spherical blob of plasma of a comoving radius which travels with a bulk Lorentz factor towards the observer. The emission volume is filled with an isotropic population of electrons and a randomly oriented uniform magnetic field . Energy spectrum of the injected electrons in the jet frame is described by a broken power law with low-energy to and high-energy to components with indices of and . The emitted radiation is Doppler boosted by the Doppler factor
| (2) |
where is the bulk velocity of the plasma in units of the speed of light and the angle between jet axis and the line of sight in the observer frame. The VHE -ray spectrum is corrected for absorption by the extragalactic background light (Franceschini et al. 2008).
The radius of the emission zone is constrained by the variability time scales. Variability present in X-ray and -ray data is of the order of one day, so we have chosen day. The comoving radius of the emission zone is defined as
| (3) |
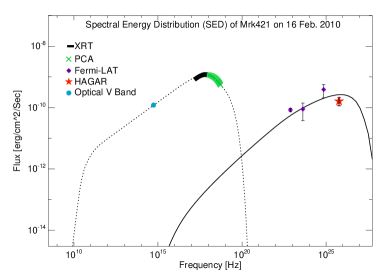
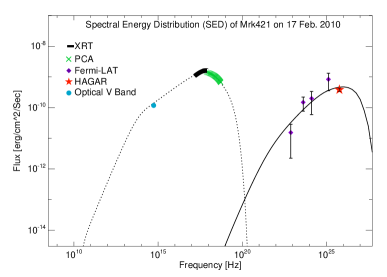
We have attempted to obtain SEDs for different flux states using multiwavelength data of the Mrk421 during HAGAR observations of February 13 – 19, 2010 in an attempt to search for any changes in the physical parameters over this period. This multiwavelength data is divided into four states according to the flux state of the source as follows: State 1: Pre Flare (13 – 15 February), State 2: moderate flare (16 February), State 3: TeV flare (17 February) and State 4: post flare (18 – 19 February). The pre flare state of the source is a moderate high state.
The Fermi-LAT data is divided into three bins (0.1 – 1 GeV, 1 – 3 GeV and 3 – 300 GeV) to obtain spectrum of Mrk421 for ’State 1’, ’State 2’ and ’State 4’ by freezing the photon index to 1.65, 1.67 and 2.06 respectively. These photon indices were obtained by analyzing the 0.1 – 300 GeV data from Fermi-LAT. The Fermi-LAT spectrum of February 17, 2010 was obtained by dividing Fermi-LAT data into four bins (0.1 – 1 GeV, 1 – 3 GeV, 3 – 10 GeV and 10 – 300 GeV) by freezing the photon index to 1.39, obtained by the analysis of the 0.1 – 300 GeV data. The best fit photon indices and cutoff energies for all four states are presented in Table 2.
The magnetic field, Doppler factor (), electron energy density, break present in electron injection spectrum , , , minimum and maximum electron energies are used as free parameters while fitting the model to optical, X-ray and -ray data. The angle between the jet axis and the line of sight in the observer frame is taken to be 2.6∘.
| Instruments | Lag (Days) | Correlation | Algorithm | Data Used | |
|---|---|---|---|---|---|
| coefficient | 2010 | ||||
| RXTE – ASM vs Swift – BAT | 0.0 | 0.81 | CCF | 13 – 19 February | |
| RXTE – ASM vs Swift – BAT | 0.0 | 0.77 | ZDCF | 10 – 27 February | |
| RXTE – ASM vs HAGAR | 1.3 | 0.62 | ZDCF | February to April | |
| Swift – BAT vs HAGAR | 1.3 | 0.88 | CCF | 13 – 19 February | |
| Swift – BAT vs HAGAR | 1.3 | 0.82 | ZDCF | 13 – 19 February | |
| Swift – BAT vs HAGAR | 1.3 | 0.74 | ZDCF | February to April |
5.2 Evolution of the SED during the high state
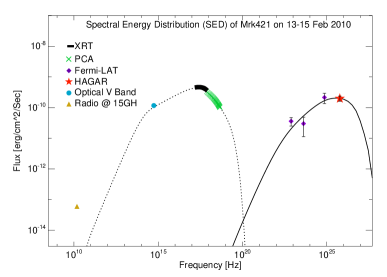
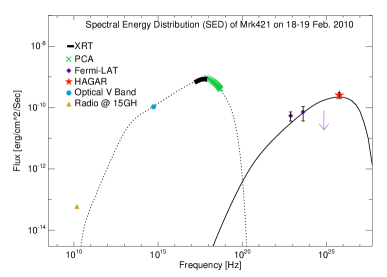
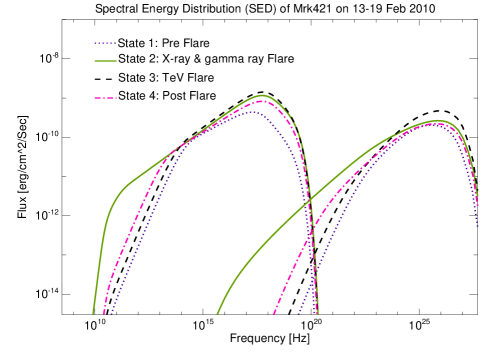
The Fermi-LAT collaboration (Abdo et al. 2009) had reported photon index of the energy spectrum of Mrk421 to be 1.78 from the first 5.5 months of their observations. This refers to an average spectrum mostly during the quiescent state. However, during ’State 1’ (see Figure 6a), we find the energy spectrum to be flatter with a photon index of 1.65 corresponding to 0.1 – 300 GeV Fermi-LAT data. Also, we see a plateau in the light curves during this state in the Fermi-LAT data (in 2 – 300 GeV energy bands) and 15 – 50 keV Swift – BAT data (see Figure 3). The presence of a plateau in the light curve indicates that the injection time scales of energetic electrons are longer than the cooling time scales, and the entire volume of emission zone is radiating. Plateaux are also observed in other -ray sources like 3c454.3 (Abdo et al. 2011a).
Flares in optical, X-ray, low energy (2 GeV) -ray and HE (2 – 300 GeV) -ray band were seen in ’State 2’. The corresponding SED is shown in Figure 6b. These low and HE -ray flares could be caused by upscattering of X-ray photons by low energy electrons which are produced by SSC cooling in ’State 1’. As an effect of low energy flare, the low energy part of SED in ’State 2’ is much flatter than that in ’State 1’.
The observed GeV/TeV flares above 250 GeV on 17 February could be produced by upscattering of X-ray photons in Swift – BAT energy range by higher energy electrons (see Figure 6.c for the SED). The presence of a passing shock might have accelerated the electrons to higher energies in the emission region.
The source is brighter at lower energy -ray in ’State 4’, which could be due to cooling of electrons after the high energy flare. The corresponding SED is shown in the Figure 6d.
The derived SED parameters for each state are listed in Table 4, and in Figure 6e we illustrate the change that the SED undergoes during the four different states of the source.
| State | Magnetic | Doppler | log Emina𝑎aa𝑎aEmin: Minimum value of energy of the electrons present in the emission zone | log Emaxb𝑏bb𝑏bEmax:Maximum value of energy of the electron present in the emission zone | Ebreakc𝑐cc𝑐cEbreak: Break in the electron injection spectrum | p1 | p2 | Sypkd𝑑dd𝑑dSypk:Peak value of synchrotron bump | ICpke𝑒ee𝑒eICpk:Peak value of IC bump | Uef𝑓ff𝑓fUe:Electron energy density | g𝑔gg𝑔g:Equipartition coefficient |
|---|---|---|---|---|---|---|---|---|---|---|---|
| - | field | factor | [eV] | [eV] | [eV] | - | [] | [] | [] | ||
| - | (G) | () | - | - | - | - | (Hz) | (Hz) | (erg/cc) | - | |
| State1 | 0.026 | 19.5 | 9.6 | 12.1 | 11.3 | 2.4 | 4.3 | 1.93 | 3.58 | 0.9 | 33.46 |
| State2 | 0.029 | 22.0 | 8.0 | 12.1 | 11.40 | 2.2 | 3.9 | 5.74 | 7.02 | 1.4 | 41.83 |
| State3 | 0.029 | 21.0 | 9.4 | 12.1 | 11.45 | 2.2 | 4.1 | 6.13 | 11.53 | 1.0 | 29.88 |
| State4 | 0.028 | 21.0 | 9.1 | 12.1 | 11.45 | 2.3 | 4.1 | 5.53 | 6.76 | 8.5 | 27.24 |
5.3 Light Curve
Significant flux variation in optical, X-ray and -ray bands is detected during February, 2010. The highest energy tail of the electron energy distribution () is responsible for the production of the observed X-ray synchrotron continuum at 0.5 keV, while the TeV -rays might be produced through upscattering of synchrotron photons by the same population of electrons. The observed optical, X-ray variability during February, 2010 may be explained by injection of fresh electron in emission zone and cooling of the electrons due to SSC mechanism. Swift – BAT light curve showed faster variability than RXTE – ASM, which could be due to the cooling effect of high energy electrons, which produce X-rays at the 15 – 50 keV range.
The observed -ray variability mainly divided into two bands, 2 GeV and above 2 GeV. The 0.2 – 2 GeV -rays observed by Fermi-LAT could be produced by low energy electrons through IC scattering of UV synchrotron photons. Fermi-LAT detected a significant variation flux in the 0.2 – 2 GeV band, observed over a period of eleven days during February 12 – 22, 2010.
The observed HE (2 GeV) -rays by Fermi-LAT and VHE -rays by HAGAR could be produced by IC scattering of the electrons having a Lorentz factor in the range . The observations from Fermi-LAT (2 – 300 GeV) show a symmetrical flare centered around February 16, 2010 but VHE -rays flux, observed by HAGAR reaches peak with one day lag on February 17, 2010. A fresh injection of high energy electrons accelerated by shock could be responsible for the observed flare in -rays. If SSC cooling time scale is less then the light-crossing time of emission zone than the flare could be symmetric.
5.4 Cross correlation study and time lag
From the X-ray and -ray light curves (Figures 2 and 3), we can see that fluxes of Mrk421 in these bands are roughly correlated. We have investigated this correlation between X-ray and -ray bands using cross-correlation function (CCF) and using z-transformed discrete correlation function (ZCDF) (Alexander 1997) a freely available FORTRAN 77 ZDCF code666http://www.weizmann.ac.il/home/tal/zdcf2.html. Observed lag and correlation coefficient between RXTE – ASM, Swift – BAT and HAGAR using CCF and ZDCF algorithms are listed in Table 3 for various cases. The time lag between X-ray and -ray emissions might impose constraints on emission region and also it could distinguish between SSC and External Compton (EC) models.
6 Conclusions
We found satisfactory fits for all the four states with one zone SSC model described in §5.1. The observed pre to post flare evolution of SED and light curve are explained by the model. Changes in the physical conditions such as Doppler factor and magnetic field during these observations are indicated by modeling of the multiwavelength data. It appears that changes in these parameters are related to the activity of the source. The change in jet flow from ‘State 1’ to ‘State 2’ may lead to a shock in jet. We also found small changes in particle energy density and magnetic field strength from ‘State 1’ to ‘State 2’. The best fits obtained by fitting multiwavelength data to SSC model during the rising part of the flare (’State 2’ and ’State 3’) are found for power law index of the electron injection spectrum before break as . As p1=2.2 is an outcome of Fermi first order mechanism, it strengthens the belief that a strong shock might have accelerated the electrons in the emission zone and caused the flare by SSC mechanism. Very recently, (Abdo et al. 2011b) showed that electrons present in the emission zone of Mrk421 might be accelerated by Fermi first order mechanism at the shock front. The best fit parameters from the modeling of SED using multiwavelength data for ’State 1’ indicate an aged population of electrons with was present in the emission zone. Light curve during the same period suggests that the entire volume of emission zone was radiating. The observed change in electron injection spectrum p1=2.3 during the decaying part of the flare might be considered to be an outcome of SSC cooling mechanism.
The observed break in electron injection spectrum could also be explained as a cooling break, where escape time of an electron of Lorentz factor , equals the radiative cooling time. It is observed from our results that the cooling break changes with the state of the source. We have also found that both SED peaks move towards higher energy as the source flux increases, and come back to lower energies as it decreases. Spectral hardening is also observed at X-rays and -rays at the time of the flare (high state) (see Figure 5, Table 2). A departure from equipartition is also observed during this high state. The emission process at the time of high activity is more complex than in the quiescent state. Energy dependent variability observed from Fermi-LAT has shown that the source is much more complex than anticipated. The emission from Mrk421 also showed intra-day variability on 17 February 2010, in -ray bands above 0.2 GeV in Fermi-LAT data and 250 GeV from HAGAR data. We could not detect significantly this sub-hour scale variability from Fermi-LAT due to the large error bars. The detection of sub-hour variability from Fermi-LAT and HAGAR could constrain the size of the emission region. The present results of correlation studies between X-ray and -ray flux variability are not conclusive enough to distinguish between the one zone SSC or EC model. However, the observed hardening of the emission spectra obtained from Fermi-LAT and RXTE – PCA data with a one day lag (see Figure 5 and Table 2), is inconsistent with the SSC model and opens up the possibility of multizone SSC or EC models.
7 Summary
-
i.
HAGAR Cherenkov telescope has detected VHE -rays from the TeV blazar Mrk421 during 2010 February to April, with the blazar being in a high state of activity above 250 GeV. The emission reached a peak on February 17, with a maximum flux of 7 Crab units, indicating a flare.
-
ii.
An energy dependent variation of flux in the HE -rays (0.1 – 300 GeV) has been observed by Fermi-LAT during the flare in February, 2010.
-
iii.
Multiwavelength data indicate a variation in the spectral index during the high state.
-
iv.
A weak correlation between X-rays and VHE -ray has been found with a time lag of day.
-
v.
The observed multiwavelength SEDs during February 13 – 19, 2010 indicate changes in the physical conditions such as magnetic field, Doppler factor and particle energies in the emission zone. The multiwavelength flare during February 16 – 17, 2010 and changes in physical conditions of the emission zone are explained as an effect of a passing shock in the jet.
Acknowledgements.
This work used results provided by the ASM/RXTE teams at MIT. This study also used Swift/BAT transient monitor results provided by the Swift/BAT team. This research has also made use of data obtained from the High Energy Astrophysics Science Archive Research Center (HEASARC), provided by NASA’s Goddard Space Flight Center. Data from the Steward Observatory spectropolarimetric monitoring project were used. This program is supported by Fermi Guest Investigator grants NNX08AW56G and NNX09AU10G. Radio data at 15 Ghz is used from OVRO 40 M Telescope and this Fermi blazar monitoring program is supported by NASA under award NNX08AW31G, and by the NSF under award 0808050. We are grateful to the engineering and technical staff of IIA and TIFR who have taken part in the construction of the HAGAR telescopes and contributed to the setting up of the front-end electronics and the data acquisition. We are grateful to Prof. R. Cowsik and Prof. B. V. Sreekantan for their keen interest and encouragement in the development of the HAGAR facility. We also thank the anonymous referee for their suggestions which improved the manuscript.References
- Abdo et al. (2011a) Abdo, A. A., Ackermann, M., Ajello, M., et al. 2011a, ApJ, 733, L26
- Abdo et al. (2009) Abdo, A. A., Ackermann, M., Ajello, M., et al. 2009, ApJ, 707, 1310
- Abdo et al. (2011b) Abdo, A. A., Ackermann, M., Ajello, M., et al. 2011b, ApJ, 736, 131
- Aharonian (2000) Aharonian, F. A. 2000, New A, 5, 377
- Aharonian et al. (1999) Aharonian, F. A., Akhperjanian, A. G., Andronache, M., et al. 1999, A&A, 350, 757
- Albert et al. (2007) Albert, J., Aliu, E., Anderhub, H., et al. 2007, ApJ, 663, 125
- Aleksić et al. (2010) Aleksić, J., Anderhub, H., Antonelli, L. A., et al. 2010, A&A, 519, A32
- Alexander (1997) Alexander, T. 1997, in Astrophysics and Space Science Library, Vol. 218, Astronomical Time Series, ed. D. Maoz, A. Sternberg, & E. M. Leibowitz, 163
- Atwood et al. (2009) Atwood, W. B., Abdo, A. A., Ackermann, M., et al. 2009, ApJ, 697, 1071
- Bhatt et al. (2002) Bhatt, N., Agarwal, N. K., Bhat, C. K., et al. 2002, Bulletin of the Astronomical Society of India, 30, 385
- Binks (2010) Binks, J. 2010, APS Four Corners Section Meeting Abstracts, L1004
- Błażejowski et al. (2005) Błażejowski, M., Blaylock, G., Bond, I. H., et al. 2005, ApJ, 630, 130
- Bose et al. (2007) Bose, D., Chitnis, V. R., Vishwanath, P. R., et al. 2007, Ap&SS, 309, 111
- Bradt et al. (1993) Bradt, H. V., Rothschild, R. E., & Swank, J. H. 1993, A&AS, 97, 355
- Buckley et al. (1996) Buckley, J. H., Akerlof, C. W., Biller, S., et al. 1996, ApJ, 472, L9
- Burrows et al. (2005) Burrows, D. N., Hill, J. E., Nousek, J. A., et al. 2005, Space Sci. Rev., 120, 165
- Cash (1979) Cash, W. 1979, ApJ, 228, 939
- Chitnis et al. (2009) Chitnis, V. R., Pendharkar, J. K., Bose, D., et al. 2009, ApJ, 698, 1207
- Cowsik et al. (2001) Cowsik, R., Bhat, P. N., Chitnis, V. R., Acharya, B. S., & Vishwanath, P. R. 2001, in International Cosmic Ray Conference, Vol. 7, International Cosmic Ray Conference, 2769
- Dermer & Schlickeiser (1993) Dermer, C. D. & Schlickeiser, R. 1993, ApJ, 416, 458
- Di Sciascio & ARGO-YBJ Collaboration (2010) Di Sciascio, G. & ARGO-YBJ Collaboration. 2010, Mem. Soc. Astron. Italiana, 81, 326
- Dickey & Lockman (1990) Dickey, J. M. & Lockman, F. J. 1990, ARA&A, 28, 215
- Fossati et al. (2008) Fossati, G., Buckley, J. H., Bond, I. H., et al. 2008, ApJ, 677, 906
- Franceschini et al. (2008) Franceschini, A., Rodighiero, G., & Vaccari, M. 2008, A&A, 487, 837
- Gaidos et al. (1996) Gaidos, J. A., Akerlof, C. W., Biller, S., et al. 1996, Nature, 383, 319
- Ghisellini & Madau (1996) Ghisellini, G. & Madau, P. 1996, MNRAS, 280, 67
- Giebels et al. (2007) Giebels, B., Dubus, G., & Khélifi, B. 2007, A&A, 462, 29
- Heck et al. (1998) Heck, D., Knapp, J., Capdevielle, J. N., Schatz, G., & Thouw, T. 1998, CORSIKA: a Monte Carlo code to simulate extensive air showers., ed. Heck, D., Knapp, J., Capdevielle, J. N., Schatz, G., & Thouw, T.
- Horan et al. (2009) Horan, D., Acciari, V. A., Bradbury, S. M., et al. 2009, ApJ, 695, 596
- Isobe et al. (2010) Isobe, N., Sugimori, K., Kawai, N., et al. 2010, PASJ, 62, L55
- Krawczynski (2004) Krawczynski, H. 2004, New A Rev., 48, 367
- Krawczynski et al. (2004) Krawczynski, H., Hughes, S. B., Horan, D., et al. 2004, ApJ, 601, 151
- Krennrich et al. (1999) Krennrich, F., Biller, S. D., Bond, I. H., et al. 1999, ApJ, 511, 149
- Mannheim (1998) Mannheim, K. 1998, Science, 279, 684
- Mattox et al. (1996) Mattox, J. R., Bertsch, D. L., Chiang, J., et al. 1996, ApJ, 461, 396
- Mücke et al. (2003) Mücke, A., Protheroe, R. J., Engel, R., Rachen, J. P., & Stanev, T. 2003, Astroparticle Physics, 18, 593
- Ong (2010) Ong, R. A. 2010, The Astronomer’s Telegram, 2443, 1
- Petry et al. (1996) Petry, D., Bradbury, S. M., Konopelko, A., et al. 1996, A&A, 311, L13
- Punch et al. (1992) Punch, M., Akerlof, C. W., Cawley, M. F., et al. 1992, Nature, 358, 477
- Richards et al. (2011) Richards, J. L., Max-Moerbeck, W., Pavlidou, V., et al. 2011, ApJS, 194, 29
- Saha et al. (2011) Saha, L., Acharya, B. S., Anupama, G. C., et al. 2011, in International Cosmic Ray Conference., paper id:OG2.5,1129
- Smith et al. (2009) Smith, P. S., Montiel, E., Rightley, S., et al. 2009, ArXiv e-prints
- Takahashi et al. (2000) Takahashi, T., Kataoka, J., Madejski, G., et al. 2000, ApJ, 542, L105
- Tanihata et al. (2004) Tanihata, C., Kataoka, J., Takahashi, T., & Madejski, G. M. 2004, ApJ, 601, 759
- Tluczykont (2011) Tluczykont, M. 2011, ArXiv e-prints No.:1106.1035
- Tluczykont et al. (2010) Tluczykont, M., Bernardini, E., Satalecka, K., et al. 2010, A&A, 524, A48
- Vernetto & Argo-Ybj Collaboration (2011) Vernetto, S. & Argo-Ybj Collaboration. 2011, Astrophysics and Space Sciences Transactions, 7, 65
- Yadav et al. (2007) Yadav, K. K., Chandra, P., Tickoo, A. K., et al. 2007, Astroparticle Physics, 27, 447
- Zweerink et al. (1997) Zweerink, J. A., Akerlof, C. W., Biller, S. D., et al. 1997, ApJ, 490, L141