IRAS 114720800: an extremely depleted pulsating binary post-AGB star. ††thanks: Based on observations collected at the European Southern Observatory, Chile. Program ID: 65.L-0615(A), on observations made with the Mercator Telescope, operated on the island of La Palma by the Flemish Community, at the Spanish Observatorio del Roque de los Muchachos and on observations obtained with the HERMES spectrograph, which is supported by the Fund for Scientific Research of Flanders (FWO), Belgium, the Research Council of K.U.Leuven, Belgium, the Fonds National Recherches Scientific (FNRS), Belgium, the Royal Observatory of Belgium, the Observatoire de Genève, Switzerland and the Thüringer Landessternwarte Tautenburg, Germany.
Abstract
Aims. We focus here on one particular and poorly studied object, IRAS 114720800. It is a highly evolved post-Asymptotic Giant Branch (post-AGB) star of spectral type F, with a large infrared excess produced by thermal emission of circumstellar dust.
Methods. We deploy a multi-wavelength study which includes the analyses of optical and IR spectra as well as a variability study based on photometric and spectroscopic time-series.
Results. The spectral energy distribution (SED) properties as well as the highly processed silicate N-band emission show that the dust in IRAS 114720800 is likely trapped in a stable disc. The energetics of the SED and the colour variability show that our viewing angle is close to edge-on and that the optical flux is dominated by scattered light. With photospheric abundances of [Fe/H] = 2.7 and [Sc/H]=4.2, we discovered that IRAS 114720800 is one of the most chemically-depleted objects known to date. Moreover, IRAS 114720800 is a pulsating star with a period of 31.16 days and a peak-to-peak amplitude of 0.6 mag in . The radial velocity variability is strongly influenced by the pulsations, but the significant cycle-to-cycle variability is systematic on a longer time scale, which we interpret as evidence for binary motion.
Conclusions. We conclude that IRAS 114720800 is pulsating binary star surrounded by a circumbinary disc. The line-of-sight towards the object lies close the the orbital plane making that the optical light is dominated by scattered light. IRAS 114720800 is one of the most chemically-depleted objects known so far and links the dusty RV Tauri stars to the non-pulsating class of strongly depleted objects.
Key Words.:
Stars: AGB and post-AGB - Stars: binaries: general - Stars: binaries: spectroscopic - Stars: chemically peculiar- Stars: evolution1 Introduction
Some stars display a peculiar chemical anomaly in their photospheres: the abundances are depleted and reflect the gas-phase abundance of the interstellar medium (ISM): chemical species with a low dust condensation temperature (like Zn and S), are more abundant relative to elements with a high dust condensation temperature (like Fe, Ca or the s-process elements). Among evolved stars, this anomaly was first recognized in extreme cases like in BD+39 4926 (Bond & Luck 1987), HR 4049 (Lambert et al. 1988; Waelkens et al. 1991a) and HD 52961 (Waelkens et al. 1991a; Van Winckel et al. 1992), which are objects thought to be in a post-AGB evolutionary stage. In the latter two objects, the photospheric Fe abundance is reduced to about 1/60000 times the solar value while the S and Zn abundances are only slightly less than solar. HD 52961 has even a photosphere with more Zn than Fe!
The process itself is still poorly understood but the basic ingredients involve a phase of dusty mass loss. The dust formation process induces the chemical fractionation as the refractory elements with a high dust-condensation temperature are preferentially locked up in solid state dust particles. A gas-dust separation process is followed by an accretion on the star of the circumstellar gas only, which results in a photosphere that is coated by a layer of circumstellar gas devoid of refractory elements (Mathis & Lamers 1992). Waters et al. (1992) proposed that the most favourable circumstance for the depletion process to occur is when (part of the) circumstellar dust is trapped in a stable circumstellar disc. This allows for a stable environment in which dust-gas separation and re-accretion can occur. For post-AGB stars, a stable disc likely implies binarity of the central star, a proposal that was inspired by the finding that the four extreme cases known at that time were indeed each part of a binary system (Van Winckel et al. 1995)
In the last 15 years, it became clear that this chemical anomaly is very widespread indeed and not limited to extreme cases. Much milder depletion patterns are being detected now (e.g., Gonzalez et al. 1997b; Giridhar et al. 2005; Maas et al. 2005; Hrivnak et al. 2008; Sumangala Rao et al. 2011, and references therein). The depleted objects are not limited to Galactic objects; in the Large Magellanic Cloud, depleted photospheres are now being found as well (Reyniers & Van Winckel 2007; Gielen et al. 2009). In almost all cases the spectral energy distributions (SEDs) of the depleted objects are distinct. The SED is bimodal, with peaks in the visible and mid-IR, and often includes a prominent near-IR excess which is interpreted as coming from hot dust in a stable dusty disc (e.g., Van Winckel 2003, and references therein). This characteristic SED was used to start systematic searches for such systems (De Ruyter et al. 2006), and in the remainder of this contribution we will call these objects disc sources.
Interferometric studies confirm the very compact nature of the circumstellar material around the disc sources (Deroo et al. 2006, 2007), and the infrared spectroscopic data show a very high processing of the circumstellar dust grains (Gielen et al. 2007, 2008, 2009, 2011). Our radial velocity program is still ongoing, but we indeed confirmed the suspected high binary rate: for non-pulsating (or low-amplitude pulsating) objects, a binary rate of 100% was found (Van Winckel et al. 2009). The companion stars are likely un-evolved main-sequence stars, which do not contribute significantly to the energy budget of the objects. The orbital periods range from hundred to a few thousand days. The orbits are large enough so that the actual post-AGB stars fit into their Roche Lobes, but too small to accommodate AGB stars. The global picture that emerges is therefore that a binary star evolved in a system which is too small for a full AGB evolution. During a badly understood phase of strong interaction, a circumbinary dusty disc was formed, but the binary system did not suffer dramatic spiral in. What we now observe is an F-G post-AGB supergiant in a binary system, which is surrounded by a circumbinary dusty disc (e.g. Van Winckel 2003, and references therein). With these observed orbital characteristics, it is clear that binary interaction processes dominated their evolution and that these systems represent a late phase of binary evolution. The presence of a disc seems to be a prerequisite for the depletion process to occur, but not all disc sources are depleted.
A noticeable class of these depleted objects are dusty RV Tauri stars (Gonzalez et al. 1997a, b; Giridhar et al. 1998, 2000, 2005; Maas et al. 2005, 2002; Van Winckel et al. 1998; Gielen et al. 2007), which occupy the high luminosity end of the population II Cepheid instability strip (Lloyd Evans 1999). Their SEDs as well as their chemical abundance patterns suggested that dusty RV Tauri stars are also binaries surrounded by a dusty disc in which the visible star happens to be located in the population II Cepheid instability strip. Direct detection of binary motion in these pulsating stars is difficult, but the binary nature of well-known RV Tauri pulsators such as AC Her (Van Winckel et al. 1998), EP Lyr (Gonzalez et al. 1997a), RU Cen and SX Cen (Maas et al. 2002) is well established. It is important to realise that there are many RV Tauri pulsators without a clear dust excess nor with a chemical anomaly. There is no observational indication that also these objects are related to binarity.
In this paper, we focus on the poorly studied object IRAS 114720800 (Table 1). IRAS 114720800 was first suspected to be a post-AGB star based on its large infrared excess as measured by the Infrared Astronomical Satellite (IRAS). A low-resolution, low signal-to-noise ratio mid-infrared spectrum was measured with IRAS and it was classified as showing silicate emission (Kwok et al. 1997). It was unresolved in a mid-infrared imaging survey at a resolution of 1.3 (Meixner et al. 1999), and it was also spatially unresolved in a near-infrared (K band) imaging polarimetric survey at a resolution of 0.4 (Gledhill 2005), although it was found to be highly polarized. This object was included in a SiO maser survey but remained undetected (Ita et al. 2001). The spectrum of the central star is classified as a F5 Iab. The strength and shape of its IR excess, the silicate emission spectrum, as well as the high polarisation of the unresolved source led to its selection as a post-AGB disc source candidate (De Ruyter et al. 2006).
| (2000) | 11h 49m 48.038s |
|---|---|
| (2000) | -08o 17m 20.47s |
| l | 277.91o |
| b | +51.56o |
| m(v) | 11.17 |
| 0.55 |
We report here on our detailed study of this particular source. After introducing the observations (Sect. 2 ) and the SED (Sect. 3), we perform a detailed pulsation analysis (Sect. 4). The abundance determination is presented in Sect. 5 and the radial velocity monitoring results are presented in Sect. 6. We end the contribution with discussing and highlighting the most important findings in Sect. 7.
2 Observations
2.1 Visible-band photometry
Photometric observations of IRAS 114720800 were carried out at the Valparaiso University Observatory (VUO) from 1995 to 2008. These were made with the 0.4-m campus telescope and CCD camera using standard and filters. In the first several seasons the observations were made primarily with the filter and only occasionally with the filter, but beginning in 2000 the filter was used regularly. Unfortunately a problem arose with the filter and no data are available from 2000 to 2002. The object was not observed in 2007. The observations are on the Cousins photometric system.
Differential photometry was carried out to monitor brightness variations in IRAS 114720800 . The images were reduced using IRAF (Tody 1993), with standard bias and flat field calibration. An aperture of 11 was used for the photometry. Three comparison stars were monitored, with GSC 05517-00159 used as the main comparison (C1). All three stars appear to be constant in brightness, with C1 and C2 constant at the level of 0.01 mag based on their differential measurements. A total of 75 differential measurements were made with the filter (=0.012 mag), 69 with the filter ( =0.010 mag), and 44 () colour indices (=0.014 mag) were obtained. Standardized photometry of the comparison stars and IRAS 114720800 was carried out on two nights, 23 June 1994 at Kitt Peak National Observatory (KPNO) and 21 May 2009 at the VUO, and the standardized values are listed in Table 2. The precision in the two sets of standard magnitudes are 0.02 and 0.01 mag, respectively. The and photometry is on the Cousins system.
One can immediately see that IRAS 114720800 varies in brightness from these two observations (Table 2). This had been recognized earlier and the object has been assigned the variable star name AF Crt. It also varies in colour, with the object appearing bluer when fainter. This unusual behaviour is confirmed and discussed below. The standardized differential magnitudes are listed in Table 3.
| Object | GSC ID | Obs Date | ||||
|---|---|---|---|---|---|---|
| mag | mag | mag | mag | |||
| IRAS 114720800 | 05517-00133 | 11.60 | 0.82 | 0.51 | 0.56 | 23 Jun 1994 |
| 11.89 | 0.34 | 21 May 2009 | ||||
| C1 | 05517-00159 | 12.92 | 0.61 | 0.31 | 0.33 | |
| 12.95 | 0.36 | |||||
| C2 | 05517-00163 | 12.94 | 0.66 | 0.37 | 0.38 | |
| 12.96 | 0.40 | |||||
| C3 | 05517-00096 | 13.63 | 0.73 | 0.39 | 0.37 | |
| 13.67 | 0.44 |
3
| HJD - 2400000 | HJD - 2400000 | HJD - 2400000 | () | ||
|---|---|---|---|---|---|
| day | mag | day | mag | day | mag |
| 49840.6193 | 1.442 | 49873.5996 | 1.589 | 49873.5996 | 0.121 |
| 49860.6083 | 1.676 | 50191.6245 | 1.367 | 50191.6212 | 0.135 |
| 49867.6338 | 1.627 | 50591.6282 | 1.581 | 50591.6245 | 0.076 |
| 49868.6150 | 1.609 | 51347.6216 | 1.268 | 51347.6216 | 0.130 |
| 49872.5944 | 1.502 | 51678.6193 | 1.522 | 52732.6257 | 0.068 |
| 49873.5996 | 1.468 | 51679.5918 | 1.542 | 52741.6658 | 0.133 |
| 50175.6667 | 1.576 | 51690.6038 | 1.414 | 52763.6147 | 0.049 |
| 50191.6180 | 1.233 | 51704.5958 | 1.305 | 52780.5934 | 0.119 |
| 50588.6143 | 1.511 | 52043.6422 | 1.261 | 52781.6047 | 0.101 |
| 50590.5975 | 1.502 | 52044.6550 | 1.222 | 52782.5879 | 0.124 |
| 50591.6208 | 1.505 | 52046.6585 | 1.160 | 52786.6118 | 0.061 |
| 50603.6262 | 1.129 | 52058.6564 | 1.457 | 52787.5943 | 0.045 |
| 50894.6828 | 1.357 | 52059.6454 | 1.474 | 52789.5986 | 0.022 |
| 50909.7264 | 1.042 | 52068.6337 | 1.387 | 52792.6031 | 0.042 |
| 50921.6911 | 1.605 | 52069.6049 | 1.376 | 52795.5974 | 0.082 |
| 50927.6852 | 1.440 | 52074.6182 | 1.269 | 53098.6218 | 0.059 |
| 50938.6103 | 1.220 | 52380.6698 | 1.474 | 53110.6166 | 0.069 |
| 50945.6195 | 1.114 | 52397.6223 | 1.118 | 53119.6202 | 0.107 |
| 50952.6092 | 1.609 | 52401.6423 | 1.053 | 53143.5859 | 0.070 |
| 51249.7269 | 1.371 | 52404.6292 | 1.119 | 53152.5923 | 0.130 |
| 51252.7068 | 1.238 | 52409.6330 | 1.401 | 53159.5890 | 0.067 |
| 51257.7680 | 0.990 | 52415.6291 | 1.498 | 53160.5946 | 0.052 |
| 51261.6874 | 0.999 | 52416.5981 | 1.523 | 53170.5992 | 0.033 |
| 51267.6828 | 1.538 | 52426.5961 | 1.302 | 53463.6248 | 0.177 |
| 51275.6711 | 1.445 | 52432.6332 | 1.068 | 53469.6741 | 0.086 |
| 51282.7037 | 1.264 | 52709.6861 | 1.276 | 53474.6341 | 0.009 |
| 51299.6350 | 1.560 | 52732.6257 | 1.322 | 53511.5884 | 0.038 |
| 51308.6129 | 1.391 | 52741.6659 | 1.209 | 53513.6111 | 0.070 |
| 51318.6663 | 0.977 | 52763.6128 | 1.382 | 53517.6012 | 0.094 |
| 51325.6084 | 1.215 | 52780.5880 | 1.032 | 53521.6087 | 0.130 |
| 51326.6159 | 1.349 | 52781.6047 | 1.018 | 53522.6112 | 0.109 |
| 51337.6498 | 1.423 | 52782.5879 | 1.014 | 53789.8264 | 0.02 |
| 51347.6216 | 1.139 | 52786.6138 | 1.213 | 53844.6348 | 0.116 |
| 52732.6258 | 1.254 | 52787.5885 | 1.255 | 53846.6269 | 0.093 |
| 52741.6656 | 1.076 | 52789.5986 | 1.266 | 53849.5891 | 0.055 |
| 52763.6165 | 1.333 | 52792.6005 | 1.291 | 53851.6280 | 0.016 |
| 52780.5988 | 0.912 | 52795.5953 | 1.298 | 53863.6091 | 0.093 |
| 52781.6046 | 0.917 | 52806.6000 | 1.158 | 54562.5982 | 0.053 |
| 52782.5879 | 0.890 | 53098.6238 | 1.100 | 54571.5825 | 0.014 |
| 52786.6098 | 1.152 | 53110.6145 | 1.413 | 54572.6264 | 0.044 |
| 52787.6002 | 1.210 | 53119.6222 | 1.244 | 54578.5874 | 0.098 |
| 52789.5986 | 1.243 | 53143.5827 | 1.379 | 54586.6631 | 0.143 |
| 52792.6057 | 1.248 | 53151.6310 | 1.215 | 54615.6100 | 0.104 |
| 52795.5995 | 1.216 | 53152.5954 | 1.169 | 54619.6181 | 0.105 |
| 53098.6197 | 1.041 | 53159.5871 | 1.135 | ||
| 53110.6188 | 1.344 | 53160.5926 | 1.217 | ||
| 53119.6181 | 1.138 | 53170.5972 | 1.344 | ||
| 53143.5891 | 1.309 | 53463.6229 | 0.942 | ||
| 53152.5892 | 1.040 | 53469.6760 | 0.894 | ||
| 53159.5910 | 1.068 | 53474.6360 | 1.256 | ||
| 53160.5966 | 1.165 | 53511.5905 | 1.228 | ||
| 53170.6013 | 1.311 | 53513.5908 | 1.222 | ||
| 53463.6267 | 0.765 | 53517.5944 | 1.190 | ||
| 53469.6721 | 0.807 | 53521.6067 | 1.128 | ||
| 53474.6321 | 1.265 | 53522.6092 | 1.093 | ||
| 53511.5864 | 1.189 | 53789.8284 | 1.290 | ||
| 53513.6315 | 1.152 | 53844.6368 | 1.049 | ||
| 53517.6079 | 1.095 | 53846.6287 | 1.054 | ||
| 53521.6107 | 0.997 | 53849.5911 | 1.146 | ||
| 53522.6132 | 0.984 | 53851.6301 | 1.266 | ||
| 53789.8244 | 1.311 | 53863.6119 | 1.301 | ||
| 53834.6045 | 1.180 | 54562.6001 | 1.153 | ||
| 53844.6328 | 0.933 | 54571.5843 | 1.327 | ||
| 53846.6250 | 0.961 | 54572.6284 | 1.301 | ||
| 53849.5871 | 1.092 | 54578.5893 | 1.229 | ||
| 53851.6260 | 1.250 | 54580.6033 | 1.188 | ||
| 53863.6063 | 1.208 | 54586.6650 | 0.970 | ||
| 54562.5963 | 1.099 | 54615.6119 | 1.052 | ||
| 54571.5806 | 1.313 | 54619.6200 | 0.969 | ||
| 54572.6245 | 1.257 | ||||
| 54578.5856 | 1.131 | ||||
| 54586.6612 | 0.827 | ||||
| 54612.6158 | 1.042 | ||||
| 54615.6081 | 0.948 | ||||
| 54619.6161 | 0.864 |
2.2 Visible spectroscopy
The visual spectroscopy includes high signal-to-noise, high-resolution optical spectra obtained with UVES mounted on the 8m VLT telescope within ESO program number 65.L-0615(A). The spectra were obtained in service mode. We obtained full coverage from 380 nm up to 1000 nm in two spectrograph settings of 900 seconds each. An image slicer was used to mimic a narrow slit without compromising the throughput. We used the dedicated UVES pipeline to reduce the data in the standard steps for cross-dispersed echelle spectroscopic data. The final product of our reduction process is a normalised spectrum of the whole spectral coverage. Measured by the standard deviation of continuum windows in the spectrum, indicative numbers for the S/N are 180 at 550 nm, 100 at 410 nm and 160 at 660 nm. (An illustration of the quality of the spectra is given in Fig. 8 and Fig. 9.)
Spectral time-series observations of IRAS 114720800 were obtained with the Mercator telescope at the Roque de los Muchachos observatory. We used the HERMES spectrograph which was specifically designed for this 1.2-m telescope and which combines a very high throughput with a stable set-up in a temperature-controlled chamber (Raskin et al. 2011). The HERMES spectrograph project developed a dedicated reduction pipeline which we used for the spectral reduction. We obtained 49 radial velocity data points over the interval of time from 15 January 2010 to 14 January 2012. The integration times vary between 1200 and 3600 seconds depending on the local sky conditions. The object is quite weak for a 1.2 m telescope equipped with an instrument yielding a spectral resolution of 85000. The S/N ratios range from 10 to 30 at 550 nm and at full spectral resolution.
2.3 Mid-infrared spectroscopy
We obtained a ground-based N-band low-resolution spectrum with the TIMMI2 instrument mounted on the 3.6-m telescope of ESO at La Silla, Chile on 10 March 2004. Data reduction was performed in a standard way for the spatially unresolved source. The chop-nodding observing mode resulted in two negative and a double positive image of the spectrum on the detector. To correct for the variable transmission of the Earth’s atmosphere, we deployed the same method as described by van Boekel et al. (2005), and we obtained a spectrum of a calibrator star immediately before or after the science target and at very similar airmass.
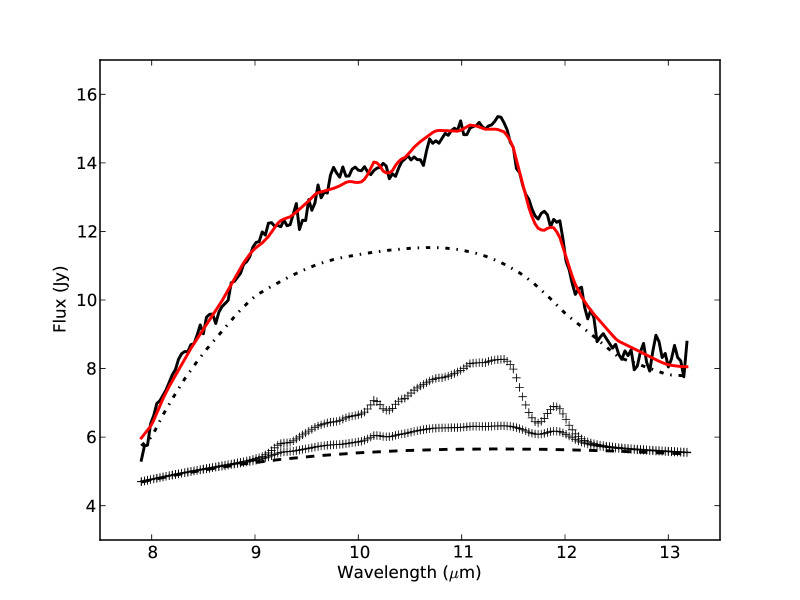
The result is a flux-calibrated, low-resolution, N-band spectrum, which is displayed in Fig. 1. The spectrum shows the clear signature of a silicate emission feature.
3 Spectral energy distribution
We used NASA’s Astrophysics Data System to complement our own data with fluxes available in the literature. IRAS 114720800 was detected, obviously, by IRAS and additional mid- and far-infrared data come from AKARI (Murakami et al. 2007). Near-infrared data were obtained from the 2MASS (Skrutskie et al. 2006) and the DENIS (Epchtein et al. 1997) projects. These are listed in Table 4.
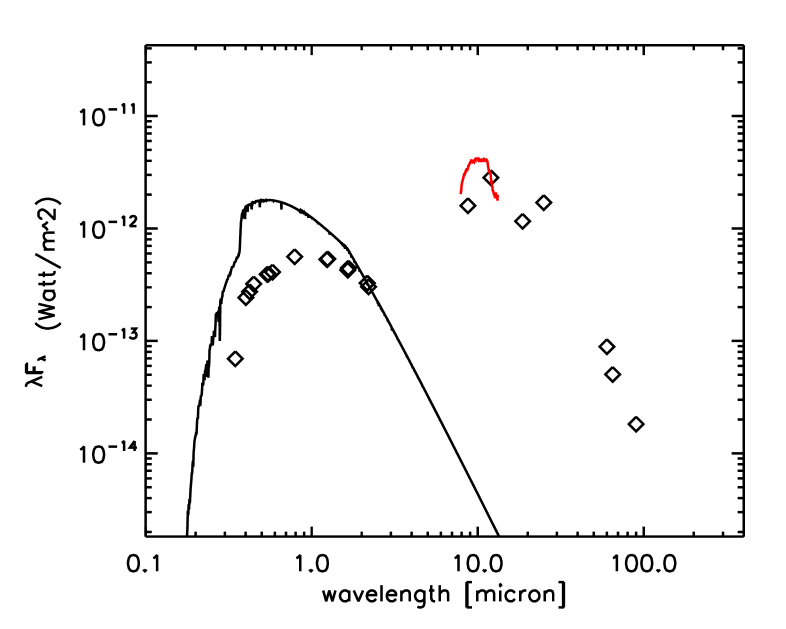
In Fig. 2 the SED is displayed. To guide the eye we matched a Kurucz model atmosphere (Castelli & Kurucz 2004) with appropriate model parameters (, and metallicity) to the K-band flux point. The model parameters were determined in our spectroscopic analysis (Section 5). Assuming that the K-band flux is not affected by reddening (interstellar nor circumstellar) and coming exclusively from the photosphere, the scaled photospheric model gives us a good measure of the unattenuated photospheric energy distribution. For the -band, this implies an attenuation of 1.6 mag. With a galactic latitude of +51.56° the ISM extinction in the line of sight towards IRAS 114720800 is estimated to be A (Drimmel et al. 2003).
The SED is unusual as the integrated photospheric model, scaled to the K band flux points, is about a factor of 6 less luminous than the integral of the thermal dust emission component. To investigate the possibility of a strong K reddening, we estimated the total reddening by minimising the difference between the scaled photospheric model and the dereddened data. We assume that the wavelength-dependent reddening follows the ISM reddening law and we scaled the model fluxes so that the mean of all the dereddened optical fluxes matches the scaled photospheric model. A total reddening of E()=0.44 +/- 0.01 is obtained. Also with this reddening, the dereddened fluxes are not high enough to provide the IR luminosity. We conclude that either the reddening law is vastly different from the ISM reddening law and includes a strong grey component or the energy budget of this system is not compatible with a geometry in which the optical attenuation is redistributed into the infrared. IRAS 114720800 appears to be an infrared source with an infrared luminosity which dominates the energetics of the source!
| filter | value | error | |
|---|---|---|---|
| m(J) | 1.25 m | 9.657 mag | 0.023 mag |
| m(H) | 1.66 m | 9.047 mag | 0.022 mag |
| m(K) | 2.16 m | 8.630 mag | 0.023 mag |
| IRAS12 | 12 m | 11.35 Jy | 5% |
| IRAS25 | 25 m | 14.18 Jy | 5% |
| IRAS60 | 60 m | 1.78 Jy | 5% |
| AKARI-S9W | 8.72 m | 4.64 Jy | 5% |
| AKARI-L18W | 18.63 m | 7.21 Jy | 5% |
| AKARI65 | 65.0 m | 1.09 Jy | 10% |
| AKARI90 | 90.0 m | 0.55 Jy | 10% |
4 Light curves and pulsational variability
The VUO differential light and colour curves are displayed in Fig. 3. They show variations within a season and from season to season. There is an approximately monotonic decrease in median brightness of 0.5 mag in over 13 years, perhaps reaching a minimum in 2005 and appearing approximately constant or perhaps increasing by a small amount in brightness from 2005 to 2008. The observations are very few in the early years, but show a decrease of 0.35 mag from 2000 to 2005 years. Both indicate that the decrease reached a minimum in 2005 and has levelled off or is showing a slight increase in brightness to 2008. If this is part of a long-term periodic variation, it must have a period longer than the 13-year observing interval. Surprisingly, the average differential () colour of the system from 2003 to 2008 (+0.07 mag) is bluer by 0.06 mag than it appeared in the few observations made during the first five years (+0.13 mag), even though the system is fainter on average by 0.3 mag between the earlier and later intervals of time.

Brightness variations in an individual season reach a range of up to 0.50.6 mag and appear to show a cyclical variation. An examination of the data from 2003 to 2008, when the overall brightness of the system is about the same, shows that it is redder when fainter in its cyclical variation, with a range in () colour of 0.15 mag. This is shown in Fig. 4. Thus the temperature change is approximately in phase with the brightness, getting cooler when it is fainter and hotter when it is brighter. The colour of the object from 2003 to 2008 varies within a range of 0.12 mag for most of the observations.

Additional observations are also available from the All Sky Automated Survey (ASAS; Pojmanski 2002)111http://www.astrouw.edu.pl/asas/. We used the measurements made with aperture 2, radius of two pixels (each pixel is 15 on the sky), and only the good quality data (grade of A or B). There were several sets of data for this object, but we confined ourselves to use the one large set with 420 data points. The others were small and were not included since we did not want to introduce possible offsets by combining the data. These observations were made from 2000 through 2009. A comparison was made with the VUO data on dates when the observations were made on the same nights or within one day. These show an offset, with the ASAS data consistently brighter by 0.12 mag. It is not known whether this is the result of a calibration problem or perhaps the inclusion of an additional star(s) in the larger ASAS aperture () used for photometry. The closest bright star is the comparison star that we used, which is 31 away, and it is possible that some of its light might be included in the ASAS aperture. We subtracted this offset from the ASAS data to combine the two data sets. This combined light curve is shown in Fig. 5.

One can see more clearly in the combined light curve the overall general decrease in brightness by 0.6 mag in from 1995 to 2009, with typical variations within a season of 0.6 mag peak-to-peak. The past seven seasons also appear to show a seasonal modulation in average system brightness on the order of 0.1 mag.
These light curves were examined for periodicity. Visual inspection of the VUO data showed variations that appeared to be consistent with a cyclical variability but were too few in any season to get a sense if it is periodic. However, with the addition of the numerous data from ASAS, one can see more clearly a cyclical variation of length 3035 d in the data.
The light curves were formally analyzed for periodicity using the Period04 program (Lenz & Breger 2005) and in some cases using the CLEAN program (Roberts et al. 1987), with consistent results. We first removed the long-term trend in the light curves by normalizing each of them to their average seasonal values. Analysis of the VUO data resulted in well-determined period values of 31.160.01 day () and 32.180.04 day (). Analysis of the ASAS data resulted in a very well-determined period of 31.100.01 day. Analyzing the entire data set (VUO and ASAS), we find a period of 31.140.01 day. (This changes very slightly to 31.150.01 day if we assign to the VUO data three times the weight of the ASAS data based on their superior precision.)


An examination of the combined light curve with the period of 31.14 d showed that the fit was not good for some of the years, especially the 2000-2001 season. To investigate this further, we first analyzed the data season by season for the data sets that had 30 or more points, which were the seasons 2000-2001 to 2008-2009, excluding 2001-2002 (10 points). They showed rather similar periods but changes in the amplitudes and phases. They also revealed a second period of about half that of the first, which we interpret as an attempt to account for the non-sinusoidal shape of the pulsation curve. We then, secondly, fixed the period at the value found for the entire data set and investigated the seasonal values for amplitude and phase. We found a good fit for all of the years individually by allowing for a change in phase. For all but 2000-2001, the phase change was within a range of 0.17 . Examining the VUO 1995-1999 data together with the same period, which we had not initially included since none of the seasons had 30 or more data points, we also find a similar phase. However, the 2000-2001 ASAS data show a phase change differing from the average of the others by 0.40 (12.5 days). Apparently there occurred a phase or period change that only affected the 2000-2001 and perhaps the 2001-2002 data, while for the rest of the years the period and phase are relatively stable. Determining the period based on the 1995 to 1999 and 2002-2003 to 2008-2009 data combined, but excluding the 2000-2001 and 2001-2002 data, we find = 31.160.01 day. The frequency spectrum based on these data and the data phased to this period are shown in Fig. 6. The slight spread in the light curve shows the effects of the smaller seasonal phase shifts present in the remaining light curve data. There are much weaker secondary periods of 31.55 and 15.57 days, which likely are attempts to correct for the secondary effects of the remaining phase shifts and the non-sinusoidal shape of the light curves, respectively.
A recent light curve study of IRAS 114720800 has been published by Kiss et al. (2007) as part of their study of pulsating post-AGB binary stars. They determined a similar period of 31.50.6 d based on the ASAS data from 2000 to 2004 and some unfiltered Northern Sky Variability Survey (NSVS; Woźniak et al. 2004)222http://skydot.lanl.gov/nsvs/nsvs.php data from the 1998-1999 and 1999-2000 seasons, and they classified the object as a Population II Cepheid. They also cited strong phase variations in the pulsation phase. We confirmed the period found by them based on the smaller data set. However, the addition of our earlier data shows more clearly the decrease in system brightness, the addition of our multicolour observations document the corresponding change in system colour, and the larger data set results in a higher precision in the determination of the period.
Following the lead of Kiss et al. (2007), we show in Fig. 7 the seasonal phase variations in the pulsational light curves, assuming a fixed period of 31.16 day. The phases have an arbitrary zero point; it is the variations in the phase that are significant. We folded on = 2,449,000JD with a frequency of 0.032092307. .0We have also included the phase shift determined by using this period with NSVS data from 1999 to 2000. The NSVS data show phase values between the relatively close values found for the 2002-2003 to 2008-2009 data and the much different 2000-2001 value.

5 Chemical abundance study
The UVES spectrum with the wide coverage and high S/N (see examples in Fig. 8, 9) was used to obtain the photospheric chemical abundances. We used the same method which we have previously described in detail (e.g., Van Winckel & Reyniers 2000; Reyniers & Van Winckel 2003, 2007; Hrivnak et al. 2008). In short, we use the measured equivalent widths of small and single atomic lines and obtained abundances for a wide range of elements by matching the theoretical equivalent widths to the observed ones. The model photospheres were obtained from the Kurucz ATLAS9 suite (Castelli & Kurucz 2004). We used the 2009 version of MOOG (Sneden 1973)333http://www.as.utexas.edu/chris/moog.html to determine the abundances.
Model atmosphere parameters were determined in the usual spectroscopic way. In an iterative process, we fine-tuned the atmospheric model parameters for which the abundances are independent of excitation level, ionisation stage, and relative strength. We strictly limited the analysis to lines with equivalent widths smaller than 120 mÅ.
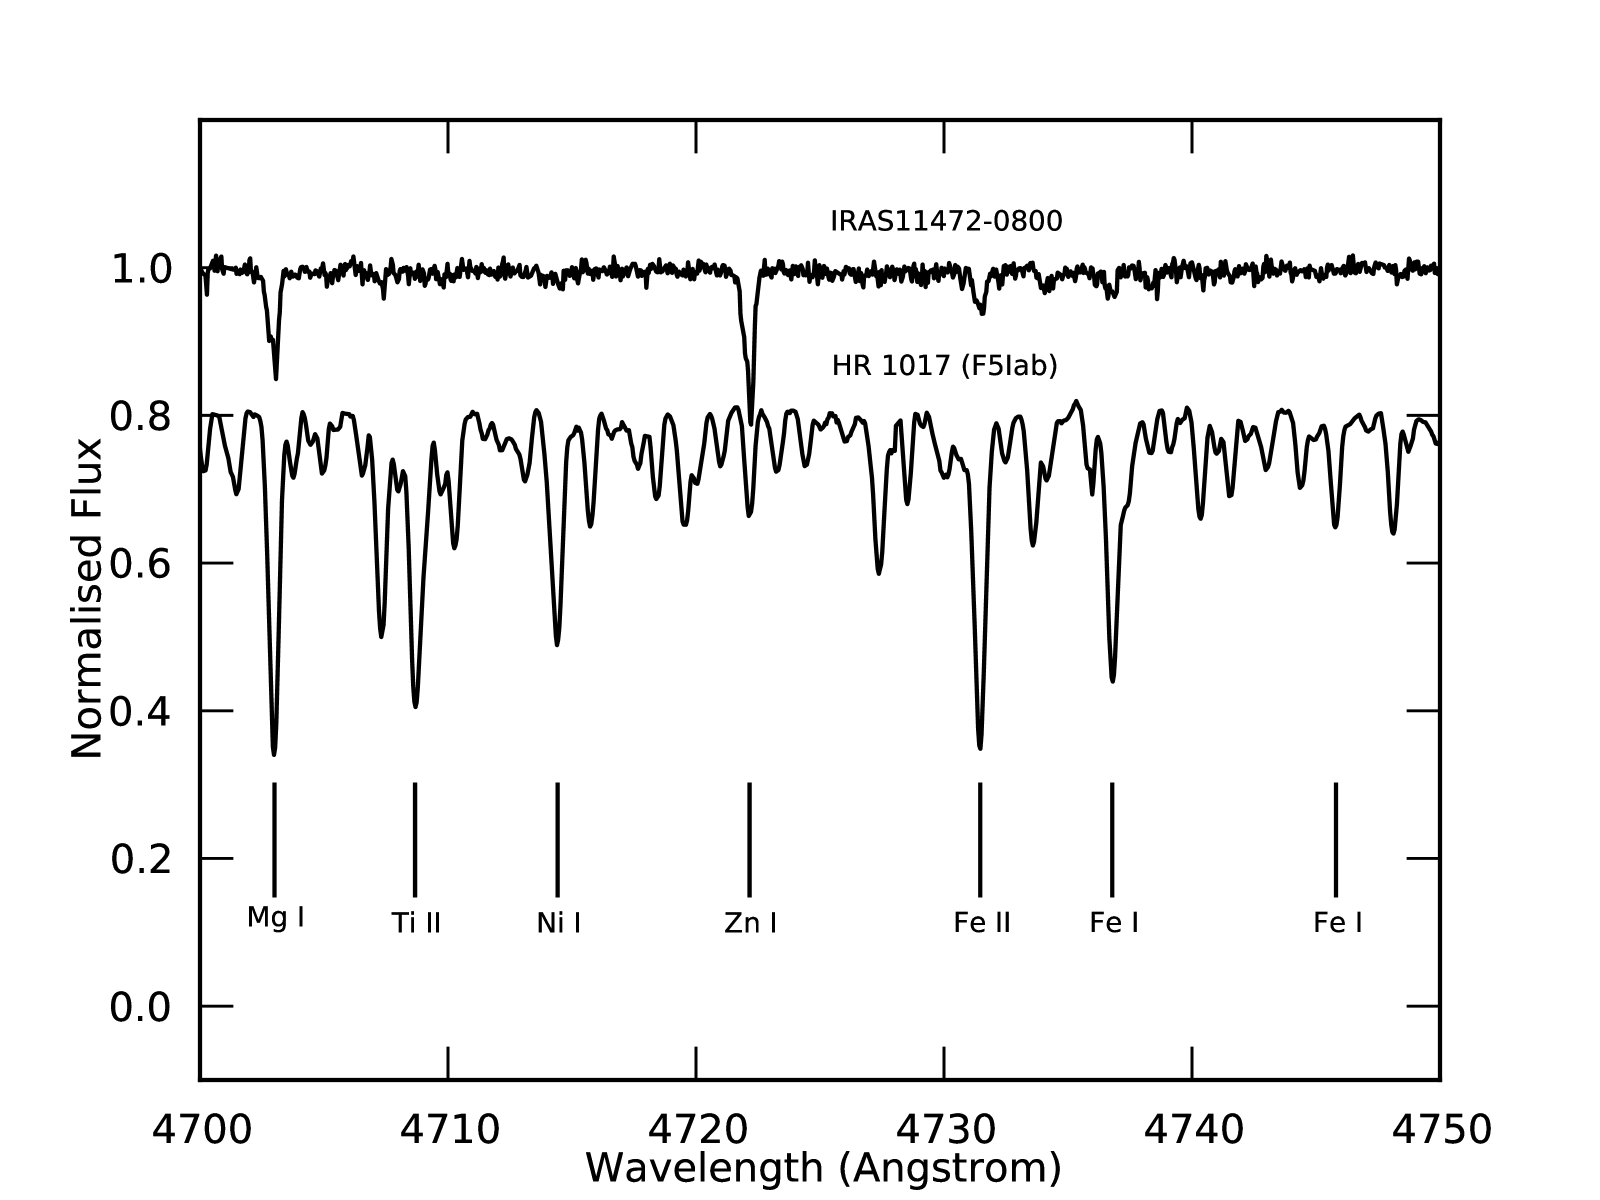
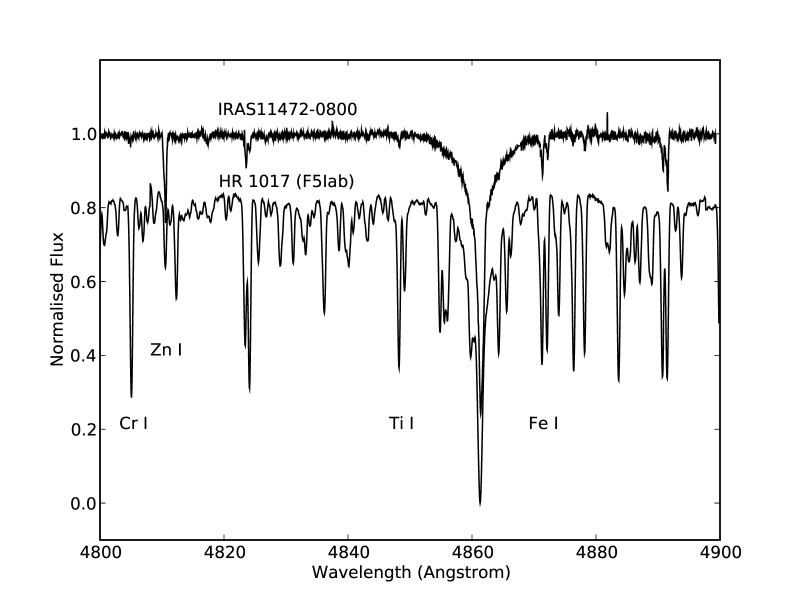
The low abundances of most elements and relatively high zinc abundance ([Zn/Fe]=+1.8) are illustrated in the spectra around and around H, which are depicted in Figs. 8 and 9, respectively. The comparison star is HR1017 which has similar spectral type, but solar abundances. The final abundances of IRAS 114720800 are given in Table 5. In the different columns we list the ion, the number of used lines, the mean equivalent width, the obtained abundance, and the line-to-line scatter. In the other columns the relative value with respect to the Sun is given as well as the dust condensation temperatures from Lodders (2003). The latter are computed in equilibrium with a solar mixture and under a constant pressure of 10-4 atm.
| Ion | N | Wλ | [X/H] | a𝑎aa𝑎aAsplund et al. (2009) | Tcondb𝑏bb𝑏bLodders (2003) | ||
|---|---|---|---|---|---|---|---|
| C i | 13 | 47 | 7.99 | 0.12 | 0.44 | 8.43 | 40 |
| O i | 3 | 40 | 8.59 | 0.10 | 0.10 | 8.69 | 180 |
| Na i | 5 | 14 | 5.28 | 0.12 | 0.96 | 6.24 | 958 |
| Mg i | 2 | 67 | 5.45 | 0.03 | 2.15 | 7.60 | 1336 |
| Al i | 1 | 139 | 3.50 | … | 2.95 | 6.45 | 1653 |
| Si i | 2 | 10 | 6.34 | 0.24 | 1.17 | 7.51 | 1310 |
| S i | 6 | 28 | 6.67 | 0.11 | 0.45 | 7.12 | 664 |
| Ca i | 4 | 16 | 3.62 | 0.10 | 2.72 | 6.34 | 1517 |
| Sc ii | 1 | 34 | 1.09 | … | 4.24 | 3.15 | 1659 |
| V ii | 1 | 34 | 1.64 | 0.16 | 2.29 | 3.93 | 1582 |
| Cr i | 2 | 61 | 2.68 | 0.01 | 2.96 | 5.64 | 1296 |
| Mn i | 4 | 22 | 3.42 | 0.11 | 2.01 | 5.43 | 1158 |
| Fe i | 43 | 28 | 4.79 | 0.15 | 2.71 | 7.50 | 1334 |
| Fe ii | 18 | 40 | 4.87 | 0.14 | 2.63 | 7.50 | 1334 |
| Cu i | 1 | 11 | 2.60 | … | 2.39 | 4.19 | 1352 |
| Zn i | 3 | 80 | 3.67 | 0.13 | 0.89 | 4.56 | 726 |
| Ba ii | 3 | 32 | 1.15 | 0.08 | 3.33 | 2.18 | 1455 |
6 Radial Velocity Analysis
The radial velocities are based on the spectral time series obtained with the HERMES spectrograph (Raskin et al. 2011). The extreme depletion means that only very few lines are strong enough to be detected in these spectra of low signal-to-noise (S/N varies between 10 and 30 at wavelength of maximal spectral throughput). Cross-correlating the spectrum with a spectral mask, tailored on the basis of the extensive list of weak lines present in the chemical peculiar star and measured on the UVES high S/N spectrum, failed; too few strong lines are present in the spectrum and only those lines are detectable in the low S/N spectra.
We therefore based our radial velocity determination only on the strong Mg I lines ( = 5167.32, 5167.487, 5172.684, 5169.296 and 5183.604 Å), and adopted the quality criterion so that the S/N of the spectrum, the cross-correlation width, standard deviation and depth should be within 3 standard deviations of their mean values. This resulted in 49 good radial velocity points over a total time-frame of 730 days. The individual radial velocity data points are given in Table 6.
6
| HJD - 2400000 | vrad | error | HJD - 2400000 | vrad | error |
|---|---|---|---|---|---|
| day | km s-1 | km s-1 | day | km s-1 | (km s-1) |
| 55211.7413079 | 42.61 | 0.85 | 55664.4513216 | 19.76 | 0.36 |
| 55211.7767163 | 41.99 | 1.18 | 55664.4750508 | 19.84 | 0.39 |
| 55216.7432261 | 40.13 | 0.77 | 55684.4660032 | 31.89 | 0.98 |
| 55216.7577181 | 39.48 | 0.76 | 55684.4978335 | 32.57 | 0.76 |
| 55251.6714953 | 33.50 | 0.99 | 55688.4326792 | 21.38 | 0.44 |
| 55293.5673953 | 29.18 | 0.48 | 55688.4645092 | 20.85 | 0.70 |
| 55298.5359750 | 33.80 | 0.48 | 55690.4026638 | 20.83 | 0.66 |
| 55319.4441090 | 22.78 | 0.43 | 55690.4344930 | 20.54 | 0.45 |
| 55319.4838188 | 23.08 | 0.43 | 55693.3987808 | 22.08 | 0.52 |
| 55334.3990715 | 37.91 | 0.49 | 55693.4306107 | 22.13 | 0.40 |
| 55568.7406503 | 17.25 | 0.47 | 55696.3990050 | 23.02 | 0.43 |
| 55571.7096404 | 20.73 | 0.40 | 55696.4308346 | 23.08 | 0.48 |
| 55572.6937496 | 23.01 | 0.43 | 55707.3988811 | 34.05 | 0.51 |
| 55573.6638451 | 24.53 | 0.48 | 55714.3965047 | 33.21 | 0.55 |
| 55574.7235709 | 27.71 | 0.49 | 55718.3949237 | 27.76 | 0.70 |
| 55576.6803859 | 30.03 | 0.47 | 55718.4198083 | 28.33 | 0.67 |
| 55610.6751655 | 33.00 | 0.34 | 55722.3882184 | 18.94 | 0.81 |
| 55622.6297044 | 23.15 | 0.58 | 55744.3893212 | 39.25 | 0.67 |
| 55622.6646696 | 22.75 | 0.69 | 55745.3902829 | 38.85 | 0.71 |
| 55650.5283546 | 26.94 | 0.99 | 55935.7368893 | 36.37 | 0.89 |
| 55653.4768158 | 20.37 | 0.53 | 55935.7687243 | 35.80 | 0.84 |
| 55654.4859780 | 20.29 | 0.55 | 55938.7509075 | 26.61 | 0.69 |
| 55658.4988853 | 17.99 | 0.45 | 55938.7822517 | 23.46 | 0.66 |
| 55661.5154086 | 16.28 | 0.37 | 55941.7087357 | 23.96 | 0.53 |
| 55661.5287215 | 17.29 | 0.34 |
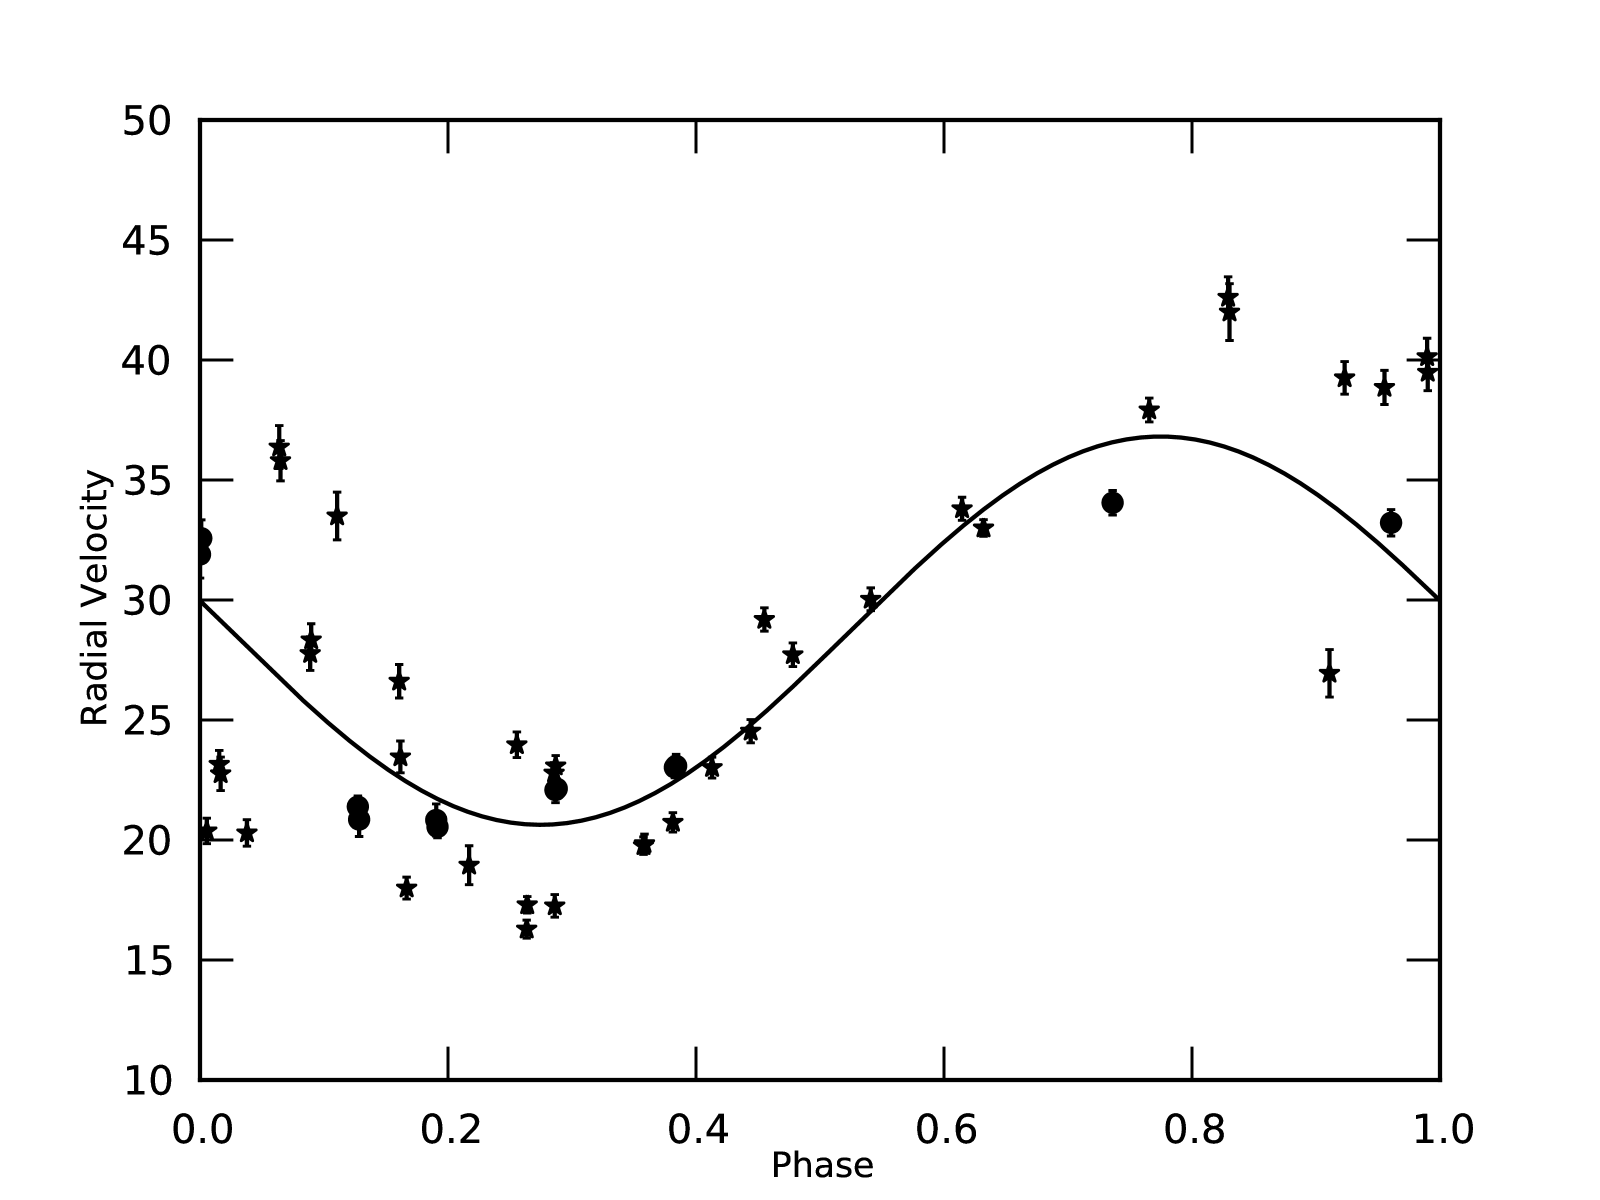
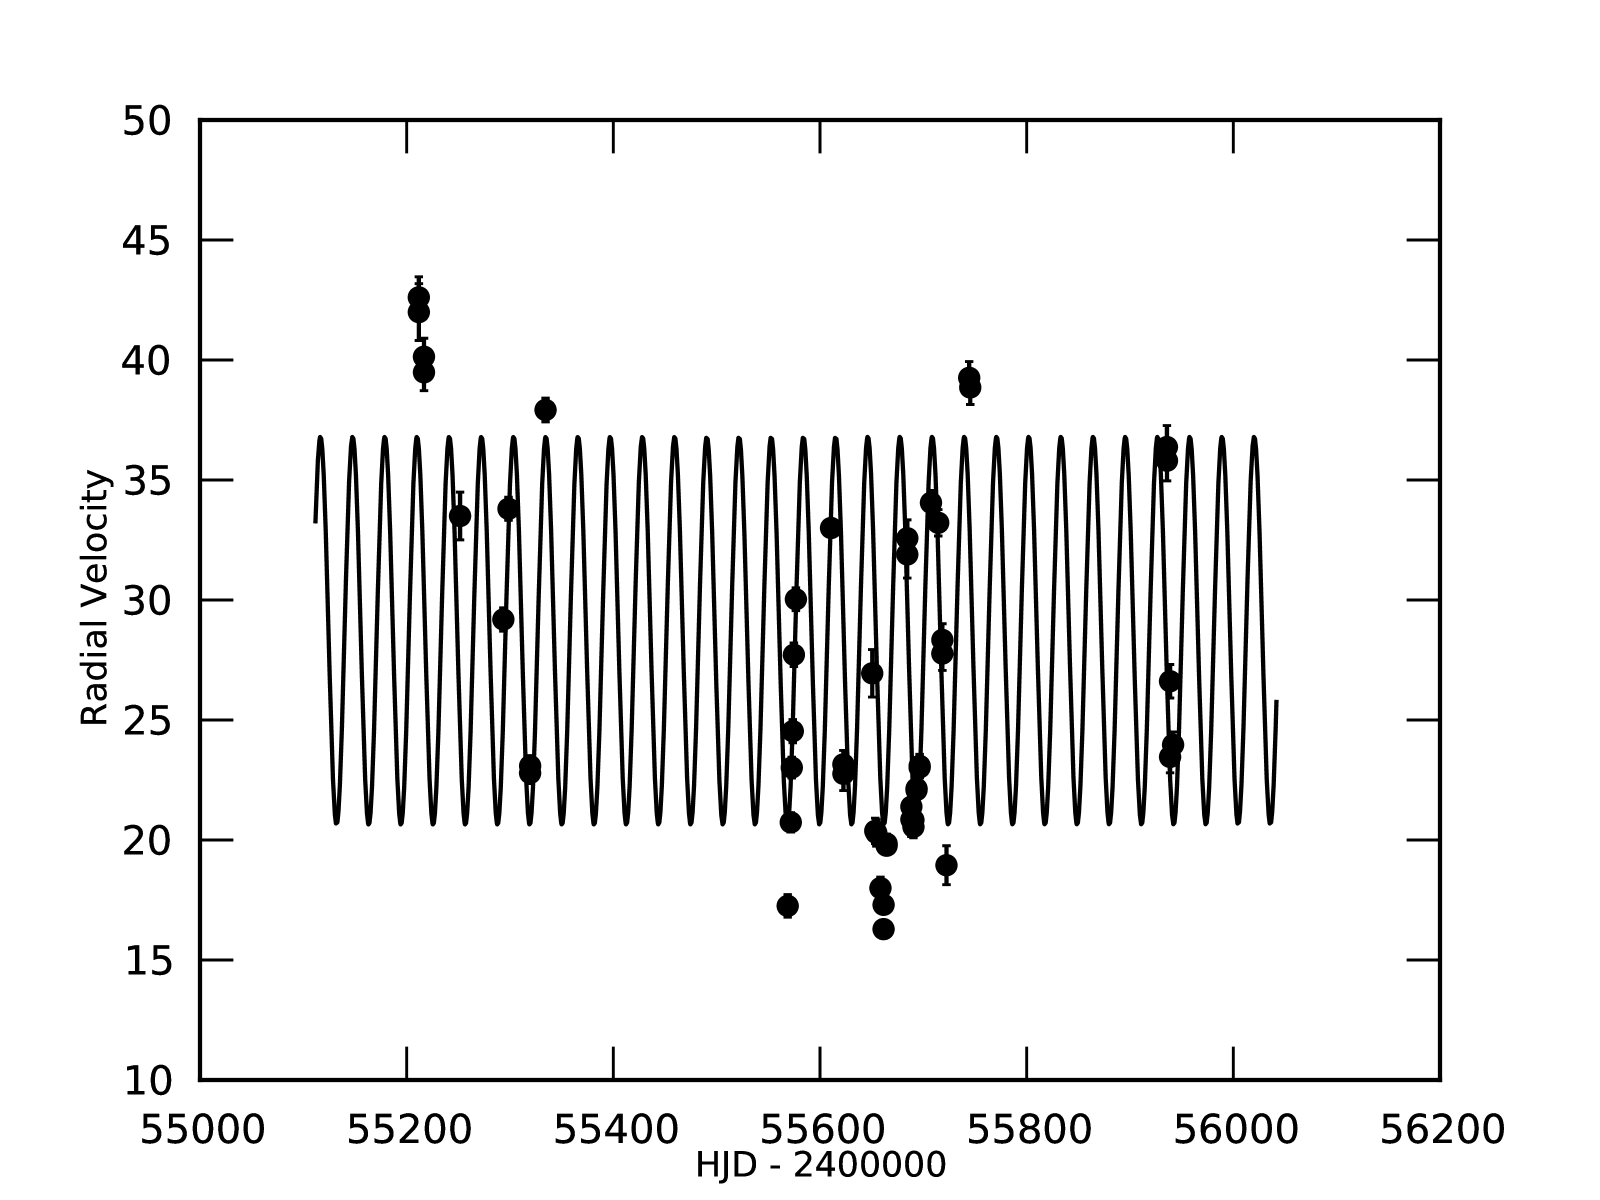
The object is clearly variable in radial velocity, and in Fig. 10 we show the data folded on the pulsation period of 31.16 days. The sine curve is based on the fit of a single, isolated, well-sampled cycle, the data of which are indicated with a different symbol on the plot. The signature of the pulsation is clearly visible in the radial velocity data, but the cycle-to-cycle variability is significant. This is also seen in Fig. 11, where the same sine curve fit is compared to the radial velocity data plotted over time. The photometric period appears to be a good fit, but some of the data in the different seasons fall systematically outside the pulsation curve model.
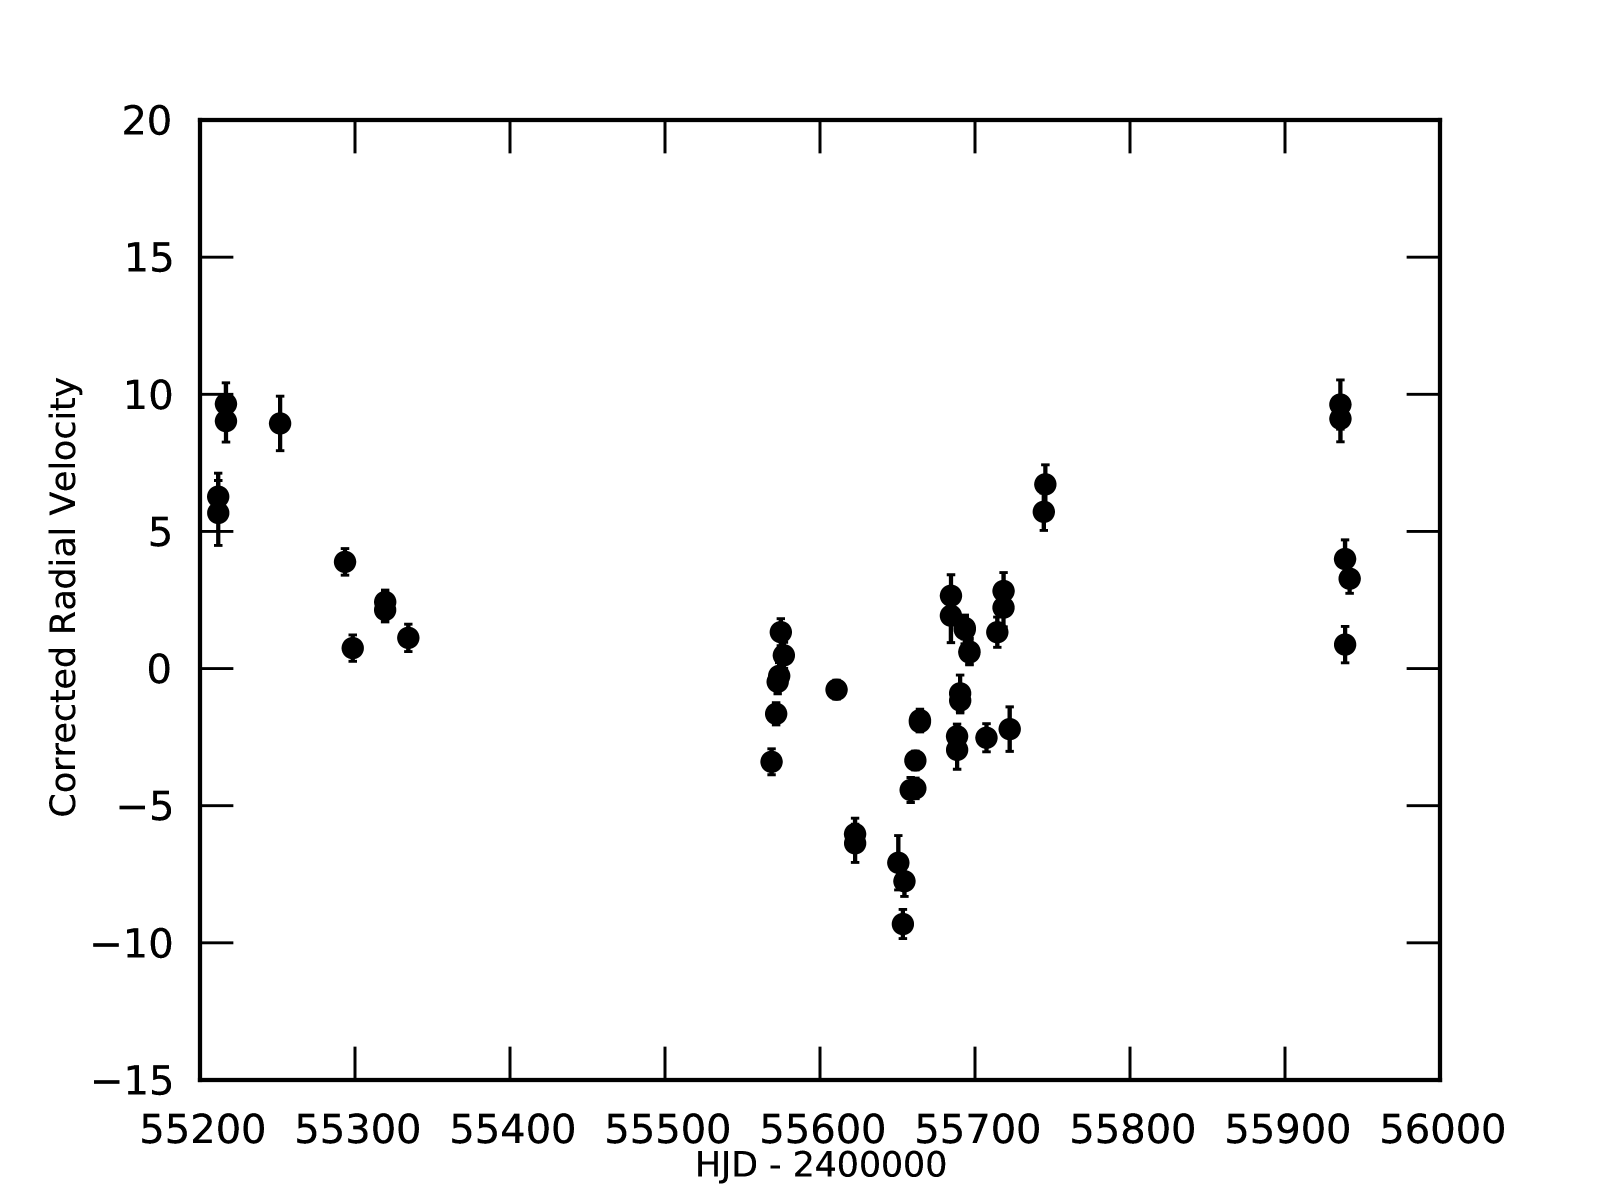
This is seen more clearly when one removes the sine curve and examines the residuals, as shown in Fig. 12. They suggest longer time scale systematic effects, perhaps of a cyclical nature. Although the data do not cover an entire cycle, we think that they are likely due to orbital motion, based on the similarity of this star to others that have been found to be binary.
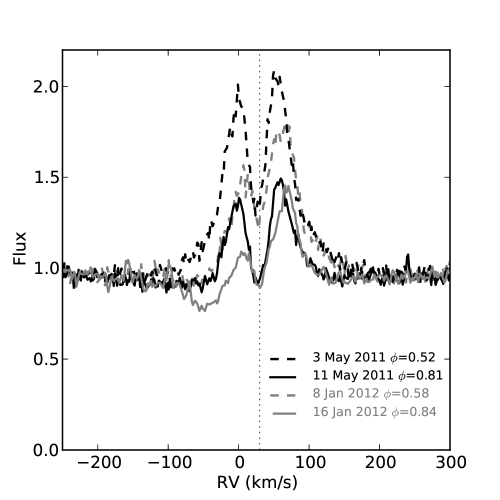
Continuum-normalized representative profiles of H are show in Fig. 13. The dotted line marks the systemic velocity. The strength of the double-peak emission correlates with the pulsation phase, but significant cycle-to-cycle variations are also observed, which may be related to the orbital motion.
The confirmation and determination of the orbital period of IRAS 114720800 will need a significantly longer time series with appropriate sampling. The current season has just started and we will continue to monitor this object.
7 Discussion
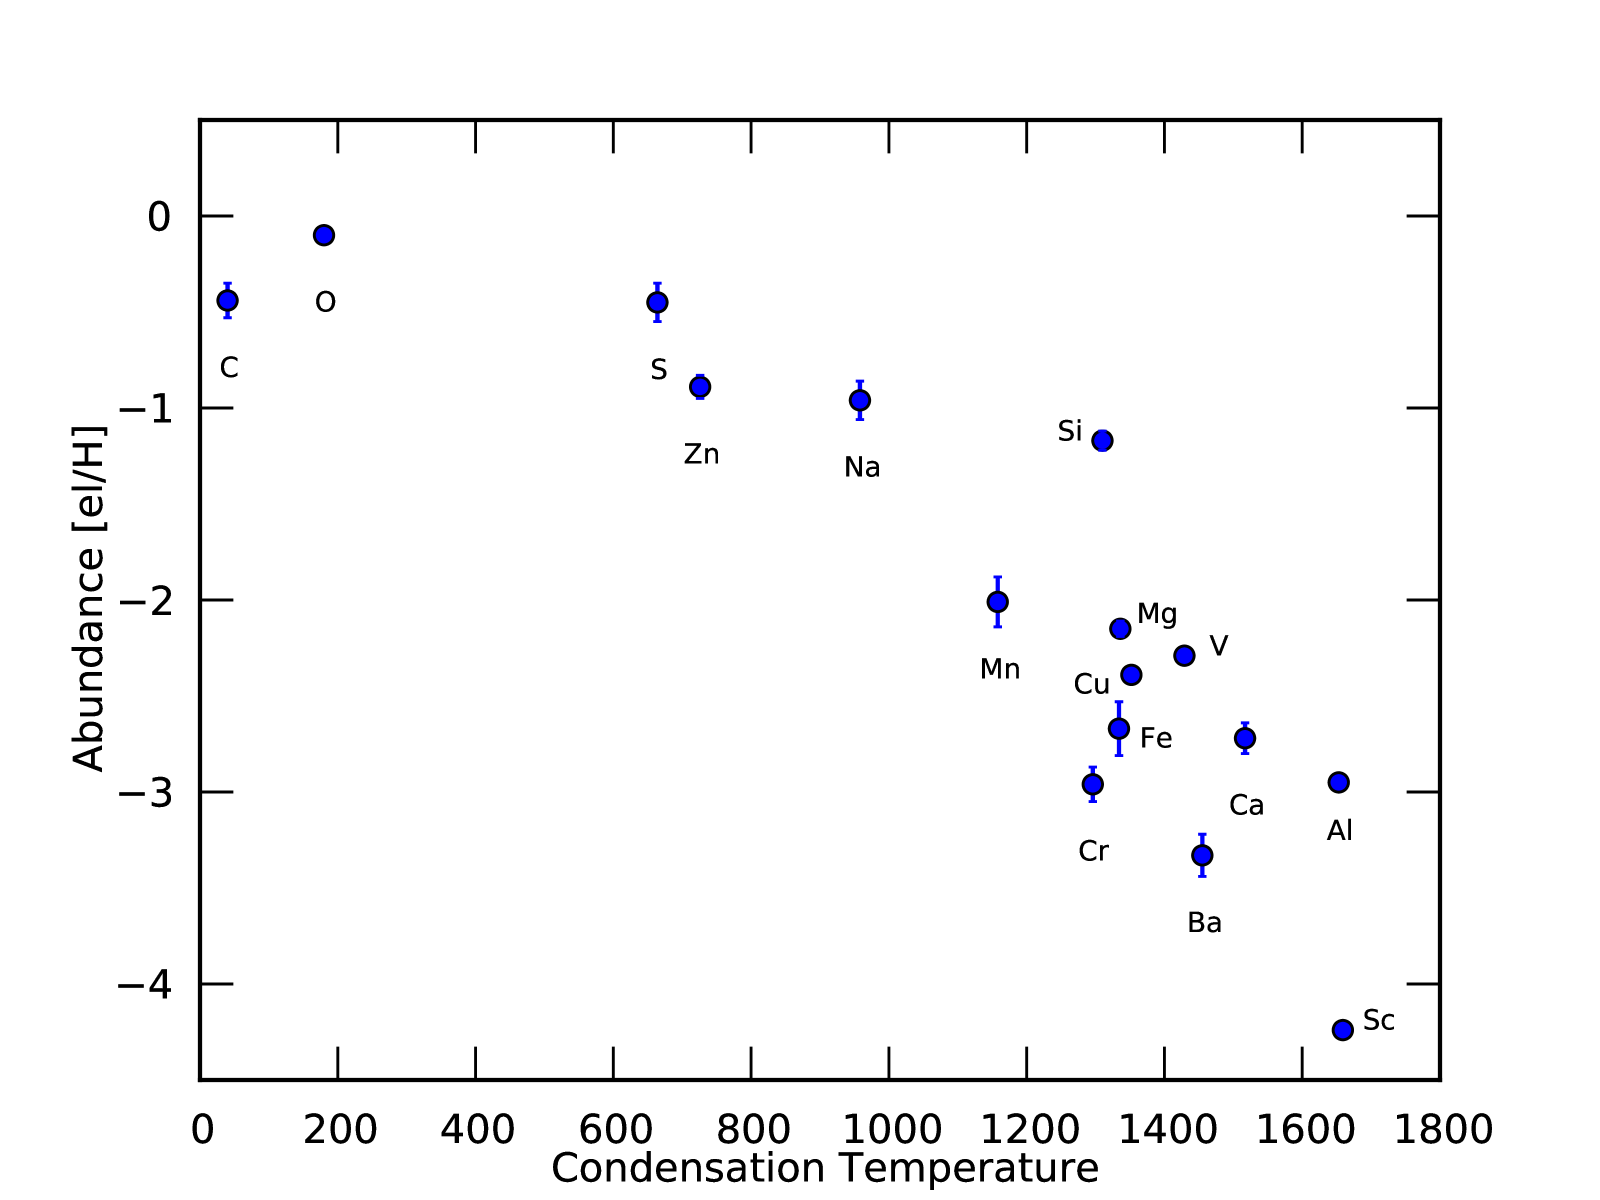
With [Fe/H]=2.7, [Cr/H]=3.0, [Sc/H]=4.2, [Ba/H]=3.3 and the strong correlation of the abundances with dust condensation temperature (Fig. 14), IRAS 114720800 is one of the most depleted objects known to date!
Another outstanding property of this object is the SED (Fig. 2), showing that the thermal emission of the circumstellar dust dwarfs in luminosity the dereddened photospheric emission. The infrared excess is warm and the silicate spectrum is very similar to the strongly processed silicates analysed by Gielen et al. (2011, and references therein). The warm excess, peaking at about 300K and coming from dust close to the star, and also the spectral properties of the grains are clear indications that the circumstellar dust is trapped in a disc. Given the energetics, our aspect angle towards the disc is likely close to edge-on and the small optical flux we detect may very well be dominated by scattered light. Evolved objects with trapped dust in a disc and similar viewing angles are the Red Rectangle (e.g. Cohen et al. 1975, 2004), IRAS20056+1834 (e.g. Menzies & Whitelock 1988; Kameswara Rao et al. 2002) and IRAS17233-4330 (e.g. De Ruyter et al. 2006; Gielen et al. 2008), which are indeed all sources where the infrared luminosity dominates over the dereddened photometry. However, apart from the Red Rectangle, the other objects are much less chemically depleted if at all.
It is by now well known that the stable disc environment facilitates strong dust grain processing, and IRAS 114720800 is no exception. We lack a wide spectral coverage of our IR spectroscopy. To model the spectrum, we employ the same technique as Gielen et al. (2008, 2011), and assume that the silicate feature can be decomposed in the optically-thin regime by adding the spectral contributions of different dust species with a range of grain sizes. We limited our analysis using three grain sizes (0.1/2/4 m). Our decomposition shows (Fig. 1) that the silicate feature is dominated by large amorphous grains with a significant contribution of crystalline forsterite, which is responsible for the clear 11.3 m signature. The presence of these highly processed silicate grains is a mainstream characteristic of disc sources with evolved central stars (e.g., Gielen et al. 2011, and references therein) and IRAS 114720800 proves not to be an exception.
Further evidence for a compact, optically-thick disc seen nearly edge-on is found in the near-infrared imaging polarimetric study by Gledhill (2005). The object is found to be strongly polarized, with a maximum polarization of 10 % in J and 8 % in K and integrated polarization of 6 % in each; since it is out of the galactic plane ( = +51.6°) and stars in the same direction have little polarization, this is judged to be essentially entirely intrinsic. The source is unresolved with a polarisation pattern like that arising from a small disc and with a strong scattering component.
The system has the unusual property of being bluer in general when it is fainter, a condition not expected if the only mechanism operating is extinction by dust. However, also this can be understood if the extinction is accompanied by scattering into the line of sight which comes to dominate the colour even more when the object is globally fainter. Such a change in colour of becoming bluer when fainter is seen in some Herbig Ae stars and is suggested indeed to be due to dust scattering. Bibo & The (1990) derive a model in which extra blue light is derived from scattering by fine dust in the circumstellar envelope and the overall dimming of the light is due to orbiting opaque dust clouds. In a variation of this model, it is the orbit of the star itself that changes the overall extinction and dimming of the direct light rather than orbiting dust clouds. If the star is orbiting within a disc, then one can easily imagine a phase dependence in the brightness as light received passes though differing amounts of the dust. However, if this is a uniform disc, then one would expect to see the system return to its earlier brightness level. If the very long timescale as observed in the photometric monitoring is indeed linked to an orbital period, this period is in the order of 14 years or longer. This is significantly longer than the orbital periods found for measured post-AGB stars found binary systems, which range from 100 to 3000 days (Van Winckel 2007; Van Winckel et al. 2009).
The radial velocity variations are dominated by the pulsations, but we did discover a longer term trend which we interpret as due to orbital motion. The interpretation of this longer term trend is not straightforward, as the measured velocity, is not the radial compoment of the velocity of the star due to the dominant scattered light. It is therefore difficult to de-project the amplitude of the radial velicity to the putative orbital plane. We will continue to monitor this source to discover, hopefully, the long-term period as well as the orbital elements of the binary.
The pulsation period and spectral properties put IRAS 114720800 in the realm of the RV Tauri stars, despite the fact that we do not find evidence in the light curve for the characteristic succession of deep and shallow minima. Similar RV Tauri pulsators do exist, however, and a particular good example is MACHO14.9582.9 in the LMC (J053932.79-712154.4) with a very similar period (31.127 d.) and light curve (Alcock et al. 1998). Also this object has a clear infrared excess but the aspect angle is different as can be seen from the SED (van Aarle et al. 2011). The RV Tauri stars form a PL relation of their own (Alcock et al. 1998; Buchler et al. 2009), and when we apply the PL relation of the LMC and use MACHO14.9582.9 as a proxy of IRAS 114720800 , we deduce a luminosity of 2000 L⊙. Adopting the total integral of the raw SED of IRAS 114720800 as a good estimate of the total luminosity, we obtain a distance of about 2 kpc for this source.
We conclude that the hitherto poorly studied IRAS 114720800 is a strongly depleted evolved star, which is surrounded by a stable dusty disc. The object is a regular pulsator with a period of 31.16 d which is in the regime of the population II Cepheids at the lower luminosity tail of the RV Tauri stars. The light curve does not show the alternation of deep and shallow minima which is characteristic of RV Tauri objects. The energetics of the SED as well as the colour behaviour of the long-term trend in the multi-colour photometry shows that the viewing angle to the system is close to edge-on, which means that the optical flux is dominated by scattering. The pulsations are well recovered in our radial velocity time-series, and we interpret the systematic residual velocities as due to orbital motion. The orbital parameters are not yet determined. With its low luminosity and regular systematic period of 31.16d, we conclude that IRAS 114720800 is a low-luminosity analogue of the dusty RV Tauri stars.
Acknowledgements.
We thank W. Zima for a help discussion about period analysis and using Period04. HVW acknowledges financial support from the Research Council of K.U.Leuven under grant GOA/2008/04 and from the Scientific Fund of Flanders (FWO) under the grants G.0703.08 and G.0470.07. BJH acknowledges ongoing financial support from the National Science Foundation (most recently through AST 1009974). Long-term monitoring is only possible thanks to the dedicated efforts of many observers. The authors want to acknowledge following people who contributed to obtaining the HERMES data: Bram Acke, Fabio Barblan, Steven Bloemen, Nick Cox, Peter De Cat, Pieter Degroote, Ben Devries, Laurent Eyer, Yves Fremat, Patricia Lampens, Robin Lombaert, Pieter Neyskens, Péter Pápics, Kristof Smolders, Andrew Tkachenko, Christoffel Waelkens as well as the whole local Mercator team. We also acknowledge the observing contribution of many undergraduate research students at Valparaiso University. This research has made use of the SIMBAD database, operated at CDS, Strasbourg, France, and NASA’s Astrophysics Data System.References
- Alcock et al. (1998) Alcock, C., Allsman, R. A., Alves, D. R., et al. 1998, AJ, 115, 1921
- Asplund et al. (2009) Asplund, M., Grevesse, N., Sauval, A. J., & Scott, P. 2009, ARA&A, 47, 481
- Bibo & The (1990) Bibo, E. A. & The, P. S. 1990, A&A, 236, 155
- Bond & Luck (1987) Bond, H. E. & Luck, R. E. 1987, ApJ, 312, 203
- Buchler et al. (2009) Buchler, J. R., Wood, P. R., & Soszyński, I. 2009, ApJ, 698, 944
- Castelli & Kurucz (2004) Castelli, F. & Kurucz, R. L. 2004, ArXiv Astro-ph/0405087
- Cohen et al. (1975) Cohen, M., Anderson, C. M., Cowley, A., et al. 1975, ApJ, 196, 179
- Cohen et al. (2004) Cohen, M., Van Winckel, H., Bond, H. E., & Gull, T. R. 2004, AJ, 127, 2362
- De Ruyter et al. (2006) De Ruyter, S., Van Winckel, H., Maas, T., et al. 2006, A&A, 448, 641
- Deroo et al. (2006) Deroo, P., Van Winckel, H., Min, M., et al. 2006, A&A, 450, 181
- Deroo et al. (2007) Deroo, P., Acke, B., Verhoelst, T., et al. 2007, A&A, 474, L45
- Drimmel et al. (2003) Drimmel, R., Cabrera-Lavers, A., & López-Corredoira, M. 2003, A&A, 409, 205
- Epchtein et al. (1997) Epchtein, N., de Batz, B., Capoani, L., et al. 1997, The Messenger, 87, 27
- Gielen et al. (2007) Gielen, C., Van Winckel, H., Waters, L. B. F. M., Min, M., & Dominik, C. 2007, A&A, 475, 629
- Gielen et al. (2008) Gielen, C., Van Winckel, H., Min, M., Waters, L. B. F. M., & Lloyd Evans, T. 2008, A&A, 490, 725
- Gielen et al. (2009) Gielen, C., Van Winckel, H., Reyniers, M., et al. 2009, A&A, 508, 1391
- Gielen et al. (2011) Gielen, C., Bouwman, J., Van Winckel, H., et al. 2011, A&A, 533, A99
- Giridhar et al. (1998) Giridhar, S., Lambert, D. L., & Gonzalez, G. 1998, ApJ, 509, 366
- Giridhar et al. (2000) Giridhar, S., Lambert, D. L., & Gonzalez, G. 2000, ApJ, 531, 521
- Giridhar et al. (2005) Giridhar, S., Lambert, D. L., Reddy, B. E., Gonzalez, G., & Yong, D. 2005, ApJ, 627, 432
- Gledhill (2005) Gledhill, T. M. 2005, MNRAS, 356, 883
- Gonzalez et al. (1997a) Gonzalez, G., Lambert, D. L., & Giridhar, S. 1997b, ApJ, 479, 427
- Gonzalez et al. (1997b) Gonzalez, G., Lambert, D. L., & Giridhar, S. 1997a, ApJ, 481, 452
- Hrivnak et al. (2008) Hrivnak, B. J., Van Winckel, H., Reyniers, M., et al. 2008, AJ, 136, 1557
- Ita et al. (2001) Ita, Y., Deguchi, S., Fujii, T., et al. 2001, A&A, 376, 112
- Kameswara Rao et al. (2002) Kameswara Rao, N., Goswami, A., & Lambert, D. L. 2002, MNRAS, 334, 129
- Kiss et al. (2007) Kiss, L. L., Derekas, A., Szabó, G. M., Bedding, T. R., & Szabados, L. 2007, MNRAS, 375, 1338
- Kwok et al. (1997) Kwok, S., Volk, K., & Bidelman, W. P. 1997, ApJS, 112, 557
- Lambert et al. (1988) Lambert, D. L., Hinkle, K. H., & Luck, R. E. 1988, ApJ, 333, 917
- Lenz & Breger (2005) Lenz, P. & Breger, M. 2005, Communications in Asteroseismology, 146, 53
- Lloyd Evans (1999) Lloyd Evans, T. 1999, in IAU Symp. 191: Asymptotic Giant Branch Stars, Vol. 191, ed. T. Le Bertre, A. Lebre, & C. Waelkens, 453
- Lodders (2003) Lodders, K. 2003, ApJ, 591, 1220
- Maas et al. (2002) Maas, T., Van Winckel, H., & Waelkens, C. 2002, A&A, 386, 504
- Maas et al. (2005) Maas, T., Van Winckel, H., & Lloyd Evans, T. 2005, A&A, 429, 297
- Mathis & Lamers (1992) Mathis, J. S. & Lamers, H. J. G. L. M. 1992, A&A, 259, L39
- Meixner et al. (1999) Meixner, M., Ueta, T., Dayal, A., et al. 1999, ApJS, 122, 221
- Menzies & Whitelock (1988) Menzies, J. W. & Whitelock, P. A. 1988, MNRAS, 233, 697
- Murakami et al. (2007) Murakami, H., Baba, H., Barthel, P., et al. 2007, PASJ, 59, 369
- Pojmanski (2002) Pojmanski, G. 2002, Acta Astronomica, 52, 397
- Raskin et al. (2011) Raskin, G., Van Winckel, H., Hensberge, H., et al. 2011, A&A, 526, A69
- Reyniers & Van Winckel (2003) Reyniers, M. & Van Winckel, H. 2003, A&A, 408, L33
- Reyniers & Van Winckel (2007) Reyniers, M. & Van Winckel, H. 2007, A&A, 463, L1
- Roberts et al. (1987) Roberts, D. H., Lehar, J., & Dreher, J. W. 1987, AJ, 93, 968
- Skrutskie et al. (2006) Skrutskie, M. F., Cutri, R. M., Stiening, R., et al. 2006, AJ, 131, 1163
- Sneden (1973) Sneden, C. A. 1973, PhD thesis, The Univerisity of Texas at Austin.
- Sumangala Rao et al. (2011) Sumangala Rao, S., Giridhar, S., & Lambert, D. L. 2012, MNRAS 419, 1254
- Tody (1993) Tody, D., ADAS II, ASPC Series 52, 173
- van Aarle et al. (2011) van Aarle, E., Van Winckel, H., Lloyd Evans, T., et al. 2011, A&A, 530, A90
- van Boekel et al. (2005) van Boekel, R., Min, M., Waters, L. B. F. M., et al. 2005, A&A, 437, 189
- Van Winckel (2003) Van Winckel, H. 2003, ARA&A, 41, 391
- Van Winckel (2007) Van Winckel, H. 2007, Baltic Astr., 16, 112
- Van Winckel & Reyniers (2000) Van Winckel, H. & Reyniers, M. 2000, A&A, 354, 135
- Van Winckel et al. (1992) Van Winckel, H., Mathis, J. S., & Waelkens, C. 1992, Nature, 356, 500
- Van Winckel et al. (1995) Van Winckel, H., Waelkens, C., & Waters, L. B. F. M. 1995, A&A, 293, L25
- Van Winckel et al. (1998) Van Winckel, H., Waelkens, C., Waters, L. B. F. M., et al. 1998, A&A, 336, L17
- Van Winckel et al. (2009) Van Winckel, H., Lloyd Evans, T., Briquet, M., et al. 2009, A&A, 505, 1221
- Waelkens et al. (1991a) Waelkens, C. and Lamers, H. J. G. L. M. and Waters, L. B. F. M. and Rufener, F. and Trams, N. R. and Le Bertre, T. and Ferlet, R. and Vidal-Madjar, A. 1991a, A&A, 242, 433
- Waelkens et al. (1991a) Waelkens, C., Van Winckel, H., Bogaert, E., & Trams, N. R. 1991b, A&A, 251, 495
- Waters et al. (1992) Waters, L. B. F. M., Trams, N. R., & Waelkens, C. 1992, A&A, 262, L37
- Woźniak et al. (2004) Woźniak, P. R., Vestrand, W. T., Akerlof, C. W., et al. 2004, AJ, 127, 2436