Spectral Lineshape Measurements with Shot-Noise Limited Accuracy
Abstract
Spectroscopy has played the key role in revealing, and thereby understanding, the structure of atoms and molecules. A central drive in this field is the pursuit of higher precision and accuracy so that ever more subtle effects might be discovered. Here, we report on laser absorption spectroscopy that operates at the conventional quantum limit imposed by photon shot-noise. Furthermore, we achieve this limit without compromising the accuracy of the measurement. We demonstrate these properties by recording an absorption profile of cesium vapor at the 2 parts-per-million level. The extremely high signal-to-noise ratio allows us to directly observe the homogeneous lineshape component of the spectral profile, even while in the presence of Doppler broadening that is a factor of 100 times wider. We can do this because we can precisely measure the spectral profile at a frequency detuning more than 200 natural linewidths from the line center. We use the power of this tool to demonstrate direct measurements of a low-intensity optically-induced broadening process that is quite distinct from the well-known power broadening phenomenon.
Researchers performing absorption spectroscopy have continually sought to improve the precision with which atomic and molecular lines can be measured. As instrument precision improved, comparisons of the observed spectra to contemporary theory often led to the discovery of subtle structures that were previously unresolvable. Exemplary cases include the observation, and consequential understanding, of the Starkstark1913englishletter and Lamb shiftslamb1947 . Attaining accuracy as well as precision in modern frequency metrology now rests on the detailed removal of these and many similar systematic frequency effects at the level of a few parts in oskay2006 ; takamoto2005 . Analogously, recent attainment of astonishing frequency precision and purity in the modes of an optical frequency comb are offering new possibilities for laboratory-scale searches for variations in the values of fundamental constantshaensch2005 . Here, it is again demonstrated that achieving incredible precision is only half the story; accuracy at the same level is also required, which demands stringent understanding of all systematic factors in the model for the observed spectroscopic lineshapeniering2000 . Progress in precision laser absorption spectroscopy has thus become an enabling technology of key importance in a wide variety of fields, which include frequency metrologyudem2002 ; knappe2005 , direct optical frequency comb spectroscopymarian2004 ; diddams2007 , primary thermometrydjerroud2009 ; castrillo2009 ; lemarchand2010 ; truong2011 , trace gas detectionthorpe2008 ; zahniser1995 , precision lineshape measurementsborde2009 ; arroyo1993 and precision lineshape analysiscygan2012 .
The conventional limit to precision in laser absorption spectroscopy (LAS) is set by shot-noise in the probing light, though, in practice, it is difficult to achieve this limit as technical noise and instrumental limitations usually intervene. These technical limitations are particularly acute for LAS because it is inherently a bright fieldhobbs2009 measurement i.e. the signal of interest is a difference between two large signals: one proportional to the incident power, and the second proportional to the transmitted power. If one wishes to build a high-sensitivity and high-accuracy tool for probing optical absorbance then there are two key challenges: first, small signals are easily obscured by technical noise sources such as laser amplitude instability, which are typically much larger than fundamental sources; and second, the resolution of the measurement (the small differential signal) is compromised because most of the dynamic range of the sensor is consumed by the need to measure the large average value of the signal. Ingenious differential-detection designs, such as the noise eater described in Ref. hobbs1991 , can be used to reach the shot-noise limit in the presence of amplitude noise that can up to 70 dB larger through a high degree of common mode rejection. This type of balanced detector was recently demonstrated in conjunction with an optical frequency comb to give high-precision broadband measurements at the shot-noise limitfoltynowicz2011 .
Although the precision of such techniques is extremely impressive, it is important to note that this often comes at the expense of accuracy because information about the average power (common mode signal) is either not measured, or because the design of the differential detector does not adequately ensure linearity. The latter problem is typically the case for auto-balancing photocurrent attenuatorshobbs1991 ; hobbs1997 ; nirvana . This loss in accuracy is not critical if the ultimate goal is to achieve extraordinary sensitivity; however, in many areas of current interest, accuracy is just as important as precisiondaussy2007 ; casa2008 . In such circumstances the strict adherence of the measured lineshape to the assumed model profile is critical to avoiding systematic errors when line parameters are extracted from regression. To this end, other work has previously sought, and found, significant non-linearity in the absorption depth of alkali metal vapors even in the weak-probe regime ()siddons ; sherlock2009 ; shin2009 . However, these earlier studies were unable to resolve the subtle changes in homogeneous linewidth that are at the origin of the lineshape changes.
One brute-force approach to overcome this challenge would be to use traditional LAS but digitize the two signals of interest with an extraordinarily large dynamic range device (a possibility canvased in Ref. foltynowicz2011 ). However, as we demonstrate in this paper, it is possible with a simple rearrangement of existing equipment, to obtain a linear differential LAS technique that allows measurements of optical power ratios at the few parts-per-million level with precision limited only by shot-noise on the light.
We make use of this high-resolution spectrometer to probe the D1 transition of cesium (Cs) and report an unexpected source of optically-induced modification to the homogeneous lineshape component in the absorption profile. Whilst it is well established that the homogeneous linewidth can be substantially modified at intensities higher than the saturation intensitysiegman ; demtroeder1981 , , we directly observe that the linewidth has doubled at intensities as low as . This effect is an unforeseen consequence of optical pumping in the alkali vapours.
Our high-accuracy, high-precision technique can find application in lineshape analysis to extract collisionally-induced perturbation parametersdeVizia2011 ; cygan2012 , verification of time-dependent optical pumping modelsstace2010 , and studies of plasma condition by lineshape analysismiura2011 ; xiong2011
I Results
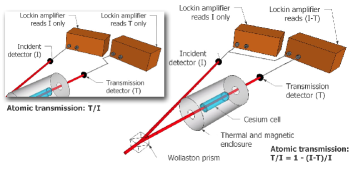
In conventional LAS detection, the incident and transmitted light is independently detected (see inset on Fig. 1) to deliver a photocurrent of and respectivelydemtroeder1981 ; lemarchand2010 . Any common-mode laser intensity fluctuations are removed by constructing the ratio . This procedure intrinsically compromises the resolution of an absorption measurement as most of the dynamic range of the photocurrent measurement device is used to deliver solely information on the average photocurrent. In contrast, our technique is based on effectively extending the dynamic range of the photocurrent measurement by making two different measurements: first, a high-gain measurement of the difference signal which is centred on zero, and a separate measurement of the average component (). The ratio can then be reconstructed in software using the identity
| (1) |
The increase in dynamic range of this new technique over the traditional method is equal to the inverse of the depth of the absorption signal (i.e. in our case ). This condition is set by the maximum increase in gain allowable on the detection of over that of by itself. It is this careful differential approach that has given us a linear, high dynamic-range ratiometric measurement of the optical powers. We have verified that non-linearity of the detection chain contributes on the order of 100 parts-per-million detection gain variation between 95 and 100 % of the typical operating optical powers, (a few microwatts) which we can correct to first order to the level of the uncertainty of our linearity verification (a few parts-per-million) (see Methods). We expect that the photocurrent ratio () is an accurate measurement of the transmission to within this limit.
Our measurements are made at probe intensities between to of the saturation intensity, where mW/cm2steck2003cdl . At such low probe intensities, the transmitted probe power can be modeled using the Beer-Lambert lawsiegman ; demtroeder1981 ,
| (2) |
where is the probe power incident on the atoms at each optical frequency and is the (frequency dependent) optical depth. In this same low intensity limit, we can write , where is the on-resonance optical depth; is the optical frequency of the transition and is a Voigt function demtroeder1981 ; borde2009 that describes the real-part of the complex susceptibility of the optical resonance for a thermal ensemble of atoms. The Voigt function is a convolution of a Lorentzian component of the lineshape (homogeneous linewidth) and a Gaussian component (inhomogenous Doppler broadening). The Lorentzian component can be defined as ) where is the half-width at half maximum (HWHM) bandwidth, while the Gaussian component, has a width of where is the Boltzmann constant, is the temperature of the vapor, is the atomic mass and is the speed of light. Broadening effects from transit time and the probing laser are negligible in this experiment. Power broadening will only amount to an apparent 5% change in the homogenous linewidth over the probe intensity rangesiegman . We thus expect the Lorentzian component to be nearly constant with a width set by he natural lifetime of the transition, i.e. MHz. All of our measurements were made at K so that all of the recorded spectra should also have a fixed Gaussian component with the same characteristic width ( MHz).
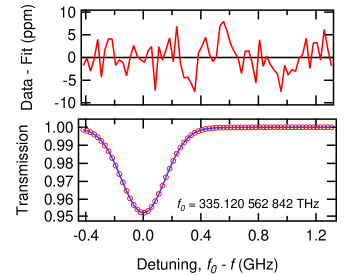
A typical transmission spectrum () for which and K is shown in the lower panel of Fig. 2. A least-squares fit was performed to the spectrum and the residual from a fit to the Eqn. 2 model is shown in the upper panel of Fig. 2. The residuals are featureless and have a white spectrum with an root-mean-square (RMS) spread of 2 ppm 111A small Lamb dipbennett1962 feature of 60 ppm amplitude peak and MHz wide was visible in the spectra due to weak back-reflections from an uncoated cell window. This feature was included in the fit model to eliminate it from the residuals for clarity.. This is entirely consistent with the expected photon shot-noise at this probe power (6 W).
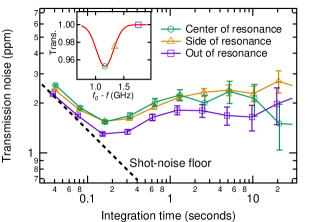
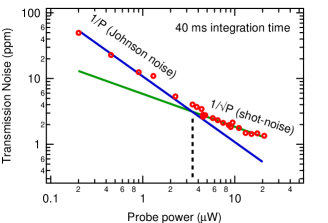
To demonstrate explicitly that the measurement noise is associated with shot-noise we monitored the fluctuations in the measurement as the probe laser was held at three different frequencies corresponding to a) completely out of resonance with the Cs, b) at a point half way down the absorption curve, and c) tuned to the centre of resonance. Each of these measurements should yield similar results if frequency noise of the laser source is negligible (since the transmitted power is similar in all cases). Fig. 3 (top) shows the measured fluctuations in each of these signals over various time scales. We display this in terms of the Allan Variance which is a standard and stable measure of fluctuations in an experimentally obtained time series allan1966 . The measurement noise is seen to be nearly identical in all cases confirming that the laser frequency noise is negligible at the current measurement precision. The slope of each result between 40 ms and 0.2 s of integration time indicates that the fluctuation spectrum is white. For longer timescales, the measurement is dominated by flicker-noise arising in the electronic components of the measurement system and possible drifts in the alignment of stray etalonsvoss1979 . Fig. 3(b) shows the measurement noise at 40 ms integration time as a function of probe power. Here, we see a distinct change in slope around 3.5W incident power from to behaviour. We also display the calculated Johnson noise of the photodetector readout resistor (blue) and the calculated shot-noise of the light from first principles (green curve). It can be seen that the dependence and magnitude of the noise at low powers is consistent with Johnson noise, while the shape and magnitude is consistent with photon shot-noise at optical powers higher than 3.5 W.
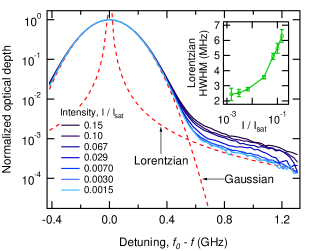
The large dynamic range and high SNR of our approach means that we can directly reveal subtle and important changes in the absorption spectra, which have not been observed previously. Fig. 4 shows the frequency-dependent optical depth, , extracted from the data using Eqn. 2. We display this depth for a set of probe powers ranging from . One observes a strong on-resonance Gaussian profile associated with Doppler broadening of the vapour. In addition, the high signal to noise ratio in our experiment enables us to observe the Lorentzian wings that make up a “pedestal” of the Voigt profile at large detunings . These are easily distinguished: the Gaussian component decays rapidly at high frequency detunings until the Lorentzian wings become dominantkitching1993 .
Fig. 4 shows a surprising, and at first sight quite unexpected, feature: it can be clearly seen that magnitude of the Lorentzian component is dependent on the probe intensity. This is even more evident on the inset on this figure where we re-plot the data in terms of its apparent Lorentzian width (): this increases from 2 MHz to 6 MHz as the probe intensity increases from to whereas we should have expected that this was constant within 5% over this intensity rangesteck2003cdl . We have recently shown that this type of behaviour can arise out of a complex interplay between optical pumping and atom dynamics as an atom traverses the probe beamstace2012 . This interaction modifies the underlying Lorentzian lineshape to give an overall lineshape that is still close to a Voigt function but with a modified Lorentzian width parameter.
II Discussion
We have demonstrated a new approach to laser absorption spectroscopy that circumvents the dynamic range limitations of the standard technique. This is achieved by using a high-precision differential measurement scheme that carefully preserves the measurement linearity while simultaneously obtaining scale information in order to deliver accuracy. This has permitted the reconstruction of Cs absorption spectra with a SNR limited by shot-noise on the probe source (2 ppm at 6 W in a 40 ms bandwidth). By varying the probe power between to of the saturation intensity, we have observed an apparent trebling of the underlying homogeneous linewidth of the Cs D1 transition. This observation shows the power of the new technique as we are making precision measurements of the natural linewidth component of the voigt profile in the wings of the spectral line at frequency detuning of more than 200 natural linewdiths away from the line center. This work heralds a potential leap in ultra-high precision absorption spectroscopy of gases where we can now overcome previously overlooked physical phenomena that arise from time-dependent optical pumping. We anticipate these techniques will be critical in future high precision spectroscopy research.
III Methods
III.1 Optical setup
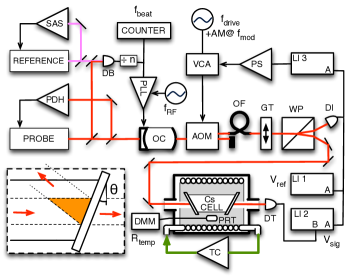
A detailed schematic of the experimental setup is shown in Fig. 5. One extended cavity diode laser (ECDL), labeled reference, was frequency-stabilized to a saturated-absorption hyperfine spectroscopic feature of Cs at 894.578 nm in the D1 manifold, using a standard Pound-Drever-Hall (PDH) laser-locking techniqueblack2001 . A second ECDL, labeled probe, was used to interrogate the cesium transitions at 894.580 nm, which are 1.17 GHz detuned from the reference transition. This laser was frequency locked using the PDH technique to the fundamental transverse mode of an optical cavity (OC) (1 MHz bandwidth; 18 GHz free spectral range). A beat-note between the two lasers was formed on a high speed photodiode (DB), whose output was frequency divided by a factor of , and locked to a tunable radio frequency oscillator () using a frequency-locked loop to stabilize the frequency probe at the 2 kHz level over 1 to 10 s. By manipulating the probe laser frequency could be tuned to an arbitrary frequency offset from the reference laser. A frequency counter was used to monitor the (divided) beat-note frequency, , which was used to accurately reconstruct the frequency axis for the transition of interest.
Light transmitted by the optical cavity, which was mostly free of spontaneous emission from the ECDL, was passed through an acousto-optic modulator (AOM). This AOM performed two tasks: an optical chopper (90% amplitude modulation at kHz), and as a variable optical attentuator to deliver high-bandwidth power stabilization of the diffracted beam. Th diffracted beam is shifted in frequency by the AOM’s drive frequency of 175 MHz, . The zero-order undiffracted beam was used to compare the probe laser frequency to a stabilised optical frequency comb (not shown). The diffracted beam was coupled into a length of single-mode optical fiber (OF) that eliminated pointing fluctuations in the light. The resulting spatially and spectroscopically pure probe beam was then polarized and split using Glan-Taylor (GT) and Wollaston (WP) prisms respectively. Light from one arm was detected immediately, while light from the other arm was directed through the cesium cell before detection (on DI and DT respectively).
The detectors were reverse-biased silicon photodiodes, with matched 47 k load resistors. The voltage across each load resistor was synchronously detected using a lock-in amplifier (referenced to ), and recorded on a digital multimeter (DMM). To circumvent the dynamic range limit imposed by the lock-in amplifier (Stanford Research Systems SR830), which was 10 times worse than the shot-noise limit, a low-noise analog subtraction stage was used to create a differential signal that was close to zero when the laser was off-resonance. Lock-in amplifier 2 (LI 2) was set to demodulate the differential signal . The advantage of this technique is its ability to measure small transmission deviations from unity without loss of dynamic range. In addition, the incident photodiode (DI) output was detected by a third lock-in amplifier to produce a signal for optical power stabilization. The output of this third lockin was compared to a reference voltage and then fed back to the AOM via a voltage controlled attenuator (VCA) to stabilize the optical power of the probe beam.
The cesium cell under test was encased in a 15 kg cylindrical copper block. Its temperature was monitored using a using two platinum resistance thermometers (PRTs) calibrated by their manufacturer with an uncertainty of 30 mK. One PRT was placed at the centre of the block (shown in Fig. 5), 5 mm from the mid-point of the cell; the other was located at the extreme end of the block (not shown). A temperature-controlled chiller sent refrigerated liquid through a copper pipe coiled around the block to maintain a temperature of approximately 276 K, with stability of 3 mK over one minute and long term stability of 15 mK. At this temperature, the cesium vapor in the cell was optically thin. The maximum gradient observed between the PRTs was 30 mK, which was at the same level as their combined calibration uncertainty. The copper block and cooling coils were enclosed within a mu-metal magnetic shield to minimize Zeeman broadening and mounted on sorbothane pads for passive vibration isolation.
III.2 Detection Linearity
The linearity of the entire detection scheme (reverse-biased photodiode and load resistor; lock-in amplifier; and digital multimeter) was determined using a modified, synchronous version of the method discussed by Shinshin2005 . Two lasers of equal optical power were combined and passed through an AOM (to produce AM modulation identical to that discussed above) before falling on the photodiode. Each beam could be independently switched on or off using a mechanical chopper. A third laser, with optical power 20 times that of each chopped laser, was also passed through the AOM and onto the detector to introduce a signal replicating our operating point. The two low-power beams were continuously cycled through the four possible states (on:off, on:on, off:on, off:off) and the resulting synchronously detected output voltages were recorded. The figure of merit for this linearity measurement is the relative error, given by:
| (3) |
where , and are the recorded output voltages for the first beam only, the second beam only and both beams together, respectively. The relative error can be calculated for each complete cycle with the fourth state (both beams off) used to remove unwanted offsets. Averaging the results of many such measurements reduces uncertainty in the relative error to arbitrarily small levels. By measuring the relative error as a function of optical power (or more practically, output voltage) the resulting first-order non-linearity of the detection scheme can be deduced and corrected.
III.3 Data reduction
In the least-squares fits of the measured transmission data, a small quadratic power dependence arising from broad and weak etalons formed by the surfaces of each uncoated cell window. This is modeled by allowing the input power in Eqn. 2 to take the form . The parameters , and are adjustable fit parameters. To display the underlying Voigt profiles (Fig.4), the parameters and are substituted with their fitted values into
| (4) |
III.4 Reproducibility of fit parameters
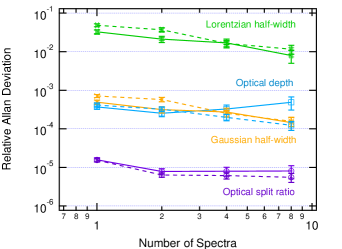
We recorded a set of 60 consecutive scans of the Cs spectrum at a probe power of 6W where the measurement is shot-noise limited. Fig. 6 displays the relative Allan deviation of a selection of fit parameters in Eqn. 4 ( the off-resonance ratio, the absorption depth, the Lorentzian half-width and the Gaussian half-width). The dashed traces are the expected parameter noises given the noise characteristics of the transmission noise (Fig. 3a) and demonstrates that stability of the fitted parameters is consistent with the shot-noise limit in combination with the flicker-noise at longer time scales. The Lorentzian width estimation is 100-fold noisier than the Gaussian because they are highly fit correlated parameters; a unit change in the absolute width of one component induces a near unit change in the other. Therefore, the relative fluctuations are in the ratio of the mean values of these parameters (). Similarly, the parameters associated with amplitudes, the optical depth and the optical split ratio , have similar absolute deviations from their mean values. However, the mean value of the depth is of the background level due to the chosen cell temperature. The flicker-noise prevent the uncertainty in the fitted parameters decreases with ensemble averaging after a few scans.
References
- (1) Stark, J. Observation of the Separation of Spectral Lines by an Electric Field. Nature, 92(2301):401–401, 1913.
- (2) Lamb, W.E. and Retherford, R.C. Fine Structure of the Hydrogen Atom by a Microwave Method. Physical Review, 72(3):241–243, 1947.
- (3) Oskay, W.H., Diddams, S.A., Donley, E.A., Fortier, T.M., Heavner, T.P., Hollberg, L., Itano, W.M., Jefferts, S.R., Delaney, M.J., Kim, K., Levi, F., Parker, T.E., and Bergquist, J.C. Single-Atom Optical Clock with High Accuracy. Physical Review Letters, 97(2):20801, 2006.
- (4) Takamoto, M. and Hong, F.L. and Higashi, R. and Katori, H. An optical lattice clock. Nature, 435(7040):321–324, 2005.
- (5) Hänsch, T.W., Alnis, J., Fendel, P., Fischer, M., Gohle, C., Herrmann, M., Holzwarth, R., Kolachevsky, N., Udem, T., Zimmermann, M. Precision spectroscopy of hydrogen and femtosecond laser frequency combs. Philosophical Transactions of the Royal Society A: Mathematical, Physical and Engineering Sciences, 363(1834):2155–2163, 2005.
- (6) Niering, M., Holzwarth, R., Reichert, J., Pokasov, P., Udem, T., Weitz, M., Hänsch, T.W., Lemonde, P., Santarelli, G., Abgrall, M., Laurent, P., Salomon, C., Clairon, A. Measurement of the hydrogen 1S-2S transition frequency by phase coherent comparison with a microwave cesium fountain clock. Physical Review Letters, 84(24):5496–5499, 2000.
- (7) Udem, T., Holzwarth, R., Hänsch, T.W. Optical frequency metrology. Nature, 416(6877):233–237, 2002.
- (8) S. Knappe, V. Gerginov, P. D. D. Schwindt, V. Shah, H. G. Robinson, L. Hollberg, and J. Kitching. Atomic vapor cells for chip-scale atomic clocks with improved long-term frequency stability. Optics Letters, 30(18):2351–2353, 2005.
- (9) Marian, A., Stowe, M.C., Lawall, J.R., Felinto, D., and Ye, J. United Time-Frequency Spectroscopy for Dynamics and Global Structure. Science, 306(5704):2063–2068, 2004.
- (10) Diddams, S.A., Hollberg, L. and Mbele, V. Molecular fingerprinting with the resolved modes of a femtosecond laser frequency comb. Nature, 445(7128):627–630, 2007.
- (11) Khelifa Djerroud, Cyril Lemarchand, Alexandre Gauguet, Christophe Daussy, Stephan Briaudeau, Beno t Darqui , Olivier Lopez, Anne Amy-Klein, Christian Chardonnet, and Christian J. Bord . Measurement of the boltzmann constant by the doppler broadening technique at a 3.8 10-5 accuracy level. Comptes Rendus Physique, 10(9):883 – 893, 2009. Experimental determination of Boltzmann’s constant.
- (12) Antonio Castrillo, Giovanni Casa, Andrea Merlone, Gianluca Galzerano, Paolo Laporta, and Livio Gianfrani. On the determination of the boltzmann constant by means of precision molecular spectroscopy in the near-infrared. Comptes Rendus Physique, 10(9):894 – 906, 2009. Experimental determination of Boltzmann’s constant.
- (13) C. Lemarchand, K. Djerroud, B. Darquié, O. Lopez, A. Amy-Klein, C. Chardonnet, C.J. Bordé, S. Briaudeau, and C. Daussy. Determination of the boltzmann constant by laser spectroscopy as a basis for future measurements of the thermodynamic temperature. International Journal of Thermophysics, 31(7):1347–1359, 2010.
- (14) Gar-Wing Truong, Eric F. May, Thomas M. Stace, and André N. Luiten. Quantitative atomic spectroscopy for primary thermometry. Physical Review A, 83(3):033805, 2011.
- (15) Thorpe, M.J., Balslev-Clausen, D., Kirchner, M.S. and Ye, J.. Cavity-enhanced optical frequency comb spectroscopy: application to human breath analysis. Optics Express, 16(4):2387–2397, 2008.
- (16) Mark S. Zahniser, David D. Nelson, J. Barry McManus, Paul L. Kebabian, and D. Lloyd. Measurement of trace gas fluxes using tunable diode laser spectroscopy. Philosophical Transactions of the Royal Society of London. Series A: Physical and Engineering Sciences, 351(1696):371–382, 1995.
- (17) C.J. Bordé. On the theory of linear absorption line shapes in gases. Comptes Rendus Physique, 10(9):866–882, 2009.
- (18) M. P. Arroyo and R. K. Hanson. Absorption measurements of water-vapor concentration, temperature, and line-shape parameters using a tunable ingaasp diode laser. Applied Optics, 32(30):6104–6116, 1993.
- (19) A. Cygan, D. Lisak, S. Wójtewicz, J. Domysławska, J. T. Hodges, R. S. Trawiński, and R. Ciuryło. High-signal-to-noise-ratio laser technique for accurate measurements of spectral line parameters. Physical Review A, 85:022508, 2012.
- (20) P.C.D. Hobbs. Building electro-optical systems: making it all work. John Wiley & Sons Inc, 2009.
- (21) Philip C. D. Hobbs. Shot noise limited optical measurements at baseband with noisy lasers. Proceedings of the SPIE, 1376(1):216–221, 1991.
- (22) Aleksandra Foltynowicz, Ticijana Ban, Piotr Masłowski, Florian Adler, and Jun Ye. Quantum-noise-limited optical frequency comb spectroscopy. Physical Review Letters, 107:233002, 2011.
- (23) P.C.D. Hobbs. Ultrasensitive laser measurements without tears. Applied optics, 36(4):903–920, 1997.
- (24) New Focus Model 2007 & 2017 User’s Manual, Nirvana Auto-Balanced Photoreceivers. New Focus, Inc., California, 2002.
- (25) C. Daussy, M. Guinet, A. Amy-Klein, K. Djerroud, Y. Hermier, S. Briaudeau, C.J. Bordé, and C. Chardonnet. Direct determination of the boltzmann constant by an optical method. PRL, 98, 2007.
- (26) G. Casa, A. Castrillo, G. Galzerano, R. Wehr, A. Merlone, D. Di Serafino, P. Laporta, and L. Gianfrani. Primary gas thermometry by means of laser-absorption spectroscopy: Determination of the boltzmann constant. PRL, 100, 2008.
- (27) P. Siddons, C.S. Adams, C. Ge, and I.G. Hughes. Absolute absorption on rubidium d lines: comparison between theory and experiment. Journal of Physics B: Atomic, Molecular and Optical Physics, 41:155004, 2008.
- (28) B.E. Sherlock and I.G. Hughes. How weak is a weak probe in laser spectroscopy? American Journal of Physics, 77:111, 2009.
- (29) Seo Ro Shin and Heung-Ryoul Noh. Calculation and measurement of absolute transmission in rubidium. Journal of the Physical Society of Japan, 78(8):084302, 2009.
- (30) A.E. Siegman. Lasers. University Science Books, 1986.
- (31) W. Demtröder. Laser Spectroscopy: Basic Concepts and Instrumentation. Springer, Berlin, 1981.
- (32) M.D. De Vizia, L. Moretti, A. Castrillo, E. Fasci, and L. Gianfrani. The lineshape problem in doppler-width thermometry. Molecular Physics, 109(17-18):2291–2298, 2011.
- (33) TM Stace and AN Luiten. Theory of spectroscopy in an optically pumped effusive vapor. Physical Review A, 81(3):33848, 2010.
- (34) N. Miura and J. Hopwood. Spatially resolved argon microplasma diagnostics by diode laser absorption. Journal of Applied Physics, 109(1):013304–013304, 2011.
- (35) Q. Xiong, A. Nikiforov, N. Britun, R. Snyders, C. Leys, and X. Lu. A simple profile-fitting method to determine the metastable and resonant densities in a cold atmospheric pressure argon plasma jet. Journal of Applied Physics, 110:073302, 2011.
- (36) D.A. Steck. Cesium D line data. Available online at http://steck.us/alkalidata (revision 2.1, 1 September 2008) , 2003.
- (37) T.M. Stace, G-W. Truong, JD. Anstie, E.F. May, A.N. Luiten Power Dependent Lineshape Corrections for Quantitative Spectroscopy Submitted to Physical Review Letters, 2012.
- (38) D.W. Allan. Statistics of atomic frequency standards. Proceedings of the IEEE, 54(2):221–230, 1966.
- (39) R.F. Voss. 1/f (flicker) noise: A brief review. In 33rd Annual Symposium on Frequency Control. 1979, 40 – 46, 1979.
- (40) J. Kitching, Y. Shevy, J. Iannelli, and A. Yariv. Measurements of 1/f frequency noise reduction in semiconductor lasers using optical feedback with dispersive loss. Journal of Lightwave Technology, 11(10):1526–1532, 1993.
- (41) E.D. Black. An introduction to Pound–Drever–Hall laser frequency stabilization. American Journal of Physics, 69:79, 2001.
- (42) W. R. Bennett. Hole burning effects in a He-Ne optical maser. Physical Review, 126:580–593, 1962.
- (43) DJ. Shin, DH. Lee, CW. Park, SN. Park A novel linearity tester for optical detectors using high-brightness light emitting diodes Metrologia, 42(2):154–158, 2005.