Spectral Line Profile Changes Associated with Energetic Solar Transients
Abstract
Solar energetic transients occurring in solar atmosphere are associated with catastrophic release of energy in the solar corona. These transients inject a part of their energy by various physical processes to the deeper, denser photospheric layer at which velocity and magnetic fields are measured using suitable spectral lines. Serious questions have been raised about the nature of the observed magnetic (and velocity) field changes associated with energetic transients as their measurements are expected to be affected by flare-induced line profile changes. In this paper, we shall discuss some recent progress on our understanding of the physical processes associated with such events.
keywords:
Sun: activity – Sun: magnetic field – Sun: spectral profiles1 Introduction
Solar flares are sudden transient, localized eruptions of energy in the solar atmosphere. These events occur over a large range in space and time; lasting from a few seconds to several hours. Intensification of radiation over the entire electromagnetic spectrum, release of energetic particles and ejection of plasma clouds are some of the observed phenomena associated with flares. Flares produce short-lived waves traveling away from their site, such as, Moreton waves, and blast waves. More recently, flare-associated helioseismic effects are also reported, such as, compact acoustic sources, seismic waves, and amplification of acoustic or p-modes (Ambastha, Basu and Antia, 2003).
It is generally accepted that solar transients,viz., flares and Coronal Mass Ejections (CMEs), derive their energy from stressed magnetic field. Therefore, magnetic stress or non-potentiality is expected to relax to a lower energy state after the release of excess energy from the the solar active region (AR). A wide variety of results are reported on the pre- and post-flare changes in magnetic field (Ambastha et al. ,1993; Kosovichev & Zharkova, 2001; Mathew & Ambastha, 2000; Wang et al., 2002; Sudol & Harvey, 2004). However, serious questions have also been raised about the nature of observed changes as the measurements are expected to be affected by flare-induced spectral line profile changes (Harvey, 1986; Qiu and Gary, 2003). We shall discuss here some observed phenomena occurring in the photospheric magnetic and velocity fields during large flares and interpret them with the help of the recently available spectral data.
2 Observed Flare/CME related changes
To distinguish between the normal magnetic (velocity) field evolution of solar ARs, and the changes considered to be associated with flares and CMEs, high sensitivity magnetic (Doppler velocity) data are required at high-cadence and high spatial resolution. Such data are available from the ground-based Global Oscillation Network Group (GONG) since 1995, and the space-borne Solar Oscillations and Heliospheric Observatory (SOHO) during 1996-2009. The space-borne measurements are considered to be better as they are not affected by atmospheric degradations. More recently, very high quality data are being provided by the Solar Dynamics Observatory (SDO)-Helioseismic and Magnetic Imager (HMI) subsequent to its launch in 2010.
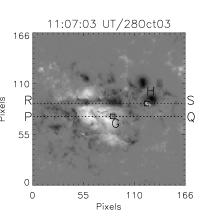
Both abrupt and persistent changes in observed magnetic field parameters have been reported that last over a few minutes during the impulsive phase of many energetic solar transient events, i.e., flares and CMEs. However, an anomalous magnetic flux polarity reversal was first reported during the large X-class flare of 6 April 2001 using MDI magnetograms (Qiu and Gary, 2003). Rapidly moving transient features, with speeds ranging from 30 to 50 km-s-1, were reported also in magnetic and Doppler images of AR NOAA 10486 during the super-flares X17/4B (2003 October 28) and X10/2B (2003 October 29) by Maurya & Ambastha (2009: hereafter MA09). These transient features seen in both the GONG and MDI data were also the sites of magnetic polarity reversals during the impulsive phase of the energetic flares (Figure 1).


Such magnetic polarity sign reversals were first reported several years ago by Zirin & Tanaka (1981) in some large flares. They attributed it to the heating of lower atmosphere by the flare such that the core of the absorption line, used for measurement, turned to emission (Patterson, 1984). However, only a few cases of anomalous magnetic and Doppler transients driven by the flares have been reported in recent years. It appears that the transients may reach detectable levels only in very energetic flares. Both the flares in MA09 were extremely energetic white-light (WL) events. More recently, Kosovichev (2011) have reported “sunquake” sources in the regions of these features and suggested these to arise due to thermal and hydrodynamic effects of high-energy particles heating the lower atmosphere. One would like to ask whether these features are related to the line profile change (Ding et al. 2002; Qiu & Gary, 2003) or to other physical processes such as the impact of a shock wave (Zharkova & Zharkov, 2007) on the line-production region.
Due to the non-availability of the required spectral data, the transients in the super-flares of 2003 (MA2009) were examined using only the imaged data of the flares at various wavelengths and inferences were drawn based on indirect methods. But the solution of the problem lies in analyzing spectral profile shapes before, during and after major flare events, not available thus far. Therefore, the question of spectral line profile changes in relation to the observed magnetic anomaly remained unresolved.
3 Spectral line profile changes associated with flares
Photospheric magnetic field measurements are sensitive to changes in the line profile during the intense heating phase of solar flares (Ding et al., 2002). They modeled the Ni i 6768 Å line profiles using radiative transfer to explain the reversals observed during flares. However, the sign reversals as observed by MDI and GONG are difficult to be explained by the sudden heating of the lower atmosphere. This is because the Ni i line (used in both MDI and GONG) is formed in the temperature minimum region and is rather stable against temperature changes (Bruls, 1993).
The non-LTE calculations for Ni i line have shown that this absorption line can turn into emission only by a large increase of electron density and not by thermal heating of the atmosphere by any other means. Qiu & Gary (2003), interestingly, noted that sign-reversals occurred near locations of strong magnetic field, cooler sunspot umbrae that are exactly co-aligned with HXR sources. They suggested that such non-thermal effects are most pronounced in cool atmosphere where continuum is maintained at low intensity level. This implies that the sign reversal anomaly may be associated with non-thermal electron beam precipitating to the lower atmosphere near cool sunspots.
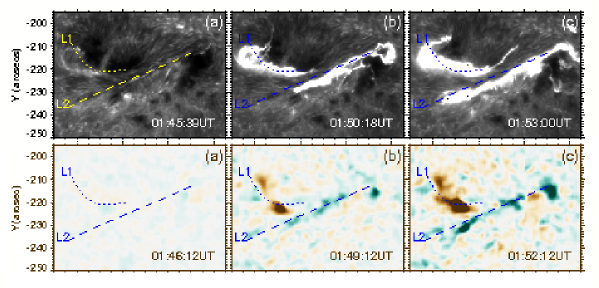
Photospheric transients as reported previously by MA09 were observed recently by SDO-HMI during the first X-class flare of the current solar cycle 24 on 2011 February 15 in AR NOAA 11158 as shown in Figure 2. (Detailed study of this event is reported by Maurya, Vemareddy & Ambastha 2012). Unlike the Ni i line used in MDI and GONG, the SDO-HMI uses Fe i 6173.3 Å. It observes the Sun in two circular polarizations at six wavelength positions ( and mÅ) of the spectral line. Using these observations one can construct the line profile for any desired location of the full disk Sun (Martinez Oliveros et al., 2011). Therefore, it is now possible to analyze the line profile changes, if any, associated with energetic transients and its effects on the estimation of magnetic and Doppler velocity fields.
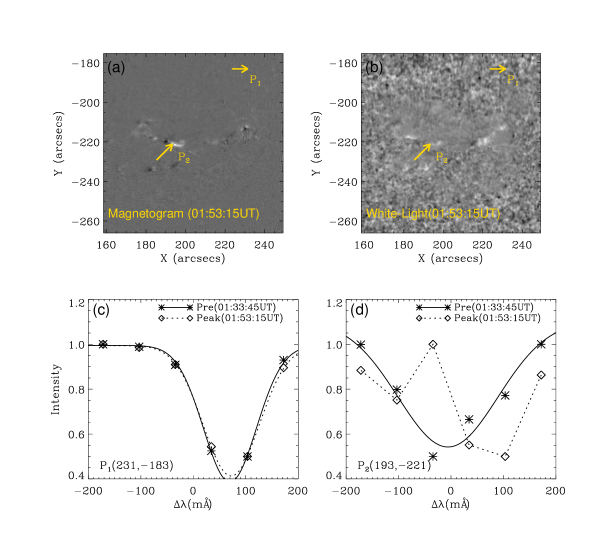
We found spatial association of the transients with the WLF kernels and HXR sources at the different phases of evolution of the X2.2 flare. Figure 3 shows the line profiles at a quiet location P1 and at a location P2 of the transient feature. Solid (dashed) curves represent the line profiles during the pre (peak) phase of the flare. We found that the line profile turned to emission at the wavelength =–34.4 mÅ and became broader during the peak phase of the flare as compared to the pre-flare phase. No such change was found at the quiet, reference location P1. For a quantitative study of the transient related changes in the Stokes profiles, we further analyzed the line profiles at several flaring and quiet locations of the AR NOAA 11158. The Stokes profiles IU and IQ at the transient location P2 were also examined in order to ascertain the results on the line shape changes during the large flare. We found that the magnetic flux and Doppler velocity values as estimated by HMI algorithms were affected by these spectral changes, resulting in the observed transient features.
4 Summary and Conclusions
It is evident from the spectral data available from SDO-HMI that the Fe i line profile changes occurred during the impulsive phase of the energetic X2.2 flare of 2011 February 15 in AR NOAA 11158. The observed changes could be related to various physical processes occurring during the flare as follows.
The thermodynamic change during the impulsive phase of the flare can drastically change the height of line formation due to the moderate perturbation of temperature and density. This can also occur as a result of the large increase of electron density as shown earlier by the non-LTE calculations of Ding et al. (2002) for Ni i 6768 Å line. They suggested that the non-thermal excitation and ionization by the penetrating electrons generate a higher electron density which enhances the continuum opacity, thereby pushing the formation height of the line upward. The precipitation of electrons and deposition of energy in the chromosphere, enhanced radiation in the hydrogen Paschen continuum gives rise to the line source function, leading to an increase of the line core emission relative to the far wing and continuum.
We thus conclude that the anomalous magnetic and Doppler transients observed during the X2.2 flare of 2011 February 15 were related to the Fe i line profile changes. Both thermal and non-thermal physical processes operating during the flare may contribute to the spectral profile changes at different stages of the flare evolution. Therefore, the observed magnetic and velocity transients are essentially the observational signatures of these physical processes operating during the energetic event, and do not correspond to “real” changes in the magnetic (doppler) fields.
References
- (1) Ambastha, A., Hagyard, M. J., West, E. A., 1993, Solar Phys., 148, 277.
- (2) Ambastha, A., Basu, S., Antia, H. M., 2003, Solar Phys. 218, 151.
- (3) Bruls, J. H. M. J., 1993, A & A, 269, 509.
- (4) Ding, M. D., Qiu, J., Wang, H., 2002, ApJ, 576, L83.
- (5) Harvey, J., 1986, in Deinzer, W., Knolker, M., Voigt, H. H., eds., Small Scale Magnetic Flux Concentrations in the Solar Photosphere, Vandenhoeck & Ruprecht, Goettingen, p. 25.
- (6) Kosovichev, A. G., 2011, ApJ, 734, L15
- (7) Kosovichev, A. G., Zharkova, V. V., 2001, ApJ, 550, L105
- (8) Martinez Oliveros, J. C., Couvidat, S., Schou, J., et al., 2011, Solar Phys., 269, 269
- (9) Mathew, S. K., Ambastha, A., 2000, Solar Phys. 197, 75.
- (10) Maurya, R. A., Ambastha, A., 2009, Solar Phys., 258, 31
- (11) Maurya, R. A., Vemareddy P. , Ambastha, A., 2012, ApJ, 747:134 (doi: http://dx.doi.org/10.1088/0004-637X/747/2/134 )
- (12) Patterson, A., 1984, ApJ, 280, 884
- (13) Qiu, J., Gary, D. E., 2003, ApJ, 599, 615
- (14) Sudol, J. J., Harvey, J. W., 2005, ApJ, 635, 647.
- (15) Wang, H. et al. 2002, ApJ, 576, 497.
- (16) Zharkova, V. V., Zharkov, S. I., 2007, ApJ, 664, 573
- (17) Zirin, H., Tanaka, K., 1981, ApJ, 250, 791.