Ultrafast Photo-Induced Charge Transfer Unveiled by
Two-Dimensional
Electronic Spectroscopy
Abstract
The interaction of exciton and charge transfer (CT) states plays a central role in photo-induced CT processes in chemistry, biology and physics. In this work, we use a combination of two-dimensional electronic spectroscopy (2D-ES), pump-probe measurements and quantum chemistry to investigate the ultrafast CT dynamics in a lutetium bisphthalocyanine dimer in different oxidation states. It is found that in the anionic form, the combination of strong CT-exciton interaction and electronic asymmetry induced by a counter-ion enables CT between the two macrocycles of the complex on a 30 fs timescale. Following optical excitation, a chain of electron and hole transfer steps gives rise to characteristic cross-peak dynamics in the electronic 2D spectra, and we monitor how the excited state charge density ultimately localizes on the macrocycle closest to the counter-ion within 100 fs. A comparison with the dynamics in the radical species further elucidates how CT states modulate the electronic structure and tune fs-reaction dynamics. Our experiments demonstrate the unique capability of 2D-ES in combination with other methods to decipher ultrafast CT dynamics.
I Introduction
Charge transfer (CT) is a ubiquitous process in nature representing the initial step in many chemical reactions and bioenergetic pathways.Marcus and Sutin (1985) Photo-induced CT is intimately related to harnessing and conversion of radiative energy in photovoltaics Deibel, Strobel, and Dyakonov (2010); Durrant and Clarke (2010); Herrmann et al. (2011), photosynthesis Blankenship (2002); Meech, Hoff, and Wiersma (1986); Novoderezhkin, Dekker, and van Grondelle (2007) and catalysis Bauer et al. (2005). CT states, representing an excitation in a molecular aggregate where the electron and hole are located on different chromophores, are characterized by low transition dipole moments and strong sensitivity to environmental perturbations. Renger (2004); Mančal, Valkunas, and Fleming (2006) Due to their low transition dipole moments, CT states participate in photo-induced reactions via the interaction with optically allowed (bright) states. If the interaction with the CT states is weak, the resonance interaction between locally excited (LE) states leads to excited states which are delocalized over the chromophores in the aggregate (exciton states). For a more pronounced CT interaction, the mixing of excitonic and CT states leads to (delocalized) eigenstates exhibiting various degrees of charge separation. After photo-excitation, interaction with the nuclear degrees of freedom enables relaxation within the manifold of excited states, ultimately leading to population of the CT states.
The influence of the CT states on the electronic structure depends on the relative magnitude of resonance- (Coulombic interaction between LE states) and CT-coupling (between LE and CT states, depending on the wave function overlap May and Kühn (2000)). This elementary interplay can be studied in model systems where the different couplings can be controlled via the inter-pigment distance, and where the energies of the CT states can be altered electrochemically. One such class of molecules is bisphthalocyanines, which comprise two macrocyclic phthalocyanine moieties held together at a fixed distance by a rare earth cation. Koike et al. (1996); Moussavi et al. (1988) The close proximity of the two rings (2.8 Å for lutetium) gives rise to delocalized charge distributions and results in strong CT coupling due to significant wavefunction overlap.Ishikawa et al. (1992) The resulting high degree of charge carrier mobility readily explains their semiconductivityBouvet and Simon (1990); Maitrot et al. (1987) and electrochromic behavior Kadish et al. (2001); Nicholson (1982).
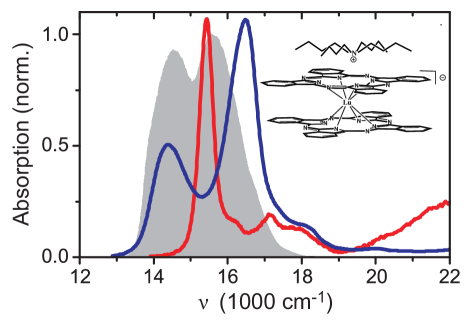
In its electronic ground state, lutetium bisphthalocyanine ([LuPc2]) is a stable radical ([LuPc2]∙) with an intermediate oxidation state of 1.5 on each ring Ostendorp and Homborg (1996). [LuPc2]∙ cannot stabilize inter-ring CT states, and the electronic structure can be understood via resonance interaction between the LE states. The electronic structure will be similar to that of an H-type dimer, which gives rise to a single transition in the linear absorption spectrum (Fig. 1). On the other hand, the anion ([LuPc2]-) exhibits CT states in the same energy range as the LE states.Ishikawa et al. (1992) The additional CT coupling drastically changes the electronic structure and gives rise to two bands in the linear absorption spectrum (Fig. 1). Therefore, the comparison of [LuPc2] in different oxidation states provides a perfect opportunity to pinpoint the influence of the CT states on the electronic structure and dynamics.
The structural and electronic similarities favor [LuPc2]- as a biomimetic model system for studies of the special pair in the photosynthetic reaction center (RC) Blankenship (2002). However, for isolated [LuPc2]-, the CT states representing forward and backward CT between the rings are energetically degenerate, and the electronic structure can be described by charge resonance states.Ishikawa et al. (1992) The presence of an environmental asymmetry breaks the energetic degeneracy of the CT states, lowering the energy of the CT state on one side of the complex and enables a net transfer of charge after photo-excitation. In the RC, such asymmetry arises from differences in the electronic coupling among pigments due to slightly different spacings between the cofactor units Kolbasov and Scherz (2000), distinct dielectric environments due to intra-protein electric fields Gunner, Nicholls, and Honig (1996); Wakeham and Jones (2005); Steffen, Lao, and Boxer (1994), and different hydrogen bonding pattern around the central units Moore, Zhou, and Boxer (1999). In other redox systems, the asymmetry may be provided by counter-ions. The formation of ion associates can have profound influence on the electronic structure and the path of chemical reactions.Cembran et al. (2005); Vakarin, Holovko, and Piotrowiak (2002); Marcus (1998) For weak CT coupling (non-adiabatic CT), the role of the counter-ion has been studied, and it has been shown that the counter-ion can actively or passively control the rate of CT depending on the strength of association.Vakarin, Holovko, and Piotrowiak (2002); Piotrowiak (1994); Piotrowiak and Miller (1993); Marcus (1998)
Conventionally, CT has been studied in systems where the CT coupling is larger than the resonance coupling, implying that CT proceeds without interference from energy transfer processes. However, in systems like the natural RCs or in novel architecture for artificial light harvesting, the two couplings can be of equal magnitude and both energy transfer and CT will take place simultaneously. The interplay of resonance- and CT-coupling in these systems tunes the excited state evolution and the dynamics of the charge separation and energy transfer processes. Such excited state dynamics gives rise to complicated spectral signatures, making a detailed investigation of the underlying mechanisms with conventional techniques difficult. In this work we employ two-dimensional- (2D) and ultra-broadband pump-probe-spectroscopy to disentangle the excited state dynamics in a metal bridged dimer ([LuPc2]), where the resonance- and CT-couplings are of equal magnitude. The influence of CT states and CT coupling on the excited state structure and dynamics is further studied via electrochemical tuning of the CT state energies. In addition, we investigate how specific details of ion-pairing enable ultrafast charge transfer across the complex. The combination of various approaches, both theoretical (quantum chemistry and density matrix propagation) and experimental (absorption, pump-probe and 2D spectroscopy), gives a detailed picture of the ultrafast CT dynamics.
II Experimental Methods
Lutetium(III)bisphthalocyanine-tetrabutyl-ammonium salt ([LuPc2]-TBA+), and its radical form [LuPc2]∙ were synthesized via a base catalyzed cyclotetramerization reaction of phthalonitrile with lutetiumacetate in the bulk-phase at elevated temperature. The synthesis was carried out using known procedures from the literature.Moussavi et al. (1988); Konami, Hatano, and Tajiri (1989) Both the synthetic preparation and the characterization of the complex are described in detail in the Supporting Information.Bixner (na)
The setup and methodology used for the 2D experiments has been described in detail previously.Milota et al. (2009) In the experiments reported here, a home built NOPA operated at 200 kHz repetition rate generated pulses centered at 15000 cm-1 with a bandwidth of 2500 cm-1 FWHM (Fig. 1). The FWHM of the intensity autocorrelation was 13 fs (9.2 fs pulse duration), while the corresponding width assuming a flat phase over the pulse spectrum was 10 fs. Two phase stable pulse pairs were generated by diffracting the NOPA pulses through a transmission grating. In the 2D experiment, the delay between the first two pulses, , was scanned with interferometric accuracy, while the delay between the second and third interaction, , was held constant. The signal radiated in the phasematching direction was overlapped with the local oscillator (LO), and the signal field was recovered by spectral interferometry. The 2D spectrum as a function of and was obtained by Fourier transforming over and addition of rephasing and non-rephasing signal contributions. The absolute phase of each 2D spectrum was determined by adjusting the LO delay and phase to optimize the overlap of the projection of the real part of the 2D spectrum with the spectrally resolved pump-probe signal.Bixner (na) [LuPc2]-TBA+ dissolved in benzonitrile was used in a wire-guided flow jet giving a film thickness of 230 m. The structure and linear absorption spectrum of [LuPc2]-TBA+ are shown in Fig. 1 together with the NOPA spectrum used in the experiments.
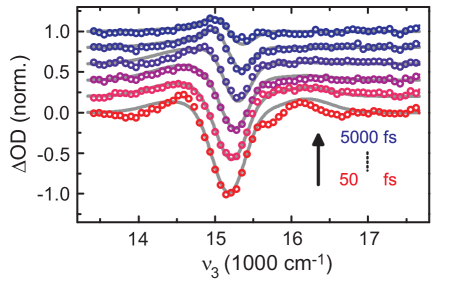
Broadband pump-probe measurements were carried out in a setup described in detail previously.Megerle et al. (2009) To extend the probe range to the NIR region, a home built OPA operating at 8300 cm-1 was used to generate white-light from 9000-25000 cm-1.Bradler, Baum, and Riedle (2009); Herrmann et al. (2011) To cover the bands in the UV region (25000-32000 cm-1), white-light was generated by focusing the output from the Ti:Sapphire laser into a CaF2 plate. Megerle et al. (2009) Pump pulses of approximately 40 fs duration were used to selectively excite the two bands at 14200 and 16200 cm-1 giving a time resolution of 50 fs.
III Results
III.1 Experimental Results
The interplay of exciton and CT states and their influence on the excited state dynamics in [LuPc2]- have been studied previously with pump-probe- and two-color photon echo-spectroscopy. Prall et al. (2005, 2004) The pump-probe measurements revealed that the transient spectra were independent of which of the two bands was pumped, indicating rapid relaxation in the excited state. To resolve the excited state dynamics we turned to 2D spectroscopy.Jonas (2003) By correlating the optical coherence evolution between the first and third time interval in a four-wave mixing sequence, 2D spectroscopy maps the system dynamics onto two dimensions, thereby minimizing spectral congestion and provides a very detailed picture of the system’s evolution.Cho (2008)
Fig. 2 shows the real part of the 2D spectrum of [LuPc2]-TBA+ in benzonitrile for 0, 15, 45, and 400 fs. The waiting time denotes the delay between the first and the second pulse pair, and corresponds to the probe delay in a pump-probe experiment. All spectra have been normalized to their respective maxima, and contour lines are drawn in 5 % increments. In Fig. 2, positive signals correspond to stimulated emission (SE) and ground state bleach (GSB), while excited state absorption (ESA) results in negative signals. The 2D spectrum at 15 fs (outside pulse overlap) shows two diagonal peaks corresponding to the two bands in the linear absorption spectrum. A closer inspection of the low energy diagonal peak reveals that it is more accurately described as two separate peaks at 14200 and 14800 cm-1, respectively. Above the high energy diagonal peak we observe small amounts of ESA (blue dashed lines). In addition to the diagonal peaks and ESA contributions, one cross-peak at , 14200, 16200 cm-1 is clearly visible. This cross-peak shows that the transitions responsible for the main bands in the linear absorption spectrum share a common ground state. Surprisingly, there is no corresponding cross-peak below the diagonal. For longer we find that the cross-peak below the diagonal recovers. However, the recovery of the cross-peak is not uniform. The 2D spectrum at 45 fs shows that the cross-peak at 14800 cm-1 grows much faster than the one at 14200 cm-1. For longer , the cross-peak below the diagonal becomes more symmetric, but its amplitude remains weaker than the amplitude of the opposite cross-peak for all .
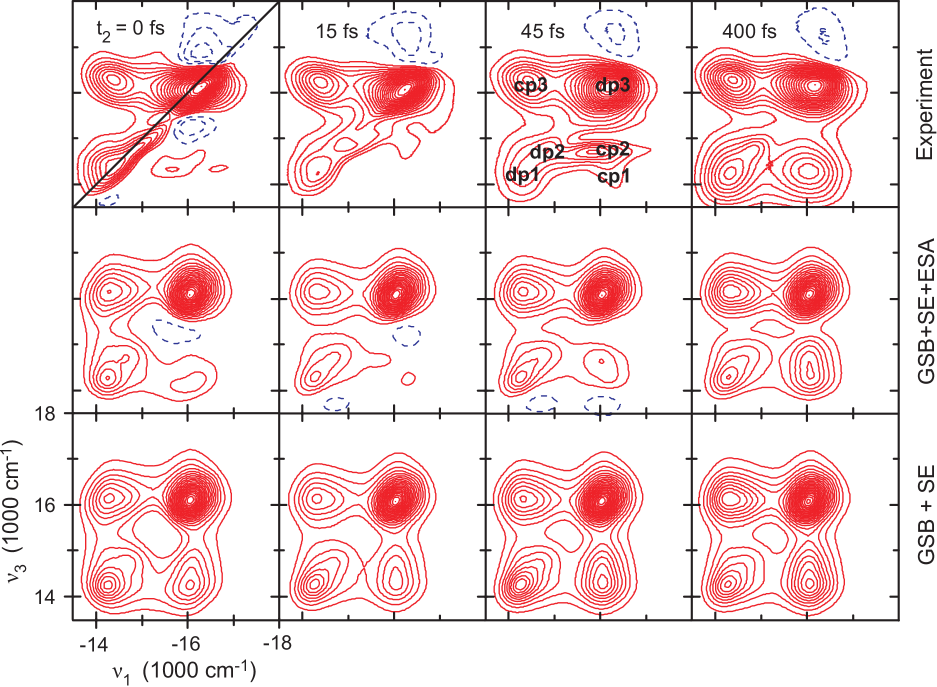
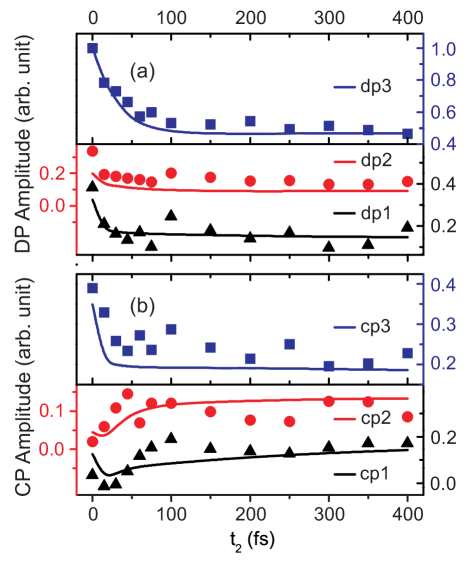
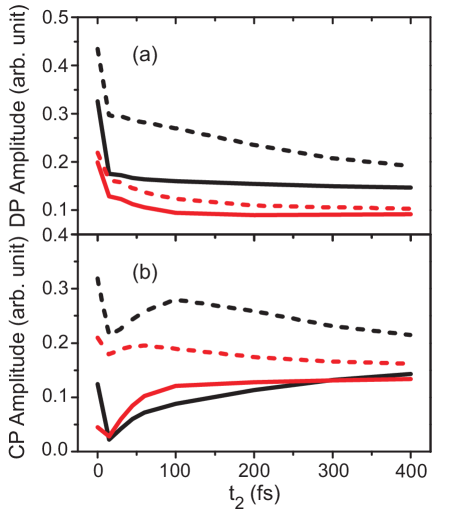
The 2D spectra in Fig. 2 do not provide an accurate picture of the dynamics in the system because of the normalization. The variation of the amplitudes of the different peaks as a function of provides information on population dynamics of the system which cannot be obtained from the normalized spectra. To analyze the kinetics, we show in Fig. 3 the time evolution of the volume of a 3030 cm-1 box for the diagonal peaks at 14200 (dp1), 14800 (dp2) and 16200 cm-1 (dp3), and the cross-peaks , 16200, 14300 cm-1 (cp1), , 16200, 14800 cm-1 (cp2), and , 14200, 16200 cm-1 (cp3). The positions of these points are also shown in Fig. 2 for 45 fs. The kinetics of the diagonal peaks all display a fast decay to about 50 % of the value at 0. The amplitude of dp3 decays on a 30 fs timescale, while dp1 and dp2 show an almost constant amplitude outside pulse overlap ( 15 fs). The cross-peaks exhibit more complicated behavior. While cp3 behaves qualitatively in the same way as dp3, the cross-peaks below the diagonal show distinct dynamics. The amplitude of cp2 rises on a 20 fs timescale followed by a quick decay. After about 50 fs, the rise is complete and the signal shows a slow oscillation around a stationary value. The amplitude of cp1 shows a delayed rise, reaching its peak value after about 100 fs. After reaching their final values, cp1 and cp2 both oscillate with a frequency of 160 cm-1. The same modulation is found in pump-probe Prall et al. (2005), two-color photon echo Prall et al. (2004). We can assign this mode, based on our quantum chemical calculations, to a modulation of the Lu-N distance.Bixner (na)
The appearance of the 2D spectrum for 30 fs deviates from what we expect for a coupled dimer, insofar as it does not display a characteristic four peak pattern Kjellberg and Pullerits (2006). The absence of a cross-peak below the diagonal gives rise to a pronounced asymmetry of the spectra. This effect clearly remains outside pulse overlap, but diminishes as the population relaxes from the upper band (decay of dp3). This points to ESA from the upper band as the origin of the cancellation of the cross-peak below the diagonal. As the ESA signal decays, the underlying GSB contribution becomes visible. Such relaxation should give rise to a SE signal in the region of the cross-peak below the diagonal (relaxation cross-peak). For this reason, we expect this cross-peak to be stronger than the corresponding one above the diagonal (cp3) when relaxation from the upper band has been completed. However, we find that the cross-peak below the diagonal remains weaker for all . This observation could in principle be explained by loss of the SE signal due to relaxation to a state outside the spectral window or into a state with low transition dipole moment. However, we see no indication of such relaxation in the kinetics of either dp1+dp2 or cp1+cp2. If the population remains in the lower band, the positive SE signal could be hidden by a negative ESA signal overlapping with the positive GSB of the low energy band. While this would explain the 2D kinetics, it cannot explain the reported lack of fluorescence from the low energy band Prall et al. (2005).
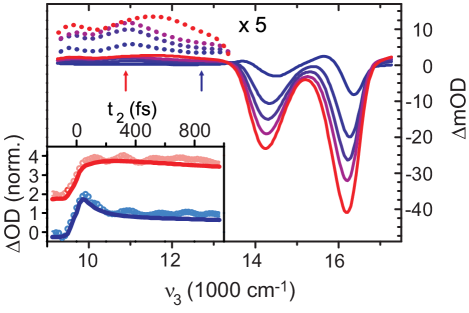
It thus becomes apparent that the 2D experiment, despite the 4500 cm-1 probe range, is not able to follow all relaxation processes in the system and cannot provide on its own the basis for a complete relaxation model. To be able to probe the response of (possible) low energy states in the NIR which are not covered in our 2D experiment, we turned to broadband pump-probe spectroscopy. Fig. 4 shows the pump-probe spectra in the NIR region for a few selected delays. At 100 fs, a broad ESA signal covers the entire region from 9000-13000 cm-1. For longer t2, the ESA around 12500 cm-1 (blue arrow) seems to decay significantly faster than the ESA below 11000 cm-1 (red arrow). The single wavelength fits shown in the inset reveal that the ESA at 10870 cm-1 decays with a 3.8 ps exponential component, which is equal to the lifetime of the lowest excited state obtained from a global fit.Bixner (na) On the other hand, the signal at 12500 cm-1 shows an additional 70-100 fs decay component. The kinetics in this spectral region reflects the sum of ESA and SE contributions. The additional fast decay of the signal at 12500 cm-1 can thus be interpreted as the delayed rise of SE from an almost dark state with a transition in the NIR region as discussed above. The SE signal at 12500 cm-1 is about 20 times weaker (1 compared to 20 mOD) than the main GSB peak at 14200 cm-1. The low transition dipole moment of this transition readily explains the lack of fluorescence in this system. For a 3.8 ps lifetime, we estimate a fluorescence quantum yield in the 10-5 range, beyond the detection sensitivity of our and previous experiments Prall et al. (2005).
The discussion of 2D and pump-probe spectra above provides a rough overview of electronic structure and ultrafast dynamics in [LuPc2]-TBA+. The states initially prepared by pumping the upper band decay to the low energy bright band on a 30 fs timescale. The presence of two diagonal peaks, and the distinct relaxation dynamics associated with cp1 and cp2 points to two separate electronic states in this band (Fig. 3). The population of these two states flows on a 100 fs timescale into an almost dark state with a transition in the NIR range (Fig. 4).
To elucidate the influence of the CT states on the electronic structure in [LuPc2], we carried out pump-probe experiments on [LuPc2]∙. Fig. 5 shows pump-probe spectra at selected delays together with the fit based on a kinetic model including the upper (optically allowed) exciton state, the lower (optically forbidden) exciton state, and a hot ground state. From the fit we conclude that the upper exciton level decays to the lower one with a 400 fs time-constant. From this level, there is an ESA transition to a doubly excited state. This doubly excited state is shifted by 550 cm-1 as compared to twice the LE energy. The red-shifted ESA from the dark state leads to a seemingly faster decay of the signal on the red side of the spectrum as the population flows into the low energy exciton state. Finally, the lower exciton level decays into a hot ground state with a 2.5 ps time-constant, where subsequent cooling takes place on a timescale of 15 ps.
III.2 Electronic Structure of [LuPc2]
To be able to interpret the experimental results on [LuPc2] and specifically to elucidate the role of the CT states, it is necessary to develop a model of the electronic structure enabling simulations of the linear- and nonlinear-spectra. Such a representation is provided by the Frenkel exciton Hamiltonian with LE and CT states.Abramavicius and Mukamel (2010) This model provides a descriptive picture of the interaction of optical excitations with CT states, which is useful for generalization and interpretation of the results. Furthermore, it allows us to include doubly excited states needed to account for ESA, which is extremely important for the interpretation of the 2D experiments.
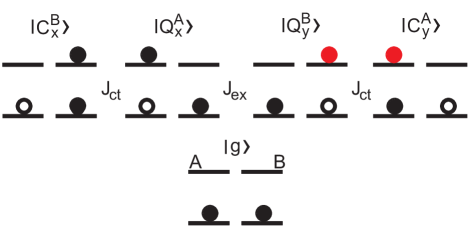
As a starting point we include the - and -excitations on each monomer (A and B). [LuPc2] exhibits symmetry Koike et al. (1996), e. g., the two rings are twisted by 45 degrees with respect to each other (Fig. 1). The transitions on the different monomers interact via resonance coupling, and due to the overlap of the wave functions, the excitations on the different rings are also coupled via electron transfer into the LUMO orbitals. This allows us to construct 4 distinguishable CT states. In our terminology, is the state where the excited electron is transferred from the excited x- or y-orbital on monomer B to the excited x-orbital on monomer A. A subset of the states used to construct the basis states is shown in Fig. 6. Using the configuration diagrams we can write the Hamiltonian for the one-exciton manifold as
| (1) |
where is the resonance- and is the CT-coupling.
Taking the rings as equivalent, , and assuming that , the present model recovers the previously proposed electronic structure of [LuPc2]- Ishikawa et al. (1992); Ishikawa (2001); Rousseau, Aroca, and Rodríguez-Méndez (1995). In this model, the band at 14200 cm-1 has predominant charge resonance character, while the band at 16200 cm-1 has a dominant exciton character. In addition, this model predicts one dark transition in the NIR region.Ishikawa et al. (1992) This exciton model agrees very well with our TD/DFT calculations on [LuPc2]- discussed in Appendix A. These calculations yielded three doubly degenerate electronic states with vertical transition energies of 11682, 15848 and 18657 cm-1, and oscillator strengths of 0.00, 0.45 and 1.03, respectively.
Both the exciton model in the form discussed above and the direct TD/DFT calculations predict two bright states in the relevant spectral range, i. e. the two main absorption bands. However, none of the models are able to explain the double peak structure of the low energy band or the distinct dynamics of the cross-peaks below the diagonal in the 2D spectra. To find an explanation for these additional features found in the experiment, we investigated the role of the counter-ion (TBA+) present in our experiments. NMR studies on a series of bisphthalocyanines have shown a considerable amount of ion association in solution.Haghighi, Peters, and Homborg (1994); Konami, Hatano, and Tajiri (1989) These experiments concluded that the counter-ion is situated on top of one of the Pc macrocycles as indicated in Fig. 1. This is similar to the arrangement in the crystal structure Koike et al. (1996), which we took as a starting point for the calculations of the optimized ground state geometries and vertical transition energies of the [LuPc2]-TBA+ complex. The calculations show that the interaction with the counter-ion leads to a splitting of the doubly degenerate states found for [LuPc2]-, giving rise to 6 transitions in the relevant spectral range. The energies, oscillator strengths and contributing orbitals for [LuPc2]-TBA+ as derived from quantum chemistry are shown in Table 1.
| (cm-1) | f | Orbitals | |
|---|---|---|---|
| 10384 | 0.001 | 51% HOMO[LUMO1], 48% HOMOLUMO | |
| 10449 | 0.003 | 51% HOMOLUMO, 48% HOMO[LUMO1] | |
| 15625 | 0.150 | 86% HOMO[LUMO2] | |
| 15823 | 0.156 | 85% HOMO[LUMO3] | |
| 17986 | 0.504 | 85% [HOMO1]LUMO | |
| 18116 | 0.523 | 85% [HOMO1][LUMO1] |
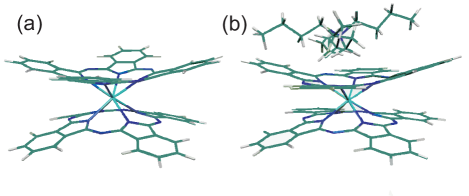
The association with the counter-ion leads to significant changes in the electronic structure of the complex and gives rise to additional allowed electronic transitions. To understand how these changes can be interpreted in terms of the energies and couplings between the states in the exciton model, Fig. 7 shows the optimized ground state geometry for [LuPc2]- and [LuPc2]-TBA+. For [LuPc2]-, the di-anionic rings (Pc2-) display a symmetric off-planarity distortion due to electrostatic interaction with the central metal ion. In the presence of the counter-ion, the off-planarity distortion is decreased significantly along the axis in contact with the alkyl chains of the TBA+ molecule. From an exciton model point of view, this implies that the excitation along this axis, here , on the ring closest to the counter-ion should be lowered in energy. Similarly, the state corresponding to CT into the same orbital should decrease in energy as well.
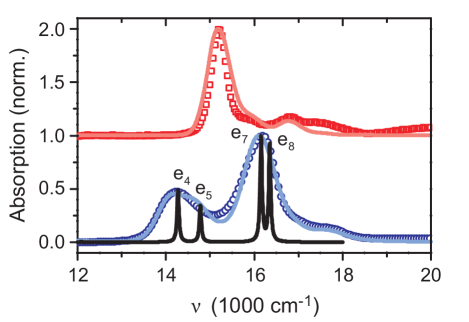
The simulations of the linear absorption spectra of [LuPc2]∙ and [LuPc2]-TBA+ based on Eq. 1 are shown in Fig. 8. For [LuPc2]-TBA+ we also show the stick-spectrum obtained after direct diagonalization of . Denoting the ring closest to the (positive) counter-ion A, we find that lowering the energy of (electron transfer towards the counter-ion) is able to mimic the general features of the electronic structure found in the quantum chemical calculations. For Fig. 8 we used 13500 cm-1, 15150 cm-1, 11600 cm-1, 1395 cm-1, and 725.5 cm-1. Based on the quantum chemical calculations, we expect that the interaction with the counter-ion should lead to a decrease of the energy of as well. However, changing the energy of by 500 cm-1 only leads to minor changes in the linear absorption spectrum and we therefore kept all -transitions degenerate for the remainder of the paper. To avoid confusion with the states obtained from quantum chemistry, we will denote the states of the exciton model with . States , and are located in the NIR and have very low or zero transition dipole moments. States and are located in the low energy band seen in linear absorption and are separated by 500 cm-1 (Fig. 8). This double peak structure in the low energy bright band is essential to reproduce the observations in the 2D spectrum. State is dark and is located in between the two bands, while states and are the origin of the upper band in linear absorption.
With the large number of states and couplings, a fit to the linear absorption spectrum is by no means unique. An important test of the validity of the model and the parameters is to apply the model derived for the [LuPc2]-TBA+ to [LuPc2]∙. The radical itself is non-polar and can therefore not stabilize the CT states. We modeled the spectrum of [LuPc2]∙ by raising the energies of the CT states to a spectral position where their influence on the transitions is negligible. In addition, we used that the -transitions are degenerate in the absence of the counter-ion. The successful prediction of the transition frequency, width of the main peak, and vibrational sideband for [LuPc2]∙ evident from Fig. 8 shows that we have correctly estimated the spectral densities, resonance coupling and -transition energies in [LuPc2].
The quantum chemical calculations and the exciton model represent two different descriptions of the electronic structure of [LuPc2]. The quantum chemical calculations adopt a supra-molecular perspective and include resonance- and CT-couplings between the two rings implicitly. The exciton model is based on distinguishable molecular excitations with free parameters (energies and couplings) and a minimum number of interactions. Using the language of the exciton model, the quantum chemical calculations include more states and couplings and will provide a more realistic molecular view. For instance, the quantum chemical calculations account for hole transfer and polarization of [LuPc2]-TBA+ in the ground state not included in the exciton model. However, the quantum chemical calculations do not provide any insight into the dynamics of the system or provide any information about doubly excited states, and therefore the combination of both models is needed for the interpretation of the experimental results. The states of the two models cannot be linked one-to-one, but a comparison of the excited state manifolds Bixner (na) suggests that one can well connect the dynamics of states , to , and , to and .
III.3 Excited State Dynamics in [LuPc2]-TBA+
The preceding paragraph outlined a realistic description of the electronic structure of [LuPc2]-TBA+. To interpret the observed excited state dynamics we carried out simulations of the 2D spectra based on the CT-Hamiltonian (Eq. 1) and time-dependent Redfield theory in the Markov approximation (see Appendix B). The simulated 2D spectra and kinetics are shown in the middle and bottom row in Fig. 2 and Fig. 3, respectively.
The simulations are in very good agreement with the experimental results, and reproduce the shape and evolution of the 2D spectra. At 0, there is a clear asymmetry, where the cross-peak below the diagonal is significantly weaker than the one above the diagonal. It follows from the comparison of the total simulated signal with the GSB+SE contribution (Fig. 2) that the missing cross-peak is due to overlap of ESA from population in the upper band. The simulations also reproduce the double peak structure of the low energy band, and we can assign this feature to the eigenstates and of the Hamiltonian . The splitting between dp1 and dp2 is close to the frequency of one of the vibrational modes found in the quantum chemical calculations (725 cm-1) Bixner (na). If dp2 was a vibrational sideband to dp1, this mode would need to have a Huang-Rhys factor on the order of 1 to match the observed amplitude. This would give rise to a progression of peaks not seen in the experiments. Furthermore, within the Condon approximation, all vibrational transitions involving the same mode would have the same direction of the transition dipole moment and we would thus expect to see clear cross-peaks between them. Christensson et al. (2011) The lack of a cross-peak between dp1 and dp2 is readily reproduced in our model (Fig. 2). This can can be understood from the perpendicular orientations of the transition dipole moments of e4 and e5, which suppresses cross-peaks by a factor of three in an experiment with all parallel polarizations.Hochstrasser (2001)
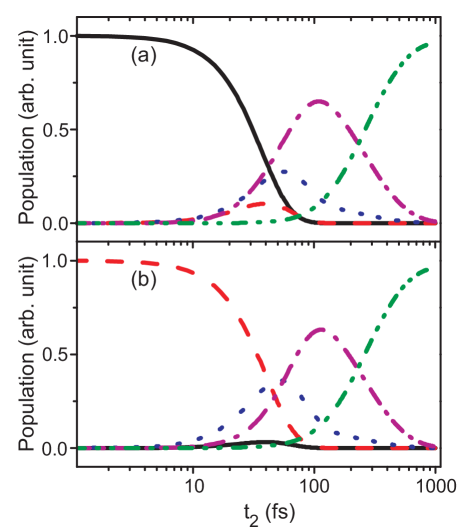
After excitation, coupling to the bath drives relaxation between energy levels in the one-exciton manifold leading to dynamics in the 2D spectrum. Fig. 9 shows the simulated evolution of the populations after excitation of state and corresponding to the band at 16200 cm-1. The initially prepared states decay and populate state within fs while the population of state rises somewhat slower. This is particularly obvious for initial excitation of state (Fig. 9(b)), where a clear separation of the rise of the population of and can be observed. By inspecting the relaxation rates, we can conclude that relaxation from and (Redfield ratesBixner (na) of 18 and 11 fs) is about 3 times faster than relaxation to state (64 and 75 fs). This indicates that the faster rise of cp2 can be traced to faster population relaxation into state . To investigate if this relaxation path also leads to clear signatures in the 2D spectra, we show in Fig. 10 the simulated kinetics with and without the ESA contribution. Inspecting the kinetics, we find that the cross-peaks indeed show a fast rise reflecting SE after population transfer from the upper band, and cp2 rises somewhat faster than cp1. However, the SE contribution in cp2 does not acquire significant amplitude due to fast relaxation from state . Although the ESA contribution strongly reshapes the kinetics in the 2D spectra, we can conclude that the dominating relaxation pathway from the upper band involves relaxation via state further on to .
Turning to the diagonal peaks, we find that the SE signal decays on a 250 fs timescale. Interestingly, this decay is almost absent when the kinetics of the total signal is evaluated (Fig. 10(b)). This implies that the ESA contribution has a similar magnitude as the SE contribution, and that they both decay as the population flows out of and . This matches the observations of the experiments, where the kinetics of the low energy diagonal peak show little dynamics even though it is clear from the pump-probe measurements that the dark states in the bottom of the manifold of excited states get populated on a 100 fs timescale.
The changes in the shape of the cross-peak below the diagonal during relaxation from the upper to the lower band could provide valuable information on the relaxation pathways. The experimental 2D spectrum at 45 fs (Fig. 2) shows that cp2 has its maximum at lower as compared to cp1. The simplest interpretation of this effect is that gets populated from while gets populated from . The kinetics shown in Fig. 9 shows that preferentially populates and thus gives some support for such a conclusion. However, inspecting the simulated spectra in Fig. 2, we can conclude that the inclusion of ESA is essential to reproduce the temporal evolution of the shape of the cross-peaks. The negative ellipticity of the cross-peaks (an elongation along the anti-diagonal) remains after relaxation, but is only reproduced when the ESA contribution is included in the simulations. The shape of the cross-peaks is thus not related to anti-correlated diagonal disorder Pisliakov, Mančal, and Fleming (2006) (site energies) or off-diagonal disorder (coupling disorder), but result from the overlap of the different signal contributions.
IV Discussion
IV.1 Role of Charge Transfer States in [LuPc2]
The ability to alter the CT state energies in [LuPc2] electrochemically gives a good opportunity to study the influence of CT states on the electronic structure and dynamics in a coupled system. In this respect, it is instructive to compare [LuPc2]- to [LuPc2]∙ and for a moment neglect the influence of the counter-ion. It is already clear from Fig. 1 that the presence of the CT states in [LuPc2]- dramatically changes the excited state structure giving rise to new transitions and a redistribution of the oscillator strength. Comparing the evolution of the upper state(s) in [LuPc2]∙ and [LuPc2]- illustrates that there is a strong impact on the dynamics as well: the lifetime decreases from 400 to 30 fs in the presence of the CT states. The results summarized in Fig. 8 show that our model can interpolate between [LuPc2]- and [LuPc2]∙ by just shifting the energy of the CT states, and this allows us to pinpoint the mechanism for the slower dynamics in [LuPc2]∙. Our model shows that the energetic splitting between the upper and lower band is significantly larger in [LuPc2]∙ ( cm-1) as compared to [LuPc2]- ( cm-1). We find that the fast rates in [LuPc2]- can only be reproduced when we include vibrational (molecular) modes in the bath. From this we conclude that the 1600 cm-1 mode responsible for the vibrational sideband in [LuPc2] plays a central role in the relaxation processes. To fully explain the rates in the experiments we need to account for the influence of the counter-ion. The association with the counter-ion splits the degenerate energy levels and opens up additional relaxation pathways in the appropriate energy range ( cm-1). Turning to [LuPc2]∙, we find that the energy gap is too large for relaxation via the high frequency vibrational mode. Relaxation must thus proceed via the (weak) high energy wing of the Brownian oscillator spectral density used to describe the overdamped bath modes. The difference in the relaxation rates between [LuPc2]- and [LuPc2]∙ is thus not related to the enhanced coupling to the bath of the CT states, but determined by the differences in the energy level structure of the two systems. We note that the speedup of relaxation in the presence of CT states depends on the details of the relaxation mechanism and the spectral densities. In the presence of high frequency vibrational modes, the larger system-bath coupling of the CT states may not necessarily lead to a significant increase in the relaxation rates as was shown recently in a simulation study of the photosystem II reaction center.Abramavicius and Mukamel (2010)
From the geometrical structure and linear optical properties, [LuPc2]- seems to be a highly suitable candidate for investigations of fundamental processes like electronic coherence dynamics, dephasing and population relaxation. Such studies would be valuable for a better understanding of the more complicated dynamics observed in protein pigment complexesWomick and Moran (2009); Zigmantas et al. (2006); Turner et al. (2011). However, the 2D spectra of [LuPc2]-TBA+ show distinct differences to the dimer models in the literature Kjellberg and Pullerits (2006); Pisliakov, Mančal, and Fleming (2006); Egorova, Gelin, and Domcke (2007); Voronine, Abramavicius, and Mukamel (2006); Abramavicius et al. (2010); Yuen-Zhou and Aspuru-Guzik (2011); Cho and Fleming (2005); Chen et al. (2010). These differences cannot be explained by a rapid damping of the electronic coherences due to stronger system-bath coupling of the CT states. Rather, our analysis shows that including vibrational modes as well as employing a proper model for the two-exciton manifold is needed in order to understand the spectra and dynamics. The properties of the states in the two-exciton manifold responsible for ESA cannot be deduced from available quantum chemical calculation with the needed precision, and therefore we need to resort to the exciton model. Perhaps the most prominent observation in the present experiments is the absence of a cross-peak below the diagonal at short population times (or lack of SE in pump-probe). While this requires a special structure of the two-exciton manifold, the same effect can show up in any coupled system. In fact, such cancelation happens readily in the exciton model when the two LEs have unequal transition dipole moments. The absence of the cross-peak should thus not be seen as a direct effect of the CT states, but illustrates the importance of the two-exciton manifold and ESA for a proper interpretation of the spectra and dynamics. This might seem surprising because the 2D spectra are dominated by positive signal contributions (Fig. 2). However, ESA reshapes the peaks and strongly affects the observed kinetics (Fig. 10). We note that our simple model for the two-exciton band can account for the cancelation of the cross-peak below the diagonal as well as the absence of decay dynamics in the low energy band. To reach this agreement we need to shift the two-exciton band by 1000 cm-1 from the values estimated from the Frenkel exciton model. A similar redshift of the two-exciton manifold can be observed in [LuPc2]∙ (550 cm-1), indicating that electron correlation effects Raghavachari and Anderson (1996) are significant in this system even in the absence of the CT states. Inspecting the (full) pump-probe spectrum, one finds a very broad ESA covering the entire visible spectral range.Bixner (na) In order to reproduce the ESA spectrum in the visible spectral range, we would need to include more (high energy) configurations to the two-exciton Hamiltonian. The interaction of these high energy configurations with the ones included in our model could further contribute to the red-shift of the ESA observed in the experiments.
The current experiments and analysis highlight the importance of the two-exciton manifold for the interpretation of time-resolved spectroscopy of processes which take place exclusively in the one-exciton manifold. In one-dimensional techniques, like pump-probe or transient grating, the presence of ESA may easily be overlooked leading to erroneous interpretation of the dynamics. In this respect, the combination of single- and double-quantum 2D spectroscopy is most useful to elucidate the role of ESA and the associated signal contributions.Nemeth et al. (2010); Christensson et al. (2010)
The pronounced influence of ESA in [LuPc2] makes in-depth analysis of the 2D spectra without numerical modeling difficult. Such simulations require a simple Hamiltonian mimicking the electronic structure of the system. There are many models which could fit the linear spectrum and give rise to a suppressed cross-peak below the diagonal which grows as increases, e. g., the simple exciton model with unequal transition dipole moments of the two LEs or the isolated [LuPc2]- model discussed above. However, none of these models are able to reproduce the dynamics in the cross-peak below the diagonal, or the double peak structure of the low energy band. By linking the exciton model to quantum chemical calculations, it is clear that precisely these features are signatures of special interactions, and that they provide important information on the dynamics in the system.
IV.2 Excited State Charge Transfer in [LuPc2]-TBA+
The association of [LuPc2]- with the TBA+ counter-ion provides a natural explanation for the observation of the double peak structure in the low energy band in the 2D spectra (Fig. 2 and Fig. 8). The formation of such ion-pairs has strong impact on the character of the excited states. The (positive) charge of the counter-ion serves to stabilize states representing CT towards the counter-ion. This gives rise to an asymmetry in the energies of the CT states, and as a result, the electronic eigenstates in [LuPc2]-TBA+ will reflect varying degrees of charge separation. Relaxation between the different energy levels thus represents a net redistribution of electron and hole densities between the two rings, which can be followed by the evolution of the cross-peaks in the 2D spectra. By combining the analysis of the cross-peak dynamics within the exciton model with the results of the quantum chemical calculations, it becomes possible to obtain a molecular view of the CT dynamics.
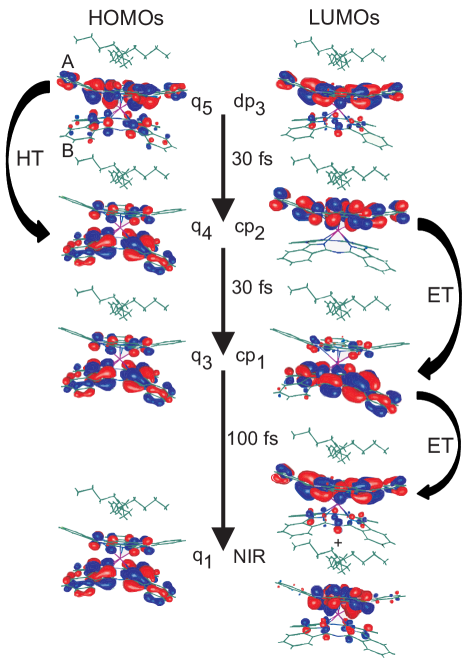
Fig. 11 shows the orbitals for the different bright transitions with labels indicating the states and the corresponding features in the spectrum in Fig. 2. In addition, curved arrows are used to indicate the CT processes connecting the different states. An excitation of the high energy band (dp3) populates an excited state with most of the charge density located on the side of the counter-ion (ring A). The system first relaxes via hole transfer (CT in the HOMO orbital) to ring B in 30 fs. This process is revealed via the faster rise of cp2 in the 2D spectrum. Further relaxation requires electron transfer (CT in the LUMO orbital) to ring B, and we find that this process also takes place on a 30 fs timescale. The system then goes to a stable (on ps timescale) charge separated state with a transition in the NIR. For this state, the excited state charge density is located on the ring closest to the counter-ion. Our pump-probe measurements reveal that population of the dark states in the NIR takes only about 100 fs. The combination of CT states and asymmetric interaction with the counter-ion thus opens up a relaxation pathway which very rapidly localizes the charge on one side of the complex. At first glance, one may assume that the counter-ion lowers the energy of both and and stabilizes the charge in both orbitals on the side of the counter-ion. However, it is clear from both the quantum chemical calculations as well as the exciton model that the molecular details of the interaction between [LuPc2]- and the counter-ion need to be considered. The counter-ion induces different distortions of the molecular structure along the x- and y-coordinates, and this also affects the energies of the CT states representing CT into the corresponding orbitals on the macrocycle closest of the counter-ion. This selectivity is clearly manifested in the orbitals shown in Fig. 11, and shows that a detailed understanding of the ultrafast dynamics requires careful consideration of the interactions in the ion-pair.
[LuPc2]-TBA+ has many similarities to the so called special pair in the bacterial reaction center. The special pair is a dimer of bacteriochlorophylls coupled to CT states with higher transition energy than the fundamental excitations.Renger (2004) However, because of different orientation of the transition dipoles, the lowest excited state (often named P-) carries most of the oscillator strength. Charge separation in the special pair takes place after direct excitation or energy transfer to P-. Numerous works have concluded that P- corresponds to a state with most of the charge density located on the M-side of the special pair. This localization of the charge density has been explained by specific interactions, such as hydrogen bonds Moore, Zhou, and Boxer (1999); Parson and Warshel (1987), asymmetric interaction with the protein Gunner, Nicholls, and Honig (1996); Steffen, Lao, and Boxer (1994), or a special arrangement and interaction of the reaction center pigments Kolbasov and Scherz (2000); Parson and Warshel (1987); Scherer and Fischer (1989); Ren et al. (2009). In the language of the exciton model, all these mechanisms serve to lower the CT states on one side of the complex in a similar way as the counter-ion in our case. Our results show that the presence of an asymmetric interaction facilitates relaxation to the bottom of the band, where the charge is localized on one side of the complex. In the special pair, the relaxation time between the upper and lower exciton band has been measured to be 65 fs.Arnett et al. (1999) The localization of the charge density on the M side of the special pair is thought to be important for the directionality of electron transfer in the bacterial reaction center, since the M side has a better overlap with the accessory bacteriochlorophyll on the L branch Ren et al. (2009). Our experiments show that this type of charge localization can be mimicked by our model system, and followed in real time with 2D spectroscopy. The combination of 2D spectroscopy and theoretical analysis including density matrix propagation and quantum chemical calculations thus offers new possibilities to disentangle the complicated CT dynamics observed in the photosystem II reaction center Myers et al. (2010); Lewis and Ogilvie (2012).
V Conclusions
In this work we have investigated the electronic structure and excited state dynamics in a bis-phthalocyanine dimer ([LuPc2]-) where the resonance- and CT-coupling are of the same magnitude. To selectively investigate the effects from the resonance coupling, we have exploited the possibility to "turn off" the CT coupling by oxidation of the complex ([LuPc2]∙). Based on linear absorption, 2D spectroscopy and pump-probe measurements, we have shown that the mixing of exciton and CT states in [LuPc2]- leads to significant changes of the electronic structure and a tenfold speed-up of the excited state dynamics as compared to the excitonic [LuPc2]∙. The speed-up of the dynamics in [LuPc2]- can be qualitatively understood from the changes in the energy level spacing due to the presence of CT states in combination with quasi-resonances between the energy gaps and high frequency vibrational modes. However, a detailed analysis of the 2D spectra has shown that the interaction of [LuPc2]- with its TBA+ counter-ion needs to be considered to account for all peaks and their evolution. Using quantum chemical calculations, we have demonstrated that the specific details of the interaction in the ion-pair determines the electronic structure of [LuPc2]-TBA+. The interaction with the counter-ion stabilizes CT states corresponding to CT into specific orbitals on the macrocycle closest to the counter-ion. The subsequent imbalance in energy of the CT states results in an electronic structure where the different excited states represent varying degrees of charge separation. Relaxation in the excited state of the complex thus proceeds via electron- and hole-transfer processes, which give rise to distinct cross-peak dynamics in the 2D spectra. The analysis of the cross-peak dynamics, together with quantum chemical calculations, demonstrate the ability of 2D electronic spectroscopy to provide a detailed molecular view on these transient CT processes.
Acknowledgements.
This work was supported by the Austrian Science Foundation (FWF), projects P223311 and F016-18 (SFB ADLIS), Österreichischer Austauschdienst (OeAD, WTZ CZ07/2011), and the Deutsche Forschungsgemeinschaft through the DFG-Cluster of Excellence Munich-Centre for Advanced Photonics. V.L. thanks for the opportunity to use the computer facilities at the University of Vienna (Schrödinger Cluster) and at the Institute of Theoretical Chemistry, University of Vienna. T.M. acknowledges support by the Czech Science Foundation (GACR) through grant No. 205/10/0989 and by the Ministry of Education, Youth, and Sports of the Czech Republic through grant KONTAKT ME899 and the research plan No. MSM0021620835. N.C. acknowledges support from the Wenner-Gren foundation.Appendix A. Quantum Chemical Calculations
The BHLYP Becke (1993a) functional was applied in Density Functional Theory (DFT) and time-dependent (TD-)DFT Bauernschmitt et al. (1997) calculations of optimal electronic ground state and lowest singlet excited-state geometries. This functional combines Becke´s half-and-half exchange functional with the LYP correlation functional proposed by Lee, Yang and Parr. Among the tested functionals (PBE Perdew, Burke, and Ernzerhof (1996), B3LYP Becke (1993b), and BHLYP Becke (1993a)), the overall best results were obtained using BHLYP, which can be explained by the larger amount of exact exchange Dreuw and Head-Gordon (2004). The optical transitions were calculated using (TD)-DFT on the basis of the optimized geometries. We employed the split valence basis sets def-SV(P) (for N, C, H and O atoms) and def-ecp for lutetium Dunning and Hay (1977) from the TURBOMOLE library. Herein, valence orbitals were calculated in a double-zeta basis and augmented with higher angular momentum polarization functions to account for the nonplanarity of the macrocycles. All quantum chemical calculations were performed with the Turbomole 5.7 package Ahlrichs et al. (1989).
Appendix B. Simulations of Excited State Dynamics and Non-linear Spectra
Excited state dynamics were simulated by applying time-dependent Redfield theory to the diagonalized Frenkel exciton Hamiltonian of the system.May and Kühn (2000) Altogether eight singly excited electronic states were considered in the [LuPc2] dimer. In addition to the local -excitations on each Pc ring, CT states corresponding to electron transfer from the excited state orbital on one macrocycle to the excited state orbital on the other ring were considered. The CT states were modeled as excited states with zero transition dipole moment from the electronic ground state and increased reorganization energy (with respect to the LE states).Renger (2004); Mančal, Valkunas, and Fleming (2006) The sign of the resonance coupling matrix elements, , was determined from the structure. For the coupling between CT and LE states, , we chose the signs of the matrix elements so that the Hamiltonian was invariant under rotation of the rings. The magnitudes of and were fitted to the linear absorption spectrum. Linear and non-linear spectra were calculated by a standard semiclassical response function theory.Mukamel (1995) For calculation of non-linear spectra we constructed response functions corresponding to GSB, SE, and ESA in the Markov approximation Zhang et al. (1998), i.e. neglecting correlations between the systems time evolution in different intervals of the response functions. Orientational average was directly taken into account for each response function.Hochstrasser (2001) To describe line shapes and kinetics of the peaks, the dissipative population and coherence dynamics have to be calculated for the electronic states of the molecule. Dissipation was included via an analytical form of the time-dependent Redfield equation, invoking the secular approximation.Bixner (na) For the calculation of the nonlinear spectra, the two-exciton manifold responsible for the ESA contributions needs to be included. As a first approximation we included the 28 states which can be constructed by simultaneous excitation of two single exciton transitions (doubly excited states). This is a straightforward generalization of the usual Frenkel exciton model to the case of CT states. However, electron correlation effects Raghavachari and Anderson (1996), or inclusion of doubly excited monomeric states Pullerits, Chachisvilis, and Sundström (1996) can shift the energy of the two-exciton manifold. To account for these effects, not included in our model, we adjusted the energy of the two-exciton band to obtain the best agreement between simulation and experiment. A more rigorous treatment of the two-exciton CT band would have to account for various special properties of the combined doubly excited states, e.g., the fact that some double CT configurations result in normal double exciton states.Abramavicius and Mukamel (2010) For calculation of the dephasing in the ESA part of the signal, the depopulation rates of the doubly-excited states are required. Here we assumed that the depopulation rates are equal in the one- and two-exciton manifolds.
The coupling of the electronic transitions to the bath, described by the spectral density, determines both the line shapes and the population relaxation rates. Each transition was coupled to 3 vibrational modes with frequencies of 160, 725, and 1600 cm-1 and Huang-Rhys factors of 0.3, 0.4, and 0.3, respectively. Additionally, one over-damped Brownian oscillator with reorganization energy of 80 cm-1 and a decay rate of 100 fs-1 was used. For the CT states, we increased the coupling to the over-damped mode by a factor of 1.3. The vibrational modes are needed in order to reproduce the vibrational sideband in linear absorption as well as the fast rates found for [LuPc2]-. In all calculations of optical spectra, we explicitly averaged the signals over 1000 configurations where the transition energies were randomly sampled from a Gaussian distribution with a FWHM of 300 cm-1.
References
- Marcus and Sutin (1985) R. A. Marcus and N. Sutin, Biochim. Biophys. 811, 265 (1985).
- Deibel, Strobel, and Dyakonov (2010) C. Deibel, T. Strobel, and V. Dyakonov, Adv. Mat. 22, 4097 (2010).
- Durrant and Clarke (2010) J. R. Durrant and T. M. Clarke, Chem. Rev. 110, 6736 (2010).
- Herrmann et al. (2011) D. Herrmann, S. Niesar, C. Scharsich, A. Köhler, M. Stutzmann, and E. Riedle, J. Am. Chem. Soc. 133, 18220 (2011).
- Blankenship (2002) R. E. Blankenship, Molecular Mechanisms of Photosynthesis (Wiley-Blackwell, 2002).
- Meech, Hoff, and Wiersma (1986) S. R. Meech, A. J. Hoff, and D. A. Wiersma, Proc. Natl. Acad. Sci. USA 83, 9464 (1986).
- Novoderezhkin, Dekker, and van Grondelle (2007) V. I. Novoderezhkin, J. P. Dekker, and R. van Grondelle, Biophys. J. 93, 1293 (2007).
- Bauer et al. (2005) A. Bauer, F. Westkämper, S. Grimme, and T. Bach, Nature 436, 1139 (2005).
- Renger (2004) T. Renger, Phys. Rev. Lett. 93, 188101 (2004).
- Mančal, Valkunas, and Fleming (2006) T. Mančal, L. Valkunas, and G. R. Fleming, Chem. Phys. Lett. 342, 301 (2006).
- May and Kühn (2000) V. May and O. Kühn, Charge and Energy Transfer Dynamics in Molecular Systems (Wiley-VCH, Berlin, 2000).
- Koike et al. (1996) N. Koike, H. Uekusa, Y. Ohashi, C. Harnoode, F. Kitamura, T. Ohsaka, and K. Tokuda, Inorg. Chem. 35, 5798 (1996).
- Moussavi et al. (1988) M. Moussavi, A. D. Cian, J. Fischer, and R. Weiss, J. Opt. Soc. Am. B 27, 1287 (1988).
- Ishikawa et al. (1992) N. Ishikawa, O. Ohno, Y. Kaizu, and H. Kobayashi, J. Phys. Chem. 96, 8832 (1992).
- Bouvet and Simon (1990) M. Bouvet and J. Simon, Chem. Phys. Lett. 172, 299 (1990).
- Maitrot et al. (1987) M. Maitrot, G. Guillaud, B. Boudjema, J.-J. André, H. Strzelecka, J. Simon, and R. Even, Chem. Phys. Lett 133, 59 (1987).
- Kadish et al. (2001) K. M. Kadish, T. Nakanishi, A. Gürek, V. Ahsen, and I. Yilmaz, J. Phys. Chem. B 105, 9817 (2001).
- Nicholson (1982) M. M. Nicholson, Ind. Eng. Chem. Prod. Res. Dev. 21, 261 (1982).
- Ostendorp and Homborg (1996) G. Ostendorp and H. Homborg, Z. Anorg. Allg. Chem. 622, 1222 (1996).
- Kolbasov and Scherz (2000) D. Kolbasov and A. Scherz, J. Phys. Chem B 104, 1802 (2000).
- Gunner, Nicholls, and Honig (1996) M. R. Gunner, A. Nicholls, and B. Honig, J. Phys. Chem. 104, 4277 (1996).
- Wakeham and Jones (2005) M. Wakeham and M. Jones, Biochem. Soc. Trans. 33, 851 (2005).
- Steffen, Lao, and Boxer (1994) M. A. Steffen, K. Lao, and S. G. Boxer, Science 264, 810 (1994).
- Moore, Zhou, and Boxer (1999) L. J. Moore, H. Zhou, and S. G. Boxer, Biochemistry 38, 11949 (1999).
- Cembran et al. (2005) A. Cembran, F. Bernardi, M. Olivucci, and M. Garavelli, Proc. Natl. Acad. Sci. USA 102, 6255 (2005).
- Vakarin, Holovko, and Piotrowiak (2002) E. V. Vakarin, M. F. Holovko, and P. Piotrowiak, Chem. Phys. Lett. 363, 7 (2002).
- Marcus (1998) R. A. Marcus, J. Phys. Chem. B 102, 10071 (1998).
- Piotrowiak (1994) P. Piotrowiak, Inorg, Chim. Acta 225, 269 (1994).
- Piotrowiak and Miller (1993) P. Piotrowiak and J. R. Miller, J. Phys. Chem. 97, 13052 (1993).
- Konami, Hatano, and Tajiri (1989) H. Konami, M. Hatano, and A. Tajiri, Chem. Phys. Lett. 160, 163 (1989).
- Bixner (na) See Supplementary material for details of the synthesis, phasing of the 2D spectra to pump-probe, vibrational modes obtained from the quantum chemical calculations, a comparison of the transitions obtained from quantum chemistry and the exciton model, a discussion of the time dependent Redfield equation, and broadband pump-probe spectra of the anion .
- Milota et al. (2009) F. Milota, J. Sperling, A. Nemeth, and H. F. Kauffmann, Chem. Phys. 357, 45 (2009).
- Megerle et al. (2009) U. Megerle, I. Pugliesi, C. Schriever, C. F. Sailer, and E. Riedle, Appl. Phys. B - Lasers Opt. 96, 215 (2009).
- Bradler, Baum, and Riedle (2009) M. Bradler, P. Baum, and E. Riedle, Appl. Phys. B - Lasers Opt. 97, 561 (2009).
- Prall et al. (2005) B. S. Prall, D. Y. Parkinson, N. Ishikawa, and G. R. Fleming, J. Phys. Chem. A 109, 10870 (2005).
- Prall et al. (2004) B. S. Prall, D. Y. Parkinson, G. R. Fleming, M. Yang, and N. Ishikawa, J. Chem. Phys. 120, 2537 (2004).
- Jonas (2003) D. M. Jonas, Annu. Rev. Phys. Chem. 54, 425 (2003).
- Cho (2008) M. Cho, Chem. Rev. 108, 1331 (2008).
- Kjellberg and Pullerits (2006) P. Kjellberg and T. Pullerits, J. Chem. Phys. 124, 24106 (2006).
- Abramavicius and Mukamel (2010) D. Abramavicius and S. Mukamel, J. Phys. Chem. 133, 184501 (2010).
- Ishikawa (2001) N. Ishikawa, J. Porphyr. Phthalocyanines 5, 87 (2001).
- Rousseau, Aroca, and Rodríguez-Méndez (1995) R. Rousseau, R. Aroca, and M. Rodríguez-Méndez, J. Mol. Struct. 356, 49 (1995).
- Haghighi, Peters, and Homborg (1994) M. S. Haghighi, G. Peters, and H. Homborg, Z. Anorg. Allg. Chem. 620, 1285 (1994).
- Christensson et al. (2011) N. Christensson, F. Milota, J. Hauer, J. Sperling, O. Bixner, A. Nemeth, and H. F. Kauffmann, J. Phys. Chem. B 115, 5383 (2011).
- Hochstrasser (2001) R. M. Hochstrasser, Chem. Phys. 266, 273 (2001).
- Pisliakov, Mančal, and Fleming (2006) A. V. Pisliakov, T. Mančal, and G. R. Fleming, J. Chem. Phys. 124, 234504 (2006).
- Womick and Moran (2009) J. M. Womick and A. M. Moran, J. Phys. Chem. B 113, 15771 (2009).
- Zigmantas et al. (2006) D. Zigmantas, E. L. Reed, T. Mancal, T. B. A. T. Gardiner, R. J. Cogdell, and G. R. Fleming, Proc. Natl. Acad. Sci. USA 103, 12672 (2006).
- Turner et al. (2011) D. B. Turner, K. E. Wilk, P. M. G. Curmi, and G. D. Scholes, J. Phys. Chem. Lett. 15, 1904 (2011).
- Egorova, Gelin, and Domcke (2007) D. Egorova, M. F. Gelin, and W. Domcke, J. Chem. Phys. 126, 074314 (2007).
- Voronine, Abramavicius, and Mukamel (2006) D. V. Voronine, D. Abramavicius, and S. Mukamel, J. Chem. Phys. 125, 224504 (2006).
- Abramavicius et al. (2010) D. Abramavicius, V. Butkus, J. Bujokas, and L. Valkunas, Chem. Phys. 372, 22 (2010).
- Yuen-Zhou and Aspuru-Guzik (2011) J. Yuen-Zhou and A. Aspuru-Guzik, J. Chem. Phys. 134, 134505 (2011).
- Cho and Fleming (2005) M. Cho and G. R. Fleming, J. Chem. Phys. 123, 114506 (2005).
- Chen et al. (2010) L. Chen, R. Zheng, Q. Shi, and Y. Yan, J. Chem. Phys. 132, 024505 (2010).
- Raghavachari and Anderson (1996) K. Raghavachari and J. B. Anderson, J. Phys. Chem. 100, 12960 (1996).
- Nemeth et al. (2010) A. Nemeth, F. Milota, T. Mančal, T. Pullerits, J. Sperling, J. Hauer, H. F. Kauffmann, and N. Christensson, J. Chem. Phys. 133, 094505 (2010).
- Christensson et al. (2010) N. Christensson, F. Milota, A. Nemeth, I. Pugliesi, E. Riedle, J. Sperling, T. Pullerits, H. F. Kauffmann, and J. Hauer, J. Phys. Chem. Lett. 1, 3366 (2010).
- Parson and Warshel (1987) W. W. Parson and A. Warshel, J. Am. Chem. Soc. 109, 6152 (1987).
- Scherer and Fischer (1989) P. O. J. Scherer and S. F. Fischer, Chem. Phys. 131, 115 (1989).
- Ren et al. (2009) Y. Ren, W. Ke, Y. Li, L. Feng, J. Wan, and X. Xu, J. Phys. Chem. B 113, 10055 (2009).
- Arnett et al. (1999) D. C. Arnett, C. C. Moser, P. L. Dutton, and N. F. Scherer, J. Phys. Chem. B 103, 2014 (1999).
- Myers et al. (2010) J. Myers, K. Lewis, F. Fuller, P. Tekavac, C. Yocum, and J. Ogilvie, J. Phys. Chem. Lett. 1, 2774 (2010).
- Lewis and Ogilvie (2012) K. L. M. Lewis and J. P. Ogilvie, J. Phys. Chem. Lett. 3, 503 (2012).
- Becke (1993a) A. D. Becke, J. Chem. Phys. 98, 1372 (1993a).
- Bauernschmitt et al. (1997) R. Bauernschmitt, M. Häser, O. Treutler, and R. Ahlrichs, Chem. Phys. Lett. 264, 573 (1997).
- Perdew, Burke, and Ernzerhof (1996) J. P. Perdew, K. Burke, and M. Ernzerhof, Phys. Rev. Lett. 77, 3865 (1996).
- Becke (1993b) A. D. Becke, J. Chem. Phys. 98, 5648 (1993b).
- Dreuw and Head-Gordon (2004) A. Dreuw and M. Head-Gordon, J. Am. Chem. Soc. 126, 4007 (2004).
- Dunning and Hay (1977) T. H. Dunning and P. J. Hay, Methods of Electronic Structure Theory (Plenum Press, New York, 1977).
- Ahlrichs et al. (1989) R. Ahlrichs, M. Bär, M. Häser, H. Horn, and C. Kölmel, Chem. Phys. Lett. 162, 165 (1989).
- Mukamel (1995) S. Mukamel, Principles of Nonlinear Optical Spectroscopy (Oxford University Press, New York, 1995).
- Zhang et al. (1998) W. M. Zhang, T. Meier, V. Chernyak, and S. Mukamel, J. Chem. Phys. 108, 7763 (1998).
- Pullerits, Chachisvilis, and Sundström (1996) T. Pullerits, M. Chachisvilis, and V. Sundström, J. Phys. Chem. 100, 10787 (1996).