Universality, limits and predictability of gold-medal performances at the Olympic Games
Abstract
Inspired by the Games held in ancient Greece, modern Olympics represent the world’s largest pageant of athletic skill and competitive spirit. Performances of athletes at the Olympic Games mirror, since , human potentialities in sports, and thus provide an optimal source of information for studying the evolution of sport achievements and predicting the limits that athletes can reach. Unfortunately, the models introduced so far for the description of athlete performances at the Olympics are either sophisticated or unrealistic, and more importantly, do not provide a unified theory for sport performances. Here, we address this issue by showing that relative performance improvements of medal winners at the Olympics are normally distributed, implying that the evolution of performance values can be described in good approximation as an exponential approach to an a priori unknown limiting performance value. This law holds for all specialties in athletics – including running, jumping and throwing – and swimming. We present a self-consistent method, based on normality hypothesis testing, able to predict limiting performance values in all specialties. We further quantify the most likely years in which athletes will breach challenging performance walls in running, jumping, throwing and swimming events, as well as the probability that new world records will be established at the next edition of the Olympic Games.
Introduction
Modern
Olympics are inspired by the ancient version of the Games, but
based on a wider idea of globality. While
ancient Games were opened only to Greek
speaking athletes Swaddling2000 , modern Olympics
were, since their beginning,
considered a world event involving people from
every part of the globe Guttmann2002 .
The same symbol of the Olympics, composed of five interlocking rings standing for
the five continents, was designed
by the Baron Pierre de Coubertin, the founder of the modern Olympic Games,
with the aim of reinforcing the idea that the Games
are an international event and welcome all countries
of the world knight92 .
Since Athens ,
editions of the event has been organized in different
locations around the world, and, from
the participants representing
nations of the first edition,
the Games have grown to about competitors
from countries at the latest
edition of the summer Games of Beijing . The Olympics are
one the most important events worldwide not only
for sports, but also for politics and
society. Many important facts of the last century
history, such as the Nazism Mandell1971 , the Israeli-Palestinian
conflict Reeve2000 , and
the cold war Guttmann1988 , have influenced
the regular organization of the Games.
Also, the Olympics generally play a fundamental
and positive role for the economic and urban development of the
city that hosts the event Waitt2003 ; H2004 .
Performance data
of athletes at the Olympics are available for each modern edition
of the Games organized so far, and represent
an optimal proxy for the study of
human limits in sport performances
for three main reasons:
(i) Data cover more than a century of sport performances
since the first edition of the Olympics dates back to ;
(ii) Olympic data provide a detailed record of sports performances at
regular -year intervals;
(iii) The performances of Olympic medalists truly reflect the
best achievements that could be obtained in a given
historic moment because, in the
vast majority of sport disciplines,
the Games have always represented the most important event
during the career of an athlete, and consequently all the greatest
athletes have always taken part in the Olympics.
Latest years have witnessed the appearance of a large
number of statistical studies of data coming from professional sports.
Examples include basketball Ben-Naim2005 ; Yaari2011 , baseball Sire2008 ; Petersen2008 ; Saavedra2009 ; Petersen2010a ; Petersen2011 , soccer Duch2010 , tennis Radicchi2011 , etc.
Also Olympic performance data
have been the subject of many
analyses Tibshirani1997 ; Grubb1998 ; Sparling1998 ; Katz1999 ; Savaglio2000 ; Holden2004 ; Atkinson2004 ; Nevill2005 ; Nevill2007 ; Denny2008 ; Sabhapandit2008 . Some of them focused on models aimed at
the description of performance progression along time, including
linear models Atkinson2004 that can even lead
to unrealistic results Sharp2004 ; Rice2004 ,
S-shaped curves Nevill2005 and logistic functions Denny2008 .
Others studied statistical properties of performance
patterns, such as the power-law relation
between time (or speed) and length of running
events Grubb1998 ; Katz1999 ; Savaglio2000 .
In addition, performance data of athletes at the Olympics have been
used to tune the parameters of complicated models aimed at the determination of
physiological limits in sport performances Sjodin1985 ; Peronnet1989 ; DiPrampero2003 .
For example, according to a mathematical model for
human running performance that accounts for
various energetic factors, such as
capacity of anaerobic metabolism, maximal aerobic power
and reduction in peak aerobic power, Perronet and
Thibault predicted the limiting times that athletes can reach
in various running events in athletics Peronnet1989 .
In spite of the numerous efforts however,
we still miss a general description
for the performances of athletes. We still
miss a universal way to predict limiting performance values
and calculate the probability of future achievements in sport.
In this paper, we address all these issues by generating
a simple and coherent picture for the description of the performances
obtained by Olympic medal winners in
all specialties of athletics and swimming.
We analyze historic performance
data and provide empirical evidence about the discovery of a
novel statistical law governing performances of medal winners
at the Olympic Games.
With a self-consistent approach we simultaneously
(i) show that performance improvements
obey a universal law,
(ii) estimate limiting performance values,
(iii) predict future achievements at the Olympics.
Results
While former statistical studies have mainly analyzed the progression of absolute performance values along the various editions of the Games, here we change point of view and focus our attention on relative improvements in performances between two consecutive editions of the Olympics. Let us indicate with the value of the performance obtained by the gold medalist in a specific specialty at the edition of year of the Olympic Games. Depending on the specialty, may indicate time (running and swimming), length (long and triple jumps), height (high jump and pole vault), or distance (discus and hammer throws, shot put). We define the relative improvement of the gold-medal performance in the Games of year with respect to the gold-medal performance in the previous edition of the Olympics as
| (1) |
where
represents the gap between the performance
value of the gold medalist in year and the asymptotic
performance value .
The asymptotic or limiting performance value
is a unknown parameter representing
the physiological limit that can be achieved in the specialty
by an athlete.
Eq. 1 defines the relative improvement
towards the asymptotic performance value of the gold
medalist in year with respect to the performance
of the gold medalist in year .
Note that the same definition can be
used for the measurement of the relative improvements
of silver and bronze medalists, and in principle for athletes who have
reached any arbitrary rank position.
For reasonable values of , we find that the distribution
of the relative performance improvements
is statistically consistent with a normal distribution. We determine the best
estimate of the asymptotic performance value
as the value of
for which the statistical significance (-value) of
the normal fit is maximized (see Materials and Methods section). The procedure is
generally accurate and allows
us to identify reasonable values of
in all specialties considered in this
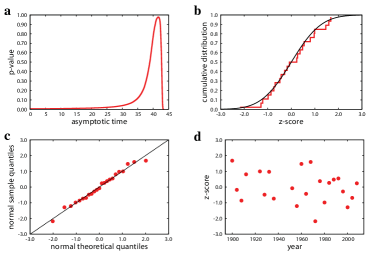
study. In Fig. 1 for example,
we report the results obtained by analyzing performance data
of male athletes in meters sprint. The best
estimate of the asymptotic time is seconds.
For this value of , we find that relative
improvements obey a normal distribution with
average value and standard deviation
.
Statistical significance, however, can be used not only for the determination
of the best estimate of the asymptotic performance value, but also, in a broader sense,
to define confidence intervals for .
In the case of meters sprint
of male athletes for example, we find that, at
significance level, is in the range to seconds.
At significance level, the
interval is restricted and is
in the range to seconds,
while, at significance level, is expected
to be between and seconds.
The results shown in Fig. 1 are obtained by analyzing the relative
performance improvements of gold-medal winners. Similar
results are, however, obtained when considering the performances
of silver and bronze medal medalists (Fig. S1).
Interestingly, the finiteness of the data
does not affect the reliability of the
best estimate of the limiting
performance value since compatible values of
can be detected by removing results of the latest editions of the Games from the analysis
(Fig. S2).
The normality of the relative improvements
towards the asymptotic performance value is a
simple and strong result.
At each new edition
of the Games, gold-medal performances get, on average, closer to
the limiting performance value.
The average positive improvement observed in historic
performance data can be motivated
by several factors: as time goes on, athletes are becoming more professionals,
better trained, and during the season have more events to participate in;
the pool for the selection of athletes grows with time, and,
consequently there is a higher level of competition;
the evolution of technical materials favors better performances.
On the other hand, there is also a non null
probability that winning performances
become worse than those obtained in the previous edition of the Games
(i.e., relative improvement values are negative).
All these possibilities are described by a
Gaussian distribution that accounts for
various, in principle hardly quantifiable, factors that may influence
athlete performances: meteorological
and geographical conditions,
athletic skills and physical condition of the
participants, etc.
The accuracy of the
normal fit is not only testified by
its high statistical significance, but also
by graphical comparisons between the sample distribution
and the theoretical normal distribution
(see Figs. 1b and c). It is also important to note
that the values of the relative improvements
do not depend on the particular edition
of the Games, and thus their distribution is stationary (Fig. 1d).
The strength of our results, however, is not only in the
significance of the fits, but especially in its generality.
We repeated the same type of analysis for a
total of different specialties, and
found that performance improvements are governed by a
universal law.
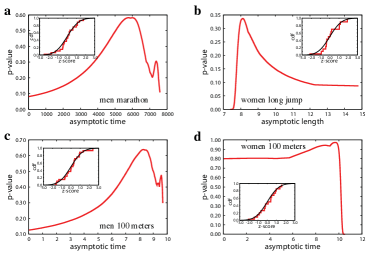
First of all, the law holds for all running events in athletics.
This is valid for an heterogeneous set of running
distances ranging from to meters
(marathon, Fig. 2 and Supporting Information S1). Second,
our analysis suggests that relative improvements
are normally distributed not only
when considering time performances, but also
performances regarding length or height (jumps) and
distance (throws).
In Fig.2b for example, we report the outcome
of our method when applied to
performance data of female gold medalists
in long jump. Other examples can be found in Supporting Information S2.
Finally, the law is valid for performance improvements of athletes in
swimming specialties (Supporting Information S3).
Given the
attention received in the recent
past Atkinson2004 ; Sharp2004 ; Rice2004 ,
we reserve a special consideration to the comparison
in performances between female
and male athletes in meters sprint.
In Fig. 2c and 2d, we report
the results obtained through the analysis of
Olympic performances in this specialty. According to our
analysis, the best estimate of the limiting time for males
is seconds, while for females
we identify the best estimate for the asymptotic time
at seconds. Our statistical analysis
predicts that women will be always slower
than men and that the gap will saturate at about ,
consistent with the estimation by Sparling et al Sparling1998 but
in disagreement with what predicted by
the unrealistic model of Atkinson et al Atkinson2004 .
It should be noted that
for women the statistical significance is
less predictive than the one measured for men. While
for men we observe that statistical significance is
clearly peaked around and goes rapidly to zero
as decreases, the same does not
happen in the case of women. We believe that the statistics are less
accurate because the analysis
is based on editions instead of
since women started to run the meters sprint
only in Amsterdam , while men already in Athens .
In particular, the lack of
sufficient data provides high statistical significance also
for the unrealistic seconds.
We expect, however, that the future addition of more data point
will suppress this effect. Despite these
problems, our analysis still produces meaningful
estimates of the upper bound of the asymptotic time:
at significance level, the asymptotic value
is expected to be lower than seconds, while
at significance level, should
be lower than seconds.
Also, our best estimates of the limiting
performance values are probably
not as accurate for this specialty
(or other short distances)
because there is not enough reliable performance
data regarding the first editions of the Games (automatic time
was introduced in Mexico City ).
The removal
of data points for male meters sprint before Amsterdam
(and in general of a few data points from the entire time serie)
leads also to the impossibility to
determine the best estimate of the asymptotic time
as a global maximum of statistical significance (see Fig. S3).
For meters sprint, we have performed therefore
an additional analysis in which we aggregated
together the results of gold, silver and bronze medalists
and obtained slightly different estimates for the limiting performance
values [ seconds for men (Fig. S4)
and seconds for women (Fig. S5-S6)].
| sport | gender | specialty | -value | ||||||
|---|---|---|---|---|---|---|---|---|---|
| Track & Field | Men | 100m | 8.28 | 0.04 | 0.10 | 0.64 | 26 | 0.35 | 9.63 0.13 |
| 110m hurdles | 11.76 | 0.05 | 0.12 | 0.48 | 26 | 0.50 | 12.87 0.14 | ||
| 400m | 41.62 | 0.06 | 0.19 | 0.98 | 26 | 0.14 | 43.62 0.41 | ||
| 10,000m | 1,539 | 0.05 | 0.19 | 0.45 | 22 | 0.01 | 1,617 15 | ||
| marathon | 5,771 | 0.03 | 0.15 | 0.58 | 26 | 0.34 | 7,537 273 | ||
| pole vault | 6.87 | 0.05 | 0.08 | 0.91 | 26 | 0.03 | 6.00 0.07 | ||
| hammer throw | 103.81 | 0.04 | 0.09 | 0.47 | 25 | 0.03 | 82.89 1.96 | ||
| Women | 100m | 9.72 | 0.05 | 0.19 | 0.97 | 19 | 0.12 | 10.73 0.20 | |
| 400m | 45.14 | 0.02 | 0.15 | 0.77 | 12 | 0.00 | 49.53 0.67 | ||
| long jump | 8.12 | 0.04 | 0.18 | 0.34 | 16 | 0.01 | 7.08 0.19 | ||
| Swimming | Men | 100m fs | 44.84 | 0.09 | 0.10 | 0.92 | 23 | 0.36 | 47.00 0.24 |
| 100m bs | 48.98 | 0.09 | 0.11 | 0.93 | 22 | 0.24 | 52.22 0.39 | ||
| 100m brs | 57.38 | 0.16 | 0.16 | 0.93 | 11 | 0.36 | 58.67 0.24 | ||
| 1,500m fs | 577 | 0.05 | 0.05 | 0.50 | 23 | 0.71 | 866 15 | ||
| Women | 100m fs | 51.87 | 0.12 | 0.19 | 0.54 | 22 | 0.00 | 52.97 0.24 | |
| 100m bs | 54.73 | 0.08 | 0.14 | 0.59 | 20 | 0.20 | 58.62 0.59 | ||
| 100m brs | 62.08 | 0.13 | 0.10 | 0.86 | 11 | 0.15 | 64.77 0.31 | ||
| 800m fs | 388 | 0.05 | 0.07 | 0.84 | 11 | 0.76 | 489 7 |
In general, our approach produces good results
for specialties with a sufficiently long
tradition in the Games. This is basically the case of all male specialties
in athletics. Data about female performances
typically provide less accurate results, but still, in the majority
of the cases, the predictions of the asymptotic performance values
are reasonable.
We summarize in Table 1 the results obtained
for some specialties, while
we refer to the Supplementary Information
for a systematic
analysis of all of them.
It should be noted that there are also
a few cases in which things do not work perfectly.
In women 800 meters, for example, statistical significance
does not exhibit any peak value (Supporting Information S1).
There are also a few specialties
in which the best estimate
of the limiting performance value does not correspond
to the global maximum of statistical significance
(Supporting Information S1).
In these cases, statistical significance
is a non monotonic function of the and
more maxima are present. Still the peak value
that appears more plausible can be used as an estimate
of .
Finally, there are three specialties in athletics in which a clear peak
in statistical significance
is visible only by excluding performance data
of Sidney , but this exclusion is fully justified
by the fact that the top
athletes of the moment did not take part in
the competition (Supporting Information S1).
For example, about the men 200 meters sprint
of Sidney , the web site sports-reference.com
reports: “This race was expected to be between the
Americans Maurice Greene and Michael Johnson.
Greene was the best in the world at meters and
Johnson at meters, and their race in the middle
distance was highly anticipated. But neither qualified
for the team at the Olympic Trials, succumbing to minor
injuries, although they both made the team in their better events.”
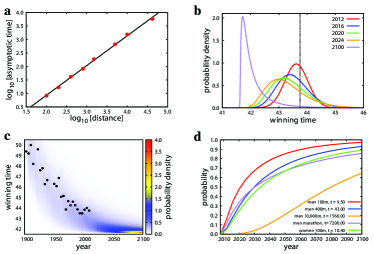
The good accuracy of our best estimates
of the limiting performance values is supported also
by the power-law relation between these quantities
and the length of the
running events in athletics (see Fig. 3a).
As already observed by Katz and Katz,
world record times () and running distances () are related
by the power-law relation Katz1999 .
Katz and Katz studied the relation between world
record performances and running distances in various epochs, and found
that the power-law exponent value is
always slightly larger than
but decreases for more recent epochs. For example, they measured
in , and in .
On the basis of our measurements,
we claim that the asymptotic value
of the exponent will be exactly , when
limiting performance values,
and thus definitive world records, will be reached in all specialties
of athletics.
A final application of
our findings is the prediction of
future performances at the Olympics.
The performance value of the gold medalist
in London 2012, for example, can be estimated as
, where
is a random variate extracted from the normal distribution
with
mean value and standard
deviation . Similar equations can be written
also to predict performance values of the other editions
after London .
For each future edition of the Games,
we can draw a distribution of performance values (see Fig. 3b).
The distribution
is normal for the edition of , but diverges from normality
as time grows. In particular,
while the expected performance value decreases exponentially towards
the asymptotic performance value as time increases,
the standard deviation initially grows
as we move further in future until predictions become again more accurate
because of the boundary effect of
(see Fig. 3c).
By simply looking at the
performances expected at the next edition
of the Games in London , we can ask what
is the probability
that the winner of the gold-medal
will beat the actual world record of her/his
specialty. In Table 1,
we list these probabilities for some specialties together with
the most likely performance values
that gold-medal winners will obtain. In athletics,
there are not negligible chances (about )
that the actual world records of meters, meters hurdles
and marathon will be lowered by men.
In swimming specialties, the expectations are more
promising: there is a good probability (higher than )
that the world record of
1,500 meters freestyle will be beaten by male athletes.
Relevant limits are unlikely to be broken
at the next Olympics (Fig. 3d). We will have to wait until
in order to have a
chance that a man will run the meters in less than seconds.
For other specialties, expectations (probability
higher than )
are even less promising:
men will run the meters in less than seconds
and the marathon in less than two hours ( seconds) only
after , women will run the meters sprint
in less than seconds only after ,
and finally the wall of minutes ( seconds) in
meters will likely be breached by male athletes only after year
.
Discussion
In conclusion, our paper
shows that the performance of
Olympic medal winners in athletics and swimming
obey, independently
of the type of specialty, a simple universal law.
If performance improvements are calculated
with respect to an asymptotic performance value,
then the relative difference between improvements
obtained in two different editions of the Games
is a random variate following a normal
distribution. This is the common property of a broad class of natural phenomena
that be
described by the theory of biased random walks Redner2001 , such as
the locomotory movements of organisms
responding to an external stimulus Alt1980 ; Hill1997 ; Codling2008 ,
the activity of spiking neurons gerstein1964 , the trends of
daily temperatures Wergen2010 , stock
prices Wergen2011 , capital markets Peters1989 , etc.
The normality of the relative improvements cannot be explained in trivial
terms, especially in this case where the statistics is performed
on extremal properties of the system. Remember
in fact that the performance values
analyzed here are those obtained by the best athletes
of a given edition of the Olympics (i.e., potentially
the best performers on the earth), and thus it is natural to expect
that absolute performance values obey
statistical laws of extremes Beirlant2004 .
More importantly, since the distribution is normal, it makes sense to refer
to average trajectories of top performance values along
editions of the Games. Our findings in fact allow to say
that, on average, the absolute performance
value of top athletes at the Olympics gets closer
to the limiting performance value in an exponential fashion,
with a rate of about in athletics and
in swimming. More in detail, the
average trajectory of the performance value
can be described by the equation
| (2) |
where is an arbitrary
initial edition year of the Olympics and is the
performance value measured in year . Eq.2 can be derived
directly from Eq.1 and the fact that relative improvements are normally distributed but
only under the assumptions that the edition year of the Olympics is
considered as a continuous variable
and that . Note that this
observation is important for stressing
the difference between our fitting procedure and a more straightforward analysis based on the
exponential fit of absolute performance values, as the one used to find
that the progression
of world record performances
follows a piecewise exponential decaying pattern Berthelot2008 ; Desgorces2008 ; Guillaume2009 .
Note also that the analysis of
the only Olympic performances differs from the
one of world record performances for the following reasons: (i) The relative
change between two world records, if defined
in a similar manner as Eq.1, can be only a
positive quantity;
(ii) The time difference between two world record performances
is not a constant, but a random variate by itself. Because the number
of events in which new world records can be established
is higher today than it was one century ago
(and they had been growing in the course of the years), in
any analysis of the progression of
world record performances time should be rescaled
to account for that Berthelot2008 .
The asymptotic performance value
is an a priori unknown variable whose
value can be self-consistently determined by
maximizing the statistical significance
of the normality fit.
It is particularly important to stress that our
simple methodology
provides good estimates of performance limits that are
in general consistent with those obtained
through complicated physiological
models Sjodin1985 ; Peronnet1989 ; DiPrampero2003 .
For example,
Perronet and Thibault predicted that the limiting time for men
in marathon is hour, minutes and seconds Peronnet1989 .
With our minimalistic model, we are able
to predict that this limiting time is
between hour, minutes and seconds
and hour, minutes and seconds (for men marathon
the peak of statistical significance is wide, see Fig. 2a).
At the same time, it is also important to stress
that our minimalistic analysis can also lead
to little inconsistencies. For example, the best estimates
of obtained here state
that, asymptotically, the average pace in marathon would
be higher than the one
in meters. This means that according
to our estimates, the first
meters in marathon would be run in
less than minutes,
while the entire race of meters
would be run asymptotically in more than minutes.
This inconsistency can be partially explained by the fact that
the statistics for meters is
less reliable because based only on
events, while the one for marathon on the results of
editions of the Games. In general, it is very important
to remark that, at the moment, we are
able to provide only good estimates of the asymptotic
performance values because such estimates are based
on a relatively small set of empirical data (at best
editions of the Olympics), and therefore must
be taken with a grain of salt.
We expect in fact that, while the
normal law governing performance improvements will
likely continue to hold,
the accuracy in the
estimation of the asymptotic performance
values will improve with the addition of more data points in the future,
starting already from the next edition of the Games in London .
Materials and Methods
Data set
Medal lists and
results of all editions of the
Olympic Games have been collected from
the web sites www.sports-reference.com
and www.databaseolympics.com. Whenever possible,
we considered automatic measures of time instead of
manual ones.
We included in our study all results obtained in the editions
of the modern Olympic Games since Athens 1896, but
we excluded from the analysis data about the so-called
“Intercalated” edition of the Games held
in Athens in . We focused on
sports classified as “Track & Field” and “Swimming”,
and particularly
on specialties of these sports that have
been performed at least in the latest
ten editions of the Olympic Games.
We compared only performances between subsequent editions
of the games held at four years of difference. We excluded
therefore comparisons between either the consecutive editions of
Stockholm and Antwerp (separated
by World War I), and those of Berlin and London
(separated by World War II).
For consistency, we considered only specialties
whose rules or techniques have not changed during time.
For example, we excluded javelin throw because of the javelin
redesign in . We also excluded performances in high jump
before Mexico City when athletes started for the first
time to adopt the modern jump style called “Fosbury flop”.
Data are made available for download at
filrad.homelinux.org/resources.
Normality test
The results reported in the paper are based
on the normality test introduced by Anderson and Darling Anderson1952 .
Given a value of , we compute the best estimates of
the mean and the standard deviation as
and , respectively.
The relative improvement is defined in Eq.1. indicates the number of
results between consecutive editions of the Olympic Games
that are included in the analysis.
We then compute the -scores as
and rearrange them in
ascending order such that .
The Anderson-Darling distance is computed with the
formula
,
where is the standard normal cumulative
distribution function.
We further use the modified statistics
, suitable
in the case in which both the mean and standard deviation are
estimated from the data as
suggested by Stephens Stephens1974 .
We evaluate the goodness of the fit
by generating random number sequences of length extracted
from the standard normal distribution.
The statistical significance of the normality
test (-value) is calculated as the
number of artificial sequences whose is larger than
the one measured for real data divided
by the total number of generated sequences. Note that
there is a trivial monotonic relation between the -value
and the Anderson-Darling distance , and therefore
the maximum of the -value corresponds to the
minimum of .
We used the normality test by Anderson and Darling
because this test is considered one of the best empirical distribution
function statistics for detecting most departures from
normality, and can be used
for testing the normality of very small sample sizes Stephens1974 .
We verified, however, the robustness
of our results by using
other standard normality tests, including
those based on the criteria of Kolmogorov-Smirnov, Cramér-von Mises
and Shapiro-Wilk Shapiro1965 ; D'Agostino1986 .
We also verified the consistency of our results with
normality tests based on the moments of the distributions (see Fig. S6).
Furthermore, we tested the accuracy of our fitting
method by implementing a bootstrap procedure Efron1993 , and found
that our fitting method
is able to well recover the correct parameter values in artificial sequences
generated according to our model (see Fig. S7).
Acknowledgments
We thank C. Castellano, P.S. Dodds, E. Ferrara and A. Hockenberry for comments and suggestions on the manuscript.
References
- (1) Swaddling J (2000) The ancient Olympic games. Austin, TX: University of Texas Press.
- (2) Guttmann A (2002) The Olympics: A History of the Modern Games. Champaign, IL: University of Illiniois Press, 100–102 pp.
- (3) Knight RB (1992) This Great Symbol. Olympic Review 301: 627–631.
- (4) Mandell RD (1971) The Nazi Olympics. Champaign, IL: University of Illiniois Press.
- (5) Reeve S (2000) One day in September: the full story of the 1972 Munich Olympics massacre and the Israeli revenge operation ”Wrath of God”. New York, NY: Arcade Publishing, Inc.
- (6) Guttmann A (1988) The Cold War and the Olympics. International Journal 43: 554–568.
- (7) Waitt G (2003) Social impacts of the Sydney Olympics. Ann Tourism Res 30: 194–215.
- (8) Preuss H (2004) The economics of staging the Olympics: a comparison of the games, 1972-2008. Northampton, MA: Edward Eldgar Publishing, Inc.
- (9) Ben-Naim E, Vazquez F, Redner S (2005) What is the most competitive sport? J Korean Phys Soc 50: 124.
- (10) Yaari G, Eisenmann S (2011) The Hot (Invisible?) Hand: Can Time Sequence Patterns of Success/Failure in Sports Be Modeled as Repeated Random Independent Trials? PLoS ONE 6: e24532.
- (11) Sire C, Redner S (2008) Undestanding Baseball Team Standings and Streaks. Eur Phys J B 67: 5.
- (12) Petersen A, Jung WS, Stanley HE (2008) On the distribution of career longevity and the evolution of home run prowess in professional baseball. EPL 83: 50010.
- (13) Saavedra S, Powers S, McCotter T, Porter MA, Mucha PJ (2009) Mutually-Antagonistic Interactions in Baseball Networks. Physica A 389: 1131–1141.
- (14) Petersen AM, Penner O, Stanley HE (2011) Detrending career statistics in professional baseball: Accounting for the steroids era and beyond. Eur Phys J B 79: 67–78.
- (15) Petersen AM, Jung WS, Yang JS, Stanley HE (2011) Quantitative and empirical demonstration of the Matthew effect in a study of career longevity. Proc Natl Acad Sci USA 108: 18–23.
- (16) Duch J, Waitzman JS, Amaral LAN (2010) Quantifying the Performance of Individual Players in a Team Activity. PLoS ONE 5: e10937.
- (17) Radicchi F (2011) Who Is the Best Player Ever? A Complex Network Analysis of the History of Professional Tennis. PLoS ONE 6: e17249.
- (18) Tibshirani R (1997) Who Is the Fastest Man in the World? Amer Statistician 51: 106–111.
- (19) Grubb HJ (1998) Models for Comparing Athletic Performances. J Roy Statistical Society D 47: 509–521.
- (20) Sparling PB, O’Donnell EM, Snow TK (1998) The gender difference in distance running performance has plateaued: an analysis of world rankings from 1980 to 1996. Med Sci Sport Exer 30: 1725–1729.
- (21) Katz JS, Katz L (1999) Power laws and athletic performance. J Sport Sci 17: 467–476.
- (22) Savaglio S, Carbone V (2000) Scaling in athletic world records. Nature 404: 244.
- (23) Holden C (2004) An everlasting gender gap? Science 305: 639–640.
- (24) Atkinson M, Hay SI, Stephens P, Hunter C, Bignell G (2004) Momentous sprint at the 2156 Olympics ? Nature 431: 525–526.
- (25) Nevill AM, Whyte G (2005) Are there limits to running world records? Med Sci Sport Exer 37: 1785–1788.
- (26) Nevill AM, Whyte GP, Holder RL, Peyrebrune M (2007) Are there limits to swimming world records? Int J Sports Med 28: 1012–1017.
- (27) Denny MW (2008) Limits to running speed in dogs, horses and humans. J Exp Biol 211: 3836–3849.
- (28) Sabhapandit S, Majumdar SN, Redner S (2008) Crowding at the front of marathon packs. J Stat Mech-Theory E 2008: L03001.
- (29) Sharp NCC (2004) Mind the gap: women racers are falling behind. Nature 432: 147.
- (30) Rice K (2004) Sprint research runs into a credibility gap. Nature 432: 147.
- (31) Sjödin B, Svedenhag J (1985) Applied physiology of marathon running. Sports Med 2: 83–99.
- (32) Péronnet F, Thibault G (1989) Mathematical analysis of running performance and world running records. J Appl Physiol 67: 453–465.
- (33) Di Prampero PE (2003) Factors limiting maximal performance in humans. Eur J Appl Physiol 90: 420–429.
- (34) Redner S (2001) A Guide to First-passage Processes. Cambridge, UK: Cambridge University Press.
- (35) Alt W (1980) Biased random walk models for chemotaxis and related diffusion approximations. J Math Biol 9: 147–177.
- (36) Hill NA, Hader DP (1997) A biased random walk model for the trajectories of swimming micro-organisms. J Theor Biol 186: 503–26.
- (37) Codling EA, Plank MJ, Benhamou S (2008) Random walk models in biology. J R Soc Interface 5: 813–834.
- (38) Gerstein GL, Mandelbrot B (1964) Random Walk Models for the Spike Activity of a Single Neuron. Biophys J 4: 41–68.
- (39) Wergen G, Krug J (2010) Record-breaking temperatures reveal a warming climate. EPL 92: 30008.
- (40) Wergen G, Bogner M, Krug J (2011) Record statistics for biased random walks, with an application to financial data. Phys Rev E 83: 051109.
- (41) Peters EE (1989) Fractal Structure in the Capital Markets. Financial Analysts Journal 45: 32–37.
- (42) Beirlant J, Goegebeur Y, Teugels J (2004) Statistics of Extremes: Theory and Applications. New York, NY: John Wiley & Sons, Ltd.
- (43) Berthelot G, Thibault V, Tafflet M, Escolano S, El Helou N, et al. (2008) The citius end: world records progression announces the completion of a brief ultra-physiological quest. PloS ONE 3: e1552.
- (44) Desgorces FD, Berthelot G, El Helou N, Thibault V, Guillaume M, et al. (2008) From Oxford to Hawaii ecophysiological barriers limit human progression in ten sport monuments. PloS ONE 3: e3653.
- (45) Guillaume M, Helou NE, Nassif H, Berthelot G, Len S, et al. (2009) Success in developing regions: world records evolution through a geopolitical prism. PloS ONE 4: e7573.
- (46) Anderson TW, Darling DA (1952) Asymptotic theory of certain goodness-of-fit criteria based on stochastic processes. Ann Math Stat 23: 193–212.
- (47) Stephens MA (1974) EDF Statistics for Goodness of Fit and Some Comparisons. J Am Statistic Assoc 69: 730–737.
- (48) Shapiro SS, Wilk MB (1965) An analysis of variance test for normality (complete samples). Biometrika 52: 591–611.
- (49) D’Agostino RB (1986) Tests for the normal distribution. In: D’Agostino RB, Stephens MA, editors, Goodness Of Fit Techniques, Dekker, volume 68, chapter 9. pp. 367–419.
- (50) Efron B, Tibshirani RJ (1993) An Introduction to the Bootstrap. New York, NY: Chapman & Hall.
- (51) Wilk MB, Gnanadesikan R (1968) Probability plotting methods for the analysis of data. Biometrika 55: 1–17.