Heavy Element Nucleosynthesis in the Brightest Galactic Asymptotic Giant Branch stars
Abstract
We present updated calculations of stellar evolutionary sequences and detailed nucleosynthesis predictions for the brightest asymptotic giant branch (AGB) stars in the Galaxy with masses between 5 to 9, with an initial metallicity of ([Fe/H] = 0.14). In our previous studies we used the Vassiliadis & Wood (1993) mass-loss rate, which stays low until the pulsation period reaches 500 days after which point a superwind begins. Vassiliadis & Wood (1993) noted that for stars over 2.5 the superwind should be delayed until days at 5. We calculate evolutionary sequences where we delay the onset of the superwind to pulsation periods of days in models of , 6, and 7. Post-processing nucleosynthesis calculations show that the 6 and 7 models produce the most Rb, with [Rb/Fe] dex, close to the average of most of the Galactic Rb-rich stars ([Rb/Fe] dex). Changing the rate of the e reactions results in variations of [Rb/Fe] as large as 0.5 dex in models with a delayed superwind. The largest enrichment in heavy elements is found for models that adopt the NACRE rate of the e(,n)g reaction. Using this rate allows us to best match the composition of most of the Rb-rich stars. A synthetic evolution algorithm is then used to remove the remaining envelope resulting in final [Rb/Fe] of dex although with C/O ratios . We conclude that delaying the superwind may account for the large Rb overabundances observed in the brightest metal-rich AGB stars.
1 Introduction
García-Hernández et al. (2006) and García-Hernández et al. (2009) identified several Galactic and Magellanic Cloud intermediate-mass asymptotic giant branch (AGB) stars within a sample of OH/IR stars (i.e., bright O-rich giants with large infrared excesses). The large enhancements of the neutron-capture element rubidium (Rb) found by these authors, combined with the fact that these stars are O-rich, support the prediction that hot bottom burning (HBB) and an efficient third dredge-up (TDU) have occurred in these stars (García-Hernández et al., 2007). The Rb is hypothesized to be produced by the neutron-capture process (the process) in intermediate-mass AGB stars, that in this context have masses over . An enrichment in the element Rb over the elements Sr, Y, and Zr is a tantalizing piece of evidence for the efficient operation of the e(,n)g neutron source in intermediate-mass AGB stars (Truran & Iben, 1977; Cosner et al., 1980). This is because the production of Rb is sensitive to the high neutron density associated with this neutron source (Lambert et al., 1995; Abia et al., 2001; van Raai et al., 2012). These observational results are particularly important because there is a paucity of observational evidence for constraining stellar models of intermediate-mass AGB stars, and especially the efficiency of the TDU and HBB. These two last points are much debated in the context of the globular cluster abundance anomalies (Karakas et al., 2002; Stancliffe et al., 2004; Herwig, 2004; Ventura & D’Antona, 2005a; Karakas et al., 2006a). Intermediate-mass AGB stars play an important role in chemical evolution of galaxies and stellar systems by producing substantial nitrogen (e.g., Romano et al., 2010; Kobayashi et al., 2011). These stars may also prove to be important for the chemical evolution of a select number of neutron-capture elements such as Rb (Travaglio et al., 2004).
Briefly, during the thermally-pulsing AGB phase the He-burning shell becomes thermally unstable every years for stars with H-exhausted core masses over (see Herwig, 2005, for a review). The energy provided by the thermal pulse (TP) expands the whole star, pushing the H shell out to cooler regions where it is almost extinguished, and subsequently allowing the convective envelope to move inwards (in mass) to regions previously mixed by the TP driven convective zone. This inward movement of the convective envelope is known as the third dredge-up (TDU), and is responsible for enriching the surface in and other products of He-burning, as well as heavy elements produced by the process (e.g., Busso et al., 1999). In intermediate-mass AGB stars with initial masses , the base of the convective envelope can dip into the top of the H-burning shell, causing proton-capture nucleosynthesis to occur there (see Lattanzio et al., 1996, for a review). HBB nucleosynthesis converts the newly created into and can prevent the formation of a C-rich atmosphere where C/O .
van Raai et al. (2012) performed a detailed study on the production of Rb in stellar models of intermediate-mass AGB stars covering a range in compositions from solar metallicity down to the metallicity of the Small Magellanic Cloud ( or [Fe/H]111We adopt the standard spectroscopic notation [X/Y] = (X/Y)(X/Y)⊙ where X and Y are abundances by number. = ). While the qualitative features of the observations could be reproduced (increasing [Rb/Fe] ratio with increasing stellar mass or decreasing metallicity) the models could not reproduce the stars with the highest Rb abundances, which have [Rb/Fe] 2.0. A few possible solutions were suggested including extending the calculations to include models of mass higher than 6. Another solution was to consider variations of the mass-loss rate used on the AGB phase, which is known to be highly uncertain (e.g., Groenewegen et al., 2009).
The objective of our work is to explore two of the possible solutions to the models not producing enough Rb: 1) we extend our calculations to include models of up to 9, and 2) we vary the AGB mass-loss rate in order to increase the number of TPs and TDU mixing episodes. For the purposes of the present study we concentrate on models of (which in this context are slightly super-solar metallicity, see §2). We expect that any of the proposed solutions, should they work, would apply equally well to stellar evolution models with metallicities appropriate for stars in the Large and Small Magellanic Clouds (hereafter LMC and SMC). This is because lower metallicity AGB stars already take many more TPs to reach the superwind phase owing to their smaller radii and smaller pulsation periods than solar metallicity AGB stars. We also examine the effect of variations in the nuclear network and variations in the e reactions, including adopting the latest rates for these reactions from Iliadis et al. (2010).
The outline of this paper is as follows. We begin with a description of the new stellar evolutionary sequences and in §3 we present the new stellar nucleosynthesis predictions. In §4 we present the results of the synthetic evolution to the tip of the AGB and we finish with a discussion of the new results obtained in §5. Final remarks are given in §6.
2 New Stellar Evolutionary Sequences
We calculate the stellar evolution and nucleosynthesis in two steps. First, we use the stellar evolution code described in Karakas & Lattanzio (2007, and references therein) to follow the evolution of the stellar structure and abundances important for stellar evolution (H, e, e, , , and ) from the zero-aged main sequence (ZAMS) to near the end of the AGB phase. Then we perform detailed post-processing nucleosynthesis calculations to obtain heavy-element yields from the stellar evolutionary sequences. In this study, we use the same stellar evolution code used in Karakas et al. (2010), which includes the carbon and nitrogen-rich low-temperature opacity tables from Lederer & Aringer (2009). The rate for the (p,) reaction has been updated to Bemmerer et al. (2006), while the rate for the triple- reaction has been updated to NACRE (Angulo et al., 1999). We use the mixing length (MLT) theory for convective regions and we set the mixing length parameter . The temperature gradient in the convective envelope is determined by the theory of convection used in the calculations. It can have a substantial effect on the structure of the convective envelope and influences surface properties such as the luminosity and effective temperature. It also greatly influences the efficiency of HBB, with the result that a shallower temperature gradient results in stronger burning and higher luminosities (see detailed discussion in Ventura & D’Antona, 2005a). In lower mass AGB stars, increasing can also increase the efficiency of the TDU (Boothroyd & Sackmann, 1988). In the intermediate-mass stars we are considering here, the TDU is already very efficient (, see below) so it is not clear that increasing will lead to a noticeable increase in the production of Rb. Regardless, we perform one calculation of a 6, model with .
For this study we concentrate on models with an initial composition of , where we set the solar metallicity to be , very close to the proto-solar nebula solar metallicity of 0.0142 given in Asplund et al. (2009). The masses considered for this study are and 9. For each of these masses we compute one evolutionary sequence using the standard Vassiliadis & Wood (1993) mass-loss prescription. For the and models we compute one evolutionary sequence using the modified Vassiliadis & Wood (1993) mass-loss prescription described below in §2.1. At this metallicity, we found that is the limit for producing a C-O core, and even at this mass we found one carbon flash during which a small fraction of the C-O core was burnt to neon (similar to the models in Doherty et al., 2010). The 9 model went through off-center carbon ignition and (almost) complete core carbon burning and entered the thermally-pulsing AGB with an O-Ne core. AGB stars with O-Ne cores are known as “super-AGB stars” and experience HBB with temperatures at the base of the envelope of K. There are considerable uncertainties surrounding the stellar modeling of super-AGB stars including the treatment of core carbon ignition and burning and the efficiency of the TDU (Siess, 2010; Doherty et al., 2010; Ventura & D’Antona, 2011). Here we simply use the 9 model as an illustrative example of the heavy-element nucleosynthesis in super-AGB stars in comparison to lower-mass AGB stars with C-O cores.
2.1 Mass loss in bright O-rich AGB stars
Dealing with the extent and temporal distribution of mass-loss in AGB stars is a major uncertainty in stellar modeling (Ventura & D’Antona, 2005b). In the existing stellar evolution code, the Reimers (1975) mass-loss prescription is used on the first giant branch with , and the Vassiliadis & Wood (1993) mass-loss prescription is used on the AGB. According to this prescription the mass-loss rate depends on the radial pulsation period and stays low ( year-1) until the period, , exceeds 500 days. After this time a luminosity driven superwind begins and the mass-loss rate increases to a few year-1 and removes the envelope quickly, in a few TPs.
Vassiliadis & Wood (1993) noted that there are optically bright long period variable stars with periods of days that are probably intermediate-mass stars of . In order to prevent their mass-loss prescription from removing these observed objects, Vassiliadis & Wood (1993) recommended a modification to delay the onset of the superwind in stars of masses greater than 2.5. This suggestion is supported by the optical observations of OH/IR stars, which show that the number of obscured (dust enshrouded) stars dramatically increases for periods longer than 700 days (see Table 12 in García-Hernández et al., 2007). This modification was not used in the AGB model calculations presented by Karakas (2010) and used in the van Raai et al. (2012) study.
Here we explore the effect of delaying the onset of the superwind phase on the AGB nucleosynthesis. To do this, we adopt the modification to the Vassiliadis & Wood (1993) mass-loss prescription. Specifically, we modify Equation 2 of Vassiliadis & Wood (1993) such that the superwind begins at a pulsation period of days, depending on the initial stellar mass. For comparison to observational data, the Vassiliadis & Wood (1993) mass-loss prescription gives pre-superwind mass-loss rates between to year-1, and superwind mass-loss rates between a few year-1 up to a maximum of year-1 in the most massive AGB model of 9. These peak values are about a factor of three to ten less than the maximum mass-loss rates measured in red supergiants, which have mass-loss rates up to year-1 (van Loon et al., 1999a; De Beck et al., 2010). De Beck et al. (2010) find a clear relation between the pulsation periods of the AGB stars and the derived mass-loss rates, and note that the mass-loss rates level of at year-1 for periods exceeding about 850 days. This suggests that delaying the onset of the superwind to days is a suitable although somewhat conservative choice.
Here in this study we concentrate on variations to the Vassiliadis & Wood (1993) mass-loss prescription. There are several justifications for using the empirical mass-loss prescription from Vassiliadis & Wood (1993) instead of other empirical or theoretical mass-loss prescriptions (e.g., Arndt et al., 1997; Blöcker, 1995; Wachter et al., 2002, 2008; van Loon et al., 2005). Importantly, the model stars we are considering are bright oxygen-rich AGB stars (i.e., C/O ) for most of their TP-AGB phase owing to efficient HBB. This means that the mass-loss rates of e.g., Arndt et al. (1997) and Wachter et al. (2002) which were derived for C-rich stars, are not appropriate for our model stars. In comparison, the sample used by Vassiliadis & Wood (1993) had Galactic and Magellanic Cloud C-rich and O-rich AGB stars and covered a large range of pulsation periods and luminosities.
Furthermore, the stellar effective temperatures of even the most massive AGB model stars we compute are . These effective temperatures are similar to the M-type AGB stars in the Hertzsprung-Russell diagram of van Loon et al. (2005, their Fig. 12). This means that M-type AGB mass-loss rates are more suitable for our model stars than red supergiant mass-loss rates, even though their predicted luminosities are near or just above the the classical AGB limit of . Using the derived mass-loss rate for M-type stars from van Loon et al. (2005, in particular, , , and ) and the typical stellar effective temperature for the 9 star (K) along with the maximum AGB luminosity of , we obtain a mass-loss rate of year-1. This is lower than the maximum mass-loss rate of year-1 found using Vassiliadis & Wood (1993) for the 9 AGB model. Groenewegen et al. (2009) compared the Vassiliadis & Wood (1993) and Reimer’s mass-loss prescriptions to a sample of AGB mass-loss rates and concluded that the Vassiliadis & Wood (1993) still provides the best description. They did find however that there are also some deficiencies, in particular to the maximum adopted mass-loss rates.
2.2 Model results
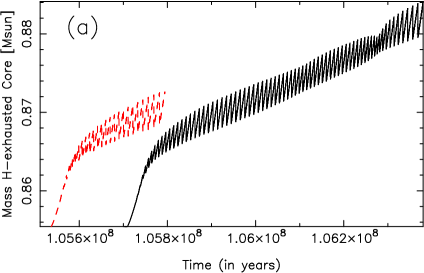
In Figs. 1 (a)–(c) we show the temporal evolution of (a) the H-exhausted core mass, the (b) temperature in the He-shell and (c) the temperature at the base of the convective envelope for the 5, models. The model with a delayed superwind is shown by the black solid lines and the model with the standard Vassiliadis & Wood (1993) mass loss is shown by the red dashed lines (shifted to the left by years for clarity). The most striking feature of these figures is the extra TPs in the model with a delayed superwind. This leads to 1) more TDU episodes and a final higher core mass, 2) more TPs where the maximum temperature in the He-intershell exceeds K and, 3) a longer duration for HBB and also a higher peak temperature, which leads to a greater degree of proton-capture nucleosynthesis. An examination of Table 1 shows that the features illustrated in Fig. 1 are present in all of the stellar models that delay the onset of the superwind. The drastic increase in the number of TPs leads to increases in the total amount of He-intershell matter mixed into the envelope by the TDU for 5, 6, and 7 models. Furthermore, the peak temperature in the He-shell increases with TP number and consequently the models with a delayed superwind experience more TPs with temperatures sufficient to activate the e neutron source, with important consequences for Rb production as well as other heavy elements (see below).
In Table 1 we show the results of the 6, model with and standard Vassiliadis & Wood (1993) mass loss. The strength of the TPs and the efficiency of the TDU episodes are almost the same as the model with . Furthermore, the amount of He-shell material dredged into the envelope over the AGB phase is almost identical to the model with . The most obvious difference is in the efficiency of HBB, which is more intense in the model with a higher . Given the similarities between the two models in terms of the amount of He-shell material and the strengths of TPs, we do not consider this model further in this study.
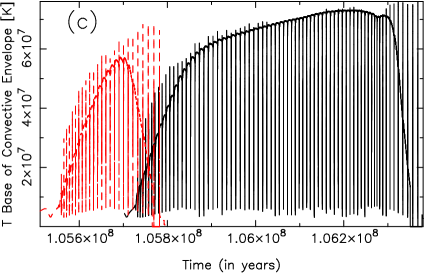
Both the 8 and 9 models enter the thermally-pulsing AGB with pulsation periods days (see Fig. 2 (a) for the 9 model). This means that by the first TP these stars are already experiencing the superwind and consequently the behavior of the temperature at the base of the convective envelope reaches a peak early on and steadily declines with time (see Fig. 2 (d) where the thick solid line represents the temperature during the short interpulse periods). The peak in temperature at the base of the envelope is reached in TPs or so. Similar behavior is noted for the evolution of the bolometric luminosity. For example, in Fig. 3 we show the core-mass luminosity relation for the 9 model, where the luminosity is observed to decrease monotonically with increasing core mass. It is also instructive to examine the behavior of the TDU in these intermediate-mass models. The TDU efficiency parameter is shown to reach a peak at 5 and then decrease with increasing stellar mass. This prediction combined with the decreasing He-intershell mass means that even though the 9 model experienced 163 TPs, the total amount of He-intershell material dredged into the envelope is roughly a factor of 2 lower than the 5 model with standard Vassiliadis & Wood (1993) mass loss. However, the 9 model reaches peak He-shell temperatures of K (Fig 2 (c)). This will have a strong impact on the -process nucleosynthesis, and in terms of the final yields, will help to balance out the lower amount of dredged-up material.
Siess (2010) presented the first stellar evolution and nucleosynthesis predictions for super-AGB stars to the end of the AGB phase. Our model compares reasonably well with that of Siess (2010) although the H-exhausted core mass of our model at the first TP is higher, at 1.17 compared to the same mass and metallicity model computed by Siess (at 1.06) and that his model experiences 119 TPs compared to our 163 TPs. This could be simply a consequence of our model being evolved to a lower final total mass of 3.2222Based on information from L. Siess’s website, http://www.astro.ulb.ac.be/ siess/WWWTools/SAGB the final mass of his model was ., at which point Fig. 2 (d) shows that HBB had ceased (the temperature at the base of the envelope is K). Furthermore, our model experiences more efficient HBB with a peak temperature of K compared to K in the Siess model, and higher temperatures during He-shell burning with a maximum of K compared to K in the Siess model. Finally, of consequence for the production of Rb and other heavy elements, the standard models of Siess (2010) show no TDU while our 9 model does (see Fig. 2 (b) which shows the evolution of the H-exhausted core). Siess (2010) calculates a series of synthetic post-processing models where he sets the TDU efficiency parameter at a constant . We will compare to this model in §3333Keeping in mind that Siess’s synthetic model does not take into account the feedback of the TDU on the evolutionary properties of the model star..
Before we move onto discussing the results of the post-processing nucleosynthesis results, we briefly mention a comparison of the new 5 and 6 models presented here with those presented in Karakas (2010) and used in the previous van Raai et al. (2012) study. The new stellar evolutionary sequences were computed with updated C and N-rich low-temperature opacity tables, which can have the effect of increasing the radius and therefore the mass-loss rate when the star becomes C and/or N-rich as a consequence of nucleosynthesis and mixing (Marigo, 2002). Furthermore, the newer models use the slower rate for the (p,) reaction from Bemmerer et al. (2006), which effects the rate of H-burning during the interpulse phase. For most of the masses considered here, efficient HBB prevents the formation of a C-rich atmosphere so the question of C enrichment should not be important, however all models become N-rich. At this metallicity, 5 is the mass at which HBB begins and Ventura & Marigo (2009) showed that the stellar yields of the lowest mass models that experience HBB crucially depend on the adopted molecular opacities (see also Ventura & Marigo, 2010). The new 5 model is similar to the previous model (similar number of TPs, peak HBB temperatures and luminosities) but dredged up % more He-intershell material as a consequence of the new model being evolved to a smaller envelope mass. The new 6 reveals a larger deviation in that it has 15% fewer TP (33TP compared to 38TP) and lower peak interpulse luminosities and HBB temperatures by roughly 20% and 10%, respectively. This is in spite of the higher mixing-length parameter of 1.86 in the new models compared to 1.75 previously (Ventura & D’Antona, 2005a, showed that higher leads to higher luminosities and temperatures). The lower temperatures and luminosities is likely caused by using the lower (p,) rate. Overall though, important for -process nucleosynthesis is the amount of material dredged to the stellar surface. Even though the new model experienced fewer TPs it was evolved to a lower envelope mass and dredged up 13% more He-shell material compared to the old model. In summary the newer models, while computed with improved input physics, show results that are reasonably consistent with the previous calculations.
3 Nucleosynthesis Results
The stellar evolutionary sequences described above are fed into a post-processing code in order to obtain nucleosynthesis predictions for elements heavier than iron. The details of this procedure have been described in detail elsewhere including Karakas et al. (2009) and Lugaro et al. (2012). Briefly, the nucleosynthesis code needs as input from the stellar evolution code variables such as temperature, density, and convective boundaries as a function of time and interior mass. The code then re-calculates the abundance changes as a function of mass and time using a nuclear network which contains species and time dependent diffusive mixing for all convective zones (Cannon, 1993). For this study we utilize three nuclear networks: 1) 166 species using the same rates used in the study of van Raai et al. (2012), 2) 172 species and based on the latest JINA REACLIB database (Cyburt et al., 2010), and 3) a 320 species network for a selection of models to examine predictions for hydrogen through to lead. The 166 and 172 species networks include elements from hydrogen to sulfur, and then from Fe to Nb (166) or Mo (172) and includes elements of the first -process peak at Rb, Sr, Y, and Zr.
The production of elements heavier than Fe in intermediate-mass AGB stars crucially depends on the rate of the e(,n)g reaction. In the 166 species network we use the Karakas et al. (2006b) rate used by van Raai et al. (2012), whereas in the 172 and 320 species network we use the NACRE (Angulo et al., 1999) rate. As a further test, we perform calculations using the 172 species network and use the latest rates of the e(,n)g and e()g reactions from Iliadis et al. (2010).
For the initial composition we took the solar distribution of abundances from Asplund et al. (2009) which sets the global solar metallicity to be which we round up to 0.015. We scale the solar abundances to a metallicity of which results in a slightly super-solar initial [Fe/H] of 0.14. Solar abundances of C, N, O, Ne, Mg, Si, S, Ar, and Fe are the pre-solar nebula values from Table 5 of Asplund et al. (2009); F is the meteoritic value of (F)⊙ = 4.42 from Table 1 of the same paper, chosen because it has a lower uncertainty. For the same reason we use the meteoritic values for the solar abundances for many elements heavier than Fe including Sr, Eu, and Pb.
In Figs. 4 and 5 we show the nucleosynthetic results for the elements lighter and heavier than Fe, respectively, from the 5 model with a delayed superwind and 320 species. For some of the heavier elements, the initial [X/Fe] (e.g., Sb and Te) because we do not include all of the stable isotopes in the network. For example for Te, a large fraction (roughly 65%) of the elemental component comes from isotopes produced by the rapid neutron capture process (i.e., e and e) and we do not include these isotopes in our 320 species network. Overall, the nucleosynthesis is as expected with significant N and Rb production as well as some surprises including some Sc production ([Sc/Fe] dex), along with Co and Cu production (at the level of 0.6 dex for Co and Cu; see also Smith & Lambert, 1987). Carbon shows a strong variation with a decrease down to [C/Fe] followed by an increase to by the tip of the AGB. Also from Fig. 5 we see no significant production of elements beyond the first -process peak. This is not the case as the metallicity is reduced: the -process predictions for the 6, model presented by Lugaro et al. (2012) and plotted in Fig. 6 shows instead significant Ba and Pb production (final [Ba/Fe] = 1.72 and [Pb/Fe] = 0.96). The low-metallicity 6 model also produces some Sc ([Sc/Fe] = 0.47) and Cu ([Cu/Fe] = 1.0) although little Co. Note that the 6, model predictions illustrated in Fig. 6 would be even more extreme if we were to use the NACRE rate for the e(,n)g reaction.
In Tables 2 and 3 we present a selection of elemental and isotopic abundance ratios at the tip of the AGB for the nucleosynthesis models computed for this study. In each case we list the mass, the pulsation period () at which the superwind begins, the network used for the calculation, the rate for the e(,n)g reaction, and then a selection of isotopic and elemental abundance ratios, where we adopt the standard spectroscopic notation, [X/Fe]. All isotopic and element ratios were computed using abundances by number. We find good agreement between models using the 172 and 320 species networks and the NACRE rate for the e neutron source. Table 2 shows that the production of elements beyond the first -process peak (Ba as an example) is negligible and hence our assumption of neglecting these species is valid for this study. Now we compare results from models computed using the 172 species network but different rates for the e rates (from NACRE and from Iliadis et al., 2010). Using the NACRE rate results in the highest levels of Rb and neutron-capture element production although there is only dex difference between calculations that use the NACRE rate compared to those that use the Iliadis et al. (2010) rate. The 166 species network used in the van Raai et al. (2012) study results in the lowest levels of neutron-capture nucleosynthesis. There are other differences between the two networks besides the rate of the e reactions. The 166 network includes older proton capture rates for the CNO cycle and the NeNa and MgAl chains, along with fits to the neutron-capture cross sections of Bao et al. (2000) whereas the updated 172 network includes JINA REACLIB fits to the KADoNiS database444Website: http://www.kadonis.org.
In terms of the nucleosynthesis of elements lighter than Fe, we find the effects of HBB are clearly evident in all models, including the 5 model with a standard Vassiliadis & Wood (1993) mass loss which becomes C-rich at the final TPs. All models show enhanced lithium, nitrogen and sodium, mild to moderate oxygen destruction, and small increases in magnesium and aluminum. The observations of García-Hernández et al. (2007) show that some stars enhanced in Rb have high Li and some have low Li (see discussion in van Raai et al., 2012). The final Li abundances of our models also show a large variation where (Li)555Defined by (Li) = (Li/H) and the abundances are by number. varies between 2.4 for the 5 model with a delayed superwind to for the 7 with a delayed superwind. The 8 and 9 models have final (Li) = 2.0 and 1.9, respectively.
In all cases the Mg isotopic ratios are also altered from their initial solar values, and most of all in the 9 model with the most extreme HBB. In this case the alteration of the Mg isotopes is mostly the result of proton-captures via the Mg-Al chains. For the lighter elements we find good agreement between all nuclear networks for C, N, and O. The [Na/Fe] ratio is shown to be significantly lower in the updated 172 and 320 species networks; this is a result of using the newer a p rates from Hale et al. (2004) whereas the 166 species network uses the NACRE rates (see discussion in Karakas, 2010). The elemental [Al/Fe] predictions are reasonably consistent between the different networks at a given mass, although the effect of using different e rates is evident in the predictions for the Mg isotopic ratios.
In Karakas (2010) we compared our nucleosynthesis results for AGB stars of to other groups. Given the consistency between the older models and those presented here we do not repeat that discussion. Siess (2010) provides yields – in terms of the mass (in ) of each element ejected by the stellar winds – for the super-AGB stars considered in his study. Here we compare the results from Siess’s synthetic 9, nucleosynthesis model with a constant and 342 TPs to our 9 model, which has and 163 TPs. For this comparison we use yields from the 172 species network. The hydrogen yield is essentially the same in our calculations, our e yield is only 3% lower (where the final Y ), our yield is about 60% lower although our yield of is 3% higher, indicating more processing by HBB. We also include a synthetic extension for this model (see §4) that results in an extra 60 TPs bringing the total to 223 TPs and increases in but no further increase in because HBB had ceased. Keeping in mind the qualitative nature of the yields presented by Siess (2010) and that our model experienced many fewer TPs, these differences are relatively small.
The study by van Raai et al. (2012) investigated the effect of including -rich regions (“pockets”) in the He intershell of intermediate-mass AGB stars. It is in the pocket that neutrons are produced via the alternative neutron source, (,n). van Raai et al. (2012) showed that including pockets increase the production of Rb by up to 0.4 dex. In this study we perform one test calculation where we include some extra mixing of protons into the He-intershell of the 5 model with a delayed superwind. We do this in the same manner as described by van Raai et al. (2012) and Kamath et al. (2012). We assume that protons are partially mixed into the intershell over a region of mass, , at the deepest extent of each TDU episode, where the number of protons decreases exponentially from the envelope composition, , to . In this test case we set for the 5 model, where is constant. In general, the mass of the He-intershell is about a factor of 10 larger than . The final surface [Rb/Fe] is 0.93 dex, an increase of about 0.2 dex on the model without a pocket. This is smaller than found by van Raai et al. (2012) at the same mass and metallicity, although we note that the 5, model used by van Raai et al. (2012) with Vassiliadis & Wood (1993) mass loss only produced a final [Rb/Fe] = 0.05 dex. These results are encouraging and suggest that the inclusion of a small pocket could lead to [Rb/Fe] ratios consistent with the average of the observed abundances, when considering models with a delayed superwind.
4 Synthetic evolution to the tip of the AGB
In all cases the stellar evolutionary sequences were not evolved until the envelope mass was removed and the model star had left the AGB. This is a result of convergence difficulties that arise once the envelope mass drops below some value ( depending on initial mass, see Table 1). In all cases convergence difficulties end the calculation after the cessation of HBB (e.g., see Figs.1 and 2). The distribution of white dwarf (WD) masses reveals the existence of massive WDs ( to 1.2) originating from single star evolution (Liebert et al., 2005; Ferrario et al., 2005). This suggests that whatever the cause of the convergence difficulties, real stars somehow lose their envelope at the tip of the AGB. The real uncertainty is whether or not the model stars should experience further TPs and TDU episodes near the tip of the AGB (Lau et al., 2012).
Assuming that TPs and TDU episodes will occur, it is possible to estimate the effect of these extra TPs on the surface compositions of our model stars. We do this in the same manner described by e.g., Karakas & Lattanzio (2007) and van Raai et al. (2012). Our method is simple by synthetic AGB evolution standards (Marigo, 2001; Izzard et al., 2004) although of a similar complexity to the synthetic extensions to the nucleosynthesis used by e.g., Forestini & Charbonnel (1997) for AGB stars, and Siess (2010) for super-AGB stars. For further details we refer to the discussion in Karakas & Lattanzio (2007). Our method assumes that all of the physical quantities of the star (e.g., luminosity, interpulse period, TDU efficiency etc) are assumed to remain constant at the tip of the AGB. The study by Karakas & Lattanzio (2007) showed that this is a reasonable assumption at the tip of the AGB in intermediate-mass stellar models. The main uncertainty of this method is the efficiency of the TDU, which we assume remains the same throughout our synthetic calculations. Theoretical models of intermediate-mass stars with deep TDU find that the efficiency does not vary significantly, even with decreasing envelope mass (Karakas, 2010). For a selection of stellar evolutionary sequences we estimate the number of remaining TPs; this is shown in Table 4. The stellar mass and pulsation period () at which the superwind begins are listed together with the amount of material lost at each interpulse period (), the Rb intershell mass fraction (X(Rb)intershell), and the final [Rb/Fe] ratio predicted by our synthetic calculations. In all cases we take intershell compositions from the 172 species network with the NACRE rate for the e reaction, as these should provide an upper limit to the final [Rb/Fe] ratio.
For the 9 model the synthetic algorithm estimated that there should be 60 TPs remaining and the final [Rb/Fe] = 0.90. For this model, the large number of synthetic TPs stretches our assumption of a constant luminosity, interpulse period, intershell composition, etc. (e.g., see Fig. 3 which shows the evolution of the luminosity with core mass). Varying the interpulse period and luminosity by reasonable amounts (% over 60 TPs) changes the final estimate for [Rb/Fe] by only dex. The largest change to the final [Rb/Fe] ratio is obtained by increasing the intershell composition of Rb. Over 60 TPs, the intershell composition of Rb increased by about a factor of two, as a result of TPs becoming hotter with evolution. Assuming that the Rb intershell mass fraction increases again by a factor of two we obtain a final [Rb/Fe] of 1.12 dex, which we consider as the maximum value for this particular model. Finally, the synthetic evolution algorithm results in a final H-exhausted core mass of , still well below the critical core mass value of (Nomoto, 1984), above which electron capture reactions start and the core collapses. This is also the case if we were to assume that there are no more TDU episodes, where we predict a final core mass of 1.22.
The main point of this section is to highlight that it is possible to reach [Rb/Fe] values of dex in the 6 and 7 models simply by extending the evolution and allowing for TPs near the tip of the AGB. In all of the models, the synthetic extension causes the surface composition to become carbon rich, where C/O , owing to the fact that HBB has ceased but the TDU continues. For this reason we conclude that TPs that occur after the cessation of HBB are not the cause of the highest Rb overabundances observed in the OH/IR stars.
5 Discussion
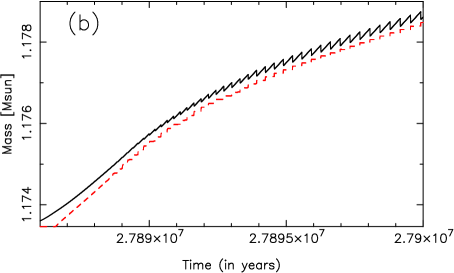
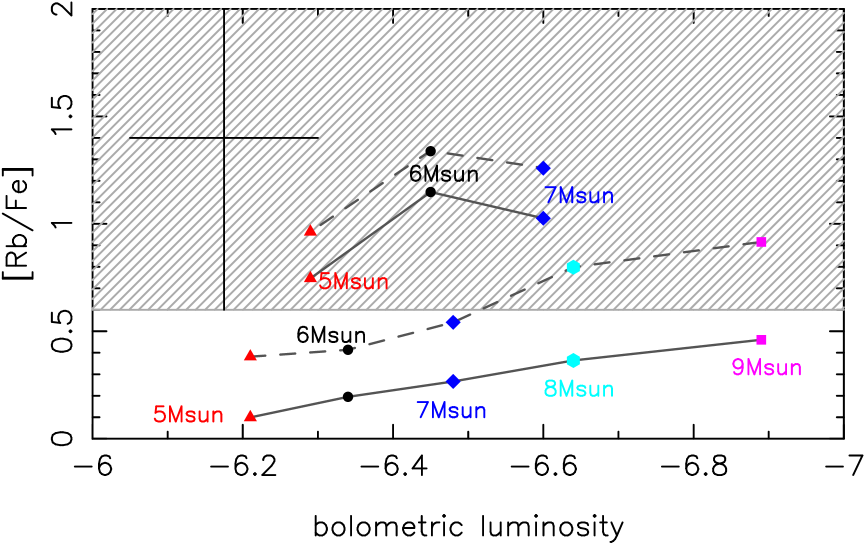
First we examine the behavior of [Rb/Fe] as a function of mass (or bolometric luminosity) for the set of models computed using the Vassiliadis & Wood (1993) mass-loss prescription. In Fig. 7 we show the bolometric luminosity at the tip of the AGB versus the [Rb/Fe] ratios for models calculated using the Vassiliadis & Wood (1993) mass-loss formula and for models with a delayed superwind. We show results from the 172 species network that used the NACRE rate for the e reaction, and include the final computed and synthetic [Rb/Fe] from Tables 3 and 4, respectively. The average [Rb/Fe] of 1.4 dex of the Rb-rich stars is included along with the maximum uncertainty on the derived abundances. The dashed region corresponds to the range of [Rb/Fe] where Rb-rich stars are found, where we choose a range of 0.6 dex to 2 dex (note that van Raai et al., 2012, choose a lower limit of 0.4 dex). We can see that the most massive AGB stars produce the most Rb, as suggested by the observations of García-Hernández et al. (2006) and found theoretically for a smaller mass range by van Raai et al. (2012). This trend holds when we compare [Rb/Fe] values obtained at the final TP (lower solid line in Fig. 7) compared to results from the synthetic extension (lower dashed line in Fig. 7). From inspection of Fig. 2 of García-Hernández et al. (2006) we see that most (12) of Rb-enriched Galactic OH/IR stars have [Rb/Fe] between dex and dex (with an average of dex), with a maximum error of dex. Three stars have [Rb/Fe] ratios much higher, at [Rb/Fe] dex. None of the models connected by the lower solid line in Fig. 7 produce [Rb/Fe] ratios in the range of the observations, and only the synthetic extension can produce high enough [Rb/Fe] ratios in the 8 and 9 models.
From Fig. 7 we see that models with a delayed superwind produce higher [Rb/Fe] abundances (shown by the upper solid line) and are found within the shaded region of the observations. This is mostly because these models experience many more TPs and TDU episodes. For example, delaying the superwind results in maximum increases of [Rb/Fe] = [Rb/Fe]dsw - [Rb/Fe]vw93 = 0.65, 0.95, and 0.76 dex respectively for the 5, 6, and 7 models when comparing models that use the NACRE rate. Note that [Rb/Fe]dsw is the final surface [Rb/Fe] from the model with a delayed superwind and [Rb/Fe]vw93 the final [Rb/Fe] from the model with Vassiliadis & Wood (1993). We find smaller increases of [Rb/Fe] = 0.25, 0.58, and 0.50 dex when using the 166 species network and the rate from Karakas et al. (2006b). In comparison, we find smaller variations if we compare nucleosynthesis models computed with the same stellar evolution input but different nuclear networks and rates for the e reactions. For example, using the newer Iliadis et al. (2010) rates for the e reactions instead of NACRE in the models with a delayed superwind results in decreases of up to 0.3 dex in the final [Rb/Fe] abundance. There are larger variations of up to 0.5 dex between the 172 species network delayed superwind models with the NACRE rate and models computed with the 166 species network with the Karakas et al. (2006b) rate. van Raai et al. (2012) did not find such large variations and indeed they only show up for the models with a delayed superwind. This is a consequence of the models experiencing many more TPs at temperatures that allow for activation of the e neutron source.
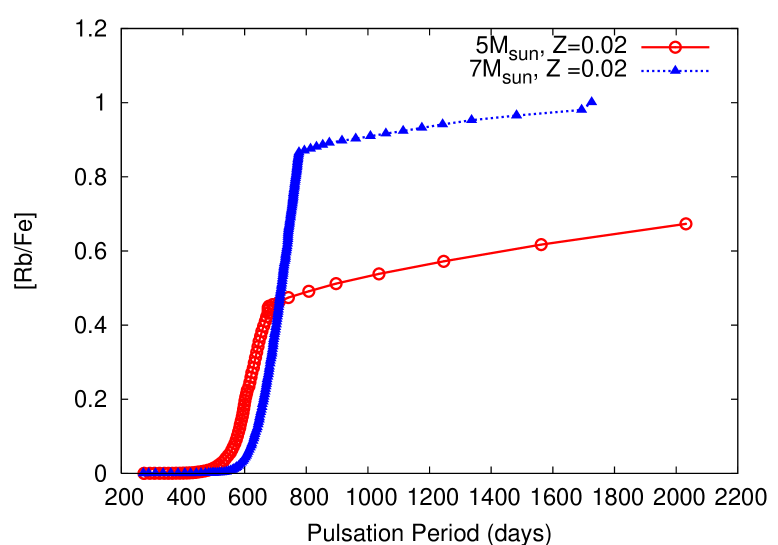
In Fig. 8 we show the surface [Rb/Fe] abundance versus the pulsation period for two models with a delayed superwind. Here the [Rb/Fe] value is seen to increase reasonably quickly for pulsation periods higher than about 500 days and 600 days for the 5 and 7 models, respectively. Once the superwind starts, the [Rb/Fe] abundance is seen to plateau. This is because the [Rb/Fe] does not increase very much from one TP to another ([Rb/Fe] only increases by dex per TP). During the superwind the pulsation period increases quickly but [Rb/Fe] does not. The predicted [Rb/Fe] of the 7 model enters the lowest observed abundance range (0.6 dex) of the Rb-rich stars at a pulsation period of approximately 700 days, whereas the 5 only does so near the end of the calculation. The observed period versus [Rb/Fe] relationship for the Rb-rich OH/IR stars is not published but a comparison would prove useful for providing extra constraints on the stellar evolution calculations.
Models with a delayed superwind also produce the highest Rb intershell abundances, again a consequence of more TPs. An increase in TPs leads to an increase in core mass, which leads to an increase in the maximum He-shell temperature. An increase in temperature results in a stronger activation of the e(,n)g reaction and more Rb production. However it is instructive to compare the results for the 9 super-AGB model in comparison to the 6 and 7 models computed with a delayed superwind. These models experienced similar numbers of TPs with temperatures over K (150, 178, 155 TPs for the 6, 7, and 9 models respectively) but the 6 and 7 models produce more Rb in the intershell. To understand why we need to examine Rb production in more detail. van Raai et al. (2012) provided a detailed discussion of the neutron-capture pathways that lead to the production of Rb in intermediate-mass AGB stars, here we briefly recap how this happens. Elemental Rb consists of two stable isotopes, b and b. The neutron-rich isotope b is produced in almost equal quantities in He-intershells of the 6 and 9 models (at the last TP the b abundance is only about 10% higher in the 6 model). However, in the 9 model the b/b ratio in the He-intershell after the last TP is 0.15 and therefore dominated by b. In comparison the ratio is 0.42 in the 6 model after the last TP. For comparison, the solar b/atio (Asplund et al., 2009). This indicates that b is not being produced as efficiently in the 9 model. This is because most of the b comes from the decay of the ground-state of the unstable r, which has a half-life of 3939 days (or years)666In our networks we also include as a separate species the meta-stable state of r which has a half-life of 4.48 hours and also -decays to b.. This lifetime of 10.7 years is longer than the duration of convective TPs ( years) in the 9 model, and also less than duration of the TDU ( years). This means that most of the r decays to b after mixing has finished. Note that the next TP is ignited further out in the He-intershell, leaving the previously made b in the core. In contrast, the duration of convective TPs in the 6 model is about 15 years, which allows the r to decay before the onset of the subsequent TDU episode.
We can now examine if either of the two proposed solutions we are testing can produce enough Rb to match the observations. Increasing the stellar mass does produce more Rb and leads to higher [Rb/Fe] ratios. The 8 and 9 models can produce enough Rb to match the bulk of the Rb-rich stars with [Rb/Fe] dex but only when synthetically extending the calculation to account for remaining TPs. Given the uncertainty of the synthetic calculation for the 9 model we take this result as tentative. Other calculations of -process nucleosynthesis of AGB stars near the C-O core limit as well as super-AGB stars are needed to verify our synthetic model predictions. The super-AGB models of C. Doherty et al. (2012, in preparation) and H. Lau et al. (2012, in preparation) cover a larger range of mass, metallicities, and mass-loss rates than we have explored here. It will be interesting to see if these models will be able to produce [Rb/Fe] abundances of at solar metallicity.
We can now also address the question as to whether delaying the superwind can produce enough Rb to match the [Rb/Fe] ratios derived for the Galactic OH/IR stars. Without the synthetic extension, the 6 and 7 models with a delayed superwind produce the highest [Rb/Fe] ratios of 1.14 and 1.02 dex, respectively. Both of these models are within the observed range of most Rb-rich stars which have [Rb/Fe] dex. The synthetic extension to the nucleosynthesis calculations results in [Rb/Fe] ratios of 1.3 and 1.34 dex for the 7 and 6 models, respectively. This means that the 6 with a delayed superwind can match the composition of the two Rb-enriched stars that have [Rb/Fe] dex after allowing for the substantial uncertainties of dex (only one other star has a higher ratio at [Rb/Fe] = 2.5 dex). Overall, we conclude that delaying the superwind leads to higher [Rb/Fe] ratios, with most of the Rb-enriched stars (with [Rb/Fe] dex) explained by the new stellar evolution models, even without allowing for the synthetic extension. It is also satisfying that this simple solution is motivated by observations of intermediate-mass AGB stars (e.g. Vassiliadis & Wood, 1993; García-Hernández et al., 2007).
The synthetic extension (dashed lines in Fig. 7) that accounts for final remaining TPs after the end of HBB allows us to reach [Rb/Fe] abundances of dex. The increase in heavy elements comes with a substantial increase in and in all cases the final predicted C/O . All our model stars would be observed as dust-enshrouded bright C-rich AGB stars (as seen in the LMC, van Loon et al., 1999b). In all cases the synthetic extension takes place when the pulsation period is very large (see Fig. 8) and the strong variability present on the AGB has almost ceased. Interestingly, many dust-enshrouded early post-AGB stars (with no signs of strong variability or very large periods) are found to show an inner C-rich dust shell together with an outer O-rich dust envelope, which is consistent with a late change of the chemistry of the central star (see Bunzel et al., 2009). These authors concluded that because all of the post-AGB stars still host masers in an O-rich environment the conversion of the inner shell chemistry cannot have happened more than a few thousand years ago. All stars must have experienced the conversion into a C star while they were losing the last of their envelopes before exposing their cores.
For the 6 and 7 models, only 4 and 7 extra TPs and TDU episodes are needed to reach [Rb/Fe] abundances of 1.4 dex. These synthetic estimates are produced with a much reduced envelope mass owing to the effect of the luminosity-driven superwind. The smaller dilution leads to larger [Rb/Fe] more quickly than during the normal evolution but it also perhaps suggests that we are too modest with our delay in the onset of the superwind. For some stars the superwind may not begin until the pulsation period reaches days or higher and this could lead to [Rb/Fe] dex. This explanation could also account for the composition of the three most Rb-enriched stars, with [Rb/Fe] dex.
We studied the inclusion of a -rich region in the He-intershell of a 5, model and found it to increase the [Rb/Fe] ratio by dex. This suggests that we may be able to obtain the average observed Rb value by 1) delaying the onset of the superwind even further than done here, and/or 2) including a pocket. There are questions about the formation of pockets in intermediate-mass AGB models. This is because the temperature at the base of the convective envelope during the TDU may become hot enough for proton-capture nucleosynthesis (Goriely & Siess, 2004; Herwig, 2004). For this study the most important consequence is the likely inhibition of formation of the pocket (Goriely & Siess, 2004). The models of Herwig (2004) have very deep TDU into the CO core, as a consequence of the diffusive convective overshoot scheme that he employs (see, e.g., Herwig, 2000). One interesting consequence of this overshoot is that each subsequent TP will be ignited deeper in the core and will be hotter. This would lead to a stronger activation of the e(,n)g reaction, and more Rb production. Also, the very deep dredge-up could reach the Rb left in the core, further enhancing the surface composition. It remains to be seen if this can produce Rb compositions as high as observed in the OH/IR stars.
While it has been assumed that the metallicities of the Galactic OH/IR stars are solar (García-Hernández et al., 2007), it cannot be discounted that there may be a small spread in metallicity. In van Raai et al. (2012) and from Fig. 4 we see that a reduction in the initial metallicity results in a substantial increase in the production of neutron-capture elements and of Rb, in particular. For example, using models from Karakas (2010) and the 172 species network that uses the latest Iliadis et al. (2010) rate, we find that a 6, ([Fe/H] =) model produces [Rb/Fe] = dex, and a 4, ([Fe/H] = ) model makes [Rb/Fe] = 1.02 dex. While these [Rb/Fe] abundances are much lower than the derived [Rb/Fe] values of the Rb-rich stars in the Large and Small Magellanic Cloud (up to 5 dex, García-Hernández et al., 2009), they are within the abundances derived for the Galactic OH/IR stars. Perhaps the OH/IR stars with the highest [Rb/Fe] abundances of evolved from slightly lower metallicity AGB stars of 6-7, [Fe/H] and a delayed superwind? Observational evidence for this hypothesis comes from the metallicity distribution of Galactic planetary nebulae (PNe) that span a range from , according to their O and Ar abundances (Sterling & Dinerstein, 2008). Note that this is also the case for Type I PNe, which are known to be the descendants of more massive AGB stars, according to their spatial distribution and kinematics (e.g., Corradi & Schwarz, 1995). Also, a large spread of metallicities is known in other galaxies such as the Large Magellanic Cloud (e.g., Grocholski et al., 2006). In summary, while the solutions proposed to explain the three most Rb-enriched stars seem promising, further detailed calculations are needed to test these scenarios.
In van Raai et al. (2012) we provided a detailed discussion of the serious uncertainties affecting the model atmospheres used to derive abundances for the OH/IR AGB stars, including NLTE and 3D effects on the formation of Rb lines in the atmospheres. Effects caused by using 1D model atmospheres compared to 3D are expected to be lower in the Galactic sources than in the Magellanic Cloud AGB stars owing to their higher metallicities. This means that our new results may bring observations and models into agreement without having to invoke large NLTE corrections. Note also that the NLTE corrections are expected to be larger in the outliers (the three objects with [Rb/Fe] dex), because the lines are more saturated. Finally, we do not repeat the discussion in van Raai et al. (2012) relating to the problem of the [Rb/Zr] ratio in the model stars compared to the observations. The problem stems from the fact that the models that produce Rb also produce some Zr, whereas Zr is absent from the atmosphere of the observed AGB stars. Here we note that the new models produce higher [Rb/Zr] ratios, in better agreement with the observations, but it still seems likely that an important fraction of the freshly manufactured Zr condenses into dust.
6 Concluding remarks
We have shown that delaying the superwind in intermediate-mass AGB stars results in far greater production of Rb and other neutron-capture elements at solar metallicity. This indicates a possible solution to the discrepancy between Rb observations and theoretical model predictions. Including a synthetic model to account for the final remaining TPs further increases the Rb composition of the envelope. The extra Rb comes with an increase of C and the final C/O ratio is for all models. However this exercise shows that not many more TPs are needed for the 6 and 7 models to match the average [Rb/Fe] ratio of most of the Rb-rich OH/IR stars. This could be achieved by delaying the start of the superwind mass-loss phase even further than done here or including a small pocket. These solutions may also allow us to reach the [Rb/Fe] abundances of the most Rb-rich stars with [Rb/Fe] .
In regards to reaction rates, we tested different nuclear networks and different rates for the e(,n)g and e(,)g reactions. Tests with a full -process network of 320 species shows that at solar metallicity the stars are not expected to produce many elements beyond the first -process peak at Rb-Sr (except perhaps in the case when a pocket is included). In regards to the e reactions, the NACRE rates result in the highest Rb abundances. The newer e rates from Iliadis et al. (2010), which have significantly lower uncertainties, produce [Rb/Fe] ratios that are lower by up to 0.3 dex, whereas the rates from Karakas et al. (2006b) produce final [Rb/Fe] that are up to 0.5 dex lower. Note that this is mostly because the e(,)g rate from Iliadis et al. (2010) has been significantly reduced, while the e(,n)g rate is similar to Karakas et al. (2006b). Using the e reactions from Iliadis et al. (2010) produces final maximum [Rb/Fe] dex and covers the lower end of the distribution of [Rb/Fe] in the observed OH/IR AGB stars. To match the composition of most of the Rb-rich stars requires us to use the faster NACRE rates. This may provide an important constraint on these notoriously difficult to estimate reaction rates. The main issue with this at the moment is the large uncertainties on the Rb abundances derived from observations.
We finish with a discussion of the impact of the nucleosynthesis of the brightest AGB stars on the chemical evolution of galaxies and stellar systems. Delaying the superwind in intermediate-mass stars results in a far greater production of neutron-capture elements at solar metallicity and we would expect that this increased production to carry on through to the lowest metallicities. Our models and the observations by García-Hernández et al. (2006) and García-Hernández et al. (2009) show that the most massive C-O core AGB stars of solar metallicity (up to 7) and at the metallicities of the Large and Small Magellanic Clouds experience considerable dredge-up. This has some important consequences. If intermediate-mass stars at the metallicities of the Galactic globular clusters (GCs; [Fe/H]) also experience deep TDU, then intermediate-mass AGB stars would not be good candidates to explain the abundance anomalies observed in every well studied GCs (e.g., Gratton et al., 2004). This has been explored quantitatively by Fenner et al. (2004) and Karakas et al. (2006a) using yields from models with deep dredge-up, similar to those presented here. Intermediate-mass stars of up to might instead be candidates for producing the neutron-capture elements in some GCs, including M4 (Yong et al., 2008b, a) and M22 (in particular see discussion in Roederer et al., 2011). Note that the neutron-capture elements observed in GCs do not show any correlation with the light-element abundance patterns, ruling out a relation between the two. However, models of stars with masses near the limit of C-O core production (here the 8 model) or super-AGB stars with O-Ne cores may not experience very efficient TDU (see the models of Siess, 2010; Ventura & D’Antona, 2011). These objects experience very hot HBB and depending upon the model, little pollution from He-intershell material (notably primary ). Siess (2010) and Ventura & D’Antona (2011) explored this idea using super-AGB models of the appropriate metallicity. Further, our results and theirs show that super-AGB stars can produce the high helium abundances of needed to explain the multiple-populations observed in the color-magnitude diagrams of some GCs (e.g., Piotto et al., 2005).
How can we test that intermediate-mass AGB stars of low metallicity did (or did not) produce the neutron-capture elements in GCs? Unfortunately it is not possible to verify this production directly with observations today, although there do exist bright -process rich AGB stars in the SMC with metallicities of [Fe/H] (García-Hernández et al., 2009), which are at the upper end of the GC metallicity distribution (e.g., 47 Tucanae, Harris, 1996). However, the most metal-poor, massive AGB stars would have evolved away a long time ago. One hope is that future large-scale surveys of halo stars (e.g., the High Efficiency and Resolution Multi-Element Spectrograph for the AAT or SkyMapper) might reveal hints of such nucleosynthesis among the carbon and nitrogen-enhanced metal-poor star population.
 |
 |
 |
 |
 |
 |
 |


| TPs | NTPs | |||||||||||
|---|---|---|---|---|---|---|---|---|---|---|---|---|
| () | () | () | (days) | (years) | () | (MK) | (MK) | |||||
| 5.0 | 1.787 | 0.914 | 500 | 25 | 17 | 1.29() | 0.95 | 6.47() | 57.3 | 344 | ||
| 5.0 | 1.641 | 0.756 | 700 | 72 | 64 | 1.18() | 0.95 | 2.22() | 73.2 | 354 | ||
| 6.0 | 1.673 | 0.761 | 500 | 33 | 25 | 7.87() | 0.93 | 6.67() | 76.5 | 351 | ||
| 6.0a | 1.583 | 0.670 | 500 | 36 | 25 | 7.77() | 0.95 | 6.71() | 87.2 | 355 | ||
| 6.0 | 1.628 | 0.691 | 800 | 158 | 150 | 4.77() | 0.92 | 3.56() | 84.1 | 366 | 6.90 | 6.45 |
| 7.0 | 2.150 | 1.181 | 500 | 42 | 33 | 4.67() | 0.90 | 5.32() | 87.7 | 364 | 6.83 | 6.48 |
| 7.0 | 2.115 | 1.122 | 800 | 188 | 178 | 3.50() | 0.90 | 2.70() | 91.4 | 378 | 7.04 | 6.60 |
| 8.0 | 2.621 | 1.568 | 500 | 59 | 49 | 2.20() | 0.89 | 3.95() | 96.8 | 378 | 7.12 | 6.64 |
| 9.0 | 3.208 | 2.019 | 500 | 163 | 155 | 5.37() | 0.77 | 3.27() | 111 | 402 | 7.55 | 6.89 |
Note: MK denotes the temperature in K, NTPs denotes the number of TPs with peak temperatures over 300K, denotes the peak AGB bolometric luminosity, and denotes the AGB-tip bolometric luminosity. (a) Computed with . All other models have .
| Mass | Net | e | X(He) | C/O | / | [N/Fe] | [O/Fe] | [Na/Fe] | [Al/Fe] | g/g | g/g | |
|---|---|---|---|---|---|---|---|---|---|---|---|---|
| 5.0 | 500 | 166 | K06 | 0.321 | 1.204 | 14.00 | 0.505 | 0.227 | 0.037 | 5.524 | 4.638 | |
| 5.0 | 500 | 172 | NAC | 0.316 | 1.192 | 13.46 | 0.509 | 0.213 | 0.057 | 5.108 | 4.213 | |
| 5.0 | 700 | 166 | K06 | 0.332 | 0.772 | 11.14 | 1.228 | 1.229 | 0.114 | 2.404 | 1.700 | |
| 5.0 | 700 | 172 | NAC | 0.331 | 0.717 | 11.49 | 1.245 | 0.308 | 0.157 | 2.013 | 1.378 | |
| 5.0 | 700 | 172 | I10 | 0.331 | 0.718 | 11.43 | 1.242 | 0.306 | 0.140 | 2.467 | 2.828 | |
| 5.0 | 700 | 320 | NAC | 0.334 | 0.720 | 11.13 | 1.245 | 0.311 | 0.160 | 1.981 | 1.375 | |
| 6.0 | 500 | 166 | K06 | 0.341 | 0.678 | 14.25 | 0.869 | 0.699 | 0.053 | 5.220 | 4.103 | |
| 6.0 | 500 | 172 | NAC | 0.337 | 0.647 | 14.71 | 0.879 | 0.235 | 0.062 | 4.750 | 3.677 | |
| 6.0 | 500 | 320 | NAC | 0.338 | 0.633 | 13.48 | 0.884 | 0.235 | 0.062 | 4.718 | 3.682 | |
| 6.0 | 800 | 166 | K06 | 0.384 | 0.887 | 8.440 | 1.410 | 1.466 | 0.215 | 1.679 | 1.157 | |
| 6.0 | 800 | 172 | NAC | 0.371 | 0.711 | 9.046 | 1.423 | 0.343 | 0.251 | 1.067 | 0.723 | |
| 6.0 | 800 | 172 | I10 | 0.371 | 0.710 | 8.950 | 1.420 | 0.358 | 0.200 | 1.263 | 1.514 | |
| 7.0 | 500 | 166 | K06 | 0.362 | 0.582 | 12.43 | 0.897 | 0.744 | 0.050 | 4.734 | 3.996 | |
| 7.0 | 500 | 172 | NAC | 0.355 | 0.545 | 12.52 | 0.908 | 0.251 | 0.044 | 4.144 | 3.510 | |
| 7.0 | 800 | 166 | K06 | 0.396 | 0.943 | 7.588 | 1.326 | 0.985 | 0.174 | 0.714 | 0.924 | |
| 7.0 | 800 | 172 | NAC | 0.383 | 0.761 | 8.005 | 1.339 | 0.097 | 0.208 | 0.360 | 0.426 | |
| 7.0 | 800 | 172 | I10 | 0.383 | 0.762 | 7.989 | 1.337 | 0.121 | 0.157 | 0.386 | 0.768 | |
| 8.0 | 500 | 166 | K06 | 0.367 | 0.440 | 9.462 | 0.903 | 0.623 | 0.030 | 2.139 | 3.186 | |
| 8.0 | 500 | 172 | NAC | 0.366 | 0.395 | 9.282 | 0.921 | 0.208 | 0.026 | 1.676 | 2.620 | |
| 8.0 | 500 | 172 | I10 | 0.362 | 0.399 | 9.506 | 0.914 | 0.188 | 0.022 | 1.690 | 3.474 | |
| 8.0 | 500 | 320 | NAC | 0.361 | 0.391 | 9.342 | 0.914 | 0.171 | 0.027 | 1.569 | 2.545 | |
| 9.0 | 500 | 166 | K02 | 0.387 | 0.342 | 6.555 | 0.962 | 0.495 | 0.02 | 0.357 | 1.114 | |
| 9.0 | 500 | 172 | NAC | 0.375 | 0.300 | 6.370 | 0.975 | 0.085 | 0.028 | 0.197 | 0.631 |
Note: Net denotes the network used for the calculation. The initial C/O ratio = 0.55, the initial / = 89.4, and the initial g/g and g/g ratios are 7.89 and 7.17, respectively. Here e denotes the rate used in the calculation where K06 is the rate from Karakas et al. (2006b), NAC is the NACRE rate, and IL10 the rate from Iliadis et al. (2010).
| Mass | Net | e | [Co/Fe] | [Cu/Fe] | [Se/Fe] | [Kr/Fe] | [Rb/Fe] | [Sr/Fe] | [Zr/Fe] | [Ba/Fe] | |
|---|---|---|---|---|---|---|---|---|---|---|---|
| 5.0 | 500 | 166 | K06 | 0.174 | 0.092 | 0.016 | 0.030 | 0.012 | – | ||
| 5.0 | 500 | 172 | NAC | 0.259 | 0.222 | 0.053 | 0.064 | 0.099 | 0.035 | – | |
| 5.0 | 700 | 166 | K06 | 0.508 | 0.446 | 0.164 | 0.191 | 0.275 | 0.128 | – | |
| 5.0 | 700 | 172 | NAC | 0.581 | 0.681 | 0.555 | 0.615 | 0.746 | 0.422 | 0.228 | – |
| 5.0 | 700 | 172 | I10 | 0.558 | 0.558 | 0.338 | 0.346 | 0.457 | 0.214 | 0.058 | – |
| 5.0 | 700 | 320 | NAC | 0.584 | 0.667 | 0.574 | 0.652 | 0.763 | 0.497 | 0.332 | 0.080 |
| 6.0 | 500 | 166 | K06 | 0.220 | 0.146 | 0.032 | 0.052 | 0.022 | – | ||
| 6.0 | 500 | 172 | NAC | 0.288 | 0.293 | 0.132 | 0.139 | 0.195 | 0.078 | – | |
| 6.0 | 500 | 320 | NAC | 0.287 | 0.282 | 0.133 | 0.157 | 0.198 | 0.096 | 0.045 | 0.018 |
| 6.0 | 800 | 166 | K06 | 0.628 | 0.671 | 0.420 | 0.492 | 0.635 | 0.387 | 0.166 | – |
| 6.0 | 800 | 172 | NAC | 0.639 | 0.870 | 0.860 | 1.026 | 1.148 | 0.807 | 0.631 | – |
| 6.0 | 800 | 172 | I10 | 0.648 | 0.775 | 0.668 | 0.764 | 0.886 | 0.563 | 0.376 | – |
| 7.0 | 500 | 166 | K06 | 0.216 | 0.168 | 0.016 | 0.049 | 0.074 | 0.033 | – | |
| 7.0 | 500 | 172 | NAC | 0.248 | 0.296 | 0.175 | 0.201 | 0.266 | 0.116 | – | |
| 7.0 | 800 | 166 | K06 | 0.513 | 0.581 | 0.361 | 0.436 | 0.571 | 0.340 | 0.132 | – |
| 7.0 | 800 | 172 | NAC | 0.498 | 0.751 | 0.741 | 0.904 | 1.021 | 0.693 | 0.522 | – |
| 7.0 | 800 | 172 | I10 | 0.517 | 0.678 | 0.592 | 0.696 | 0.808 | 0.504 | 0.327 | – |
| 8.0 | 500 | 166 | K06 | 0.197 | 0.202 | 0.054 | 0.091 | 0.132 | 0.060 | – | |
| 8.0 | 500 | 172 | NAC | 0.183 | 0.300 | 0.221 | 0.284 | 0.364 | 0.172 | 0.034 | – |
| 8.0 | 500 | 172 | I10 | 0.194 | 0.268 | 0.157 | 0.194 | 0.256 | 0.112 | – | |
| 8.0 | 500 | 320 | NAC | 0.195 | 0.303 | 0.242 | 0.322 | 0.397 | 0.224 | 0.133 | 0.022 |
| 9.0 | 500 | 166 | K06 | 0.155 | 0.246 | 0.106 | 0.164 | 0.242 | 0.116 | 0.070 | – |
| 9.0 | 500 | 172 | NAC | 0.121 | 0.317 | 0.269 | 0.363 | 0.460 | 0.225 | 0.171 | – |
| Mass | TPs remaining | X(Rb)intershell | Final [Rb/Fe] | ||
|---|---|---|---|---|---|
| () | (days) | () | (dex) | ||
| 5.0 | 500 | 3 | 0.417 | 5.5() | 0.38 |
| 5.0 | 700 | 2 | 0.412 | 5.6() | 0.96 |
| 6.0 | 500 | 3 | 0.187 | 1.1() | 0.41 |
| 6.0 | 800 | 4 | 0.193 | 7.0() | 1.34 |
| 7.0 | 500 | 6 | 0.194 | 2.0() | 0.54 |
| 7.0 | 800 | 7 | 0.150 | 8.0() | 1.26 |
| 8.0 | 500 | 15 | 0.106 | 3.1() | 0.80 |
| 9.0 | 500 | 60 | 0.031 | 5.3() | 0.90 |
Note: Intershell compositions are from the 172 species network which include the NACRE rate for the e neutron source.
References
- Abia et al. (2001) Abia, C., Busso, M., Gallino, R., Domínguez, I., Straniero, O., & Isern, J. 2001, ApJ, 559, 1117
- Angulo et al. (1999) Angulo, C., et al. 1999, Nucl. Phys. A, 656, 3
- Arndt et al. (1997) Arndt, T. U., Fleischer, A. J., & Sedlmayr, E. 1997, A&A, 327, 614
- Asplund et al. (2009) Asplund, M., Grevesse, N., Sauval, A. J., & Scott, P. 2009, ARA&A, 47, 481
- Bao et al. (2000) Bao, Z. Y., Beer, H., Käppeler, F., Voss, F., Wisshak, K., & Rauscher, T. 2000, Atomic Data and Nuclear Data Tables, 76, 70
- Bemmerer et al. (2006) Bemmerer, D., et al. 2006, Nuclear Physics A, 779, 297
- Blöcker (1995) Blöcker, T. 1995, A&A, 297, 727
- Boothroyd & Sackmann (1988) Boothroyd, A. I. & Sackmann, I.-J. 1988, ApJ, 328, 671
- Bunzel et al. (2009) Bunzel, F., García-Hernández, D. A., Engels, D., Perea-Calderón, J. V., & García-Lario, P. 2009, in Astronomical Society of the Pacific Conference Series, Vol. 418, AKARI, a Light to Illuminate the Misty Universe, ed. T. Onaka, G. J. White, T. Nakagawa, & I. Yamamura, 431
- Busso et al. (1999) Busso, M., Gallino, R., & Wasserburg, G. J. 1999, ARA&A, 37, 239
- Cannon (1993) Cannon, R. C. 1993, MNRAS, 263, 817
- Corradi & Schwarz (1995) Corradi, R. L. M. & Schwarz, H. E. 1995, A&A, 293, 871
- Cosner et al. (1980) Cosner, K., Iben, Jr., I., & Truran, J. W. 1980, ApJ, 238, L91
- Cyburt et al. (2010) Cyburt, R. H., et al. 2010, ApJS, 189, 240
- De Beck et al. (2010) De Beck, E., Decin, L., de Koter, A., Justtanont, K., Verhoelst, T., Kemper, F., & Menten, K. M. 2010, A&A, 523, A18
- Doherty et al. (2010) Doherty, C. L., Siess, L., Lattanzio, J. C., & Gil-Pons, P. 2010, MNRAS, 401, 1453
- Fenner et al. (2004) Fenner, Y., Campbell, S., Karakas, A. I., Lattanzio, J. C., & Gibson, B. K. 2004, MNRAS, 353, 789
- Ferrario et al. (2005) Ferrario, L., Wickramasinghe, D., Liebert, J., & Williams, K. A. 2005, MNRAS, 361, 1131
- Forestini & Charbonnel (1997) Forestini, M. & Charbonnel, C. 1997, A&AS, 123, 241
- García-Hernández et al. (2006) García-Hernández, D. A., García-Lario, P., Plez, B., D’Antona, F., Manchado, A., & Trigo-Rodríguez, J. M. 2006, Science, 314, 1751
- García-Hernández et al. (2007) García-Hernández, D. A., García-Lario, P., Plez, B., Manchado, A., D’Antona, F., Lub, J., & Habing, H. 2007, A&A, 462, 711
- García-Hernández et al. (2009) García-Hernández, D. A., et al. 2009, ApJ, 705, L31
- Goriely & Siess (2004) Goriely, S. & Siess, L. 2004, A&A, 421, L25
- Gratton et al. (2004) Gratton, R., Sneden, C., & Carretta, E. 2004, ARA&A, 42, 385
- Grocholski et al. (2006) Grocholski, A. J., Cole, A. A., Sarajedini, A., Geisler, D., & Smith, V. V. 2006, AJ, 132, 1630
- Groenewegen et al. (2009) Groenewegen, M. A. T., Sloan, G. C., Soszyński, I., & Petersen, E. A. 2009, A&A, 506, 1277
- Hale et al. (2004) Hale, S. E., Champagne, A. E., Iliadis, C., Hansper, V. Y., Powell, D. C., & Blackmon, J. C. 2004, Phys. Rev. C, 70, 045802
- Harris (1996) Harris, W. E. 1996, AJ, 112, 1487
- Herwig (2000) Herwig, F. 2000, A&A, 360, 952
- Herwig (2004) —. 2004, ApJ, 605, 425
- Herwig (2005) —. 2005, ARA&A, 43, 435
- Iliadis et al. (2010) Iliadis, C., Longland, R., Champagne, A. E., Coc, A., & Fitzgerald, R. 2010, Nuclear Physics A, 841, 31
- Izzard et al. (2004) Izzard, R. G., Tout, C. A., Karakas, A. I., & Pols, O. R. 2004, MNRAS, 350, 407
- Kamath et al. (2012) Kamath, D., Karakas, A. I., & Wood, P. R. 2012, ApJ, 746, 20
- Karakas (2010) Karakas, A. I. 2010, MNRAS, 403, 1413
- Karakas et al. (2010) Karakas, A. I., Campbell, S. W., & Stancliffe, R. J. 2010, ApJ, 713, 374
- Karakas et al. (2006a) Karakas, A. I., Fenner, Y., Sills, A., Campbell, S. W., & Lattanzio, J. C. 2006a, ApJ, 652, 1240
- Karakas & Lattanzio (2007) Karakas, A. I. & Lattanzio, J. C. 2007, Publ. Astron. Soc. Aust., 24, 103
- Karakas et al. (2002) Karakas, A. I., Lattanzio, J. C., & Pols, O. R. 2002, Publ. Astron. Soc. Aust., 19, 515
- Karakas et al. (2006b) Karakas, A. I., Lugaro, M., Wiescher, M., Goerres, J., & Ugalde, C. 2006b, ApJ, 643, 471
- Karakas et al. (2009) Karakas, A. I., van Raai, M. A., Lugaro, M., Sterling, N. C., & Dinerstein, H. L. 2009, ApJ, 690, 1130
- Kobayashi et al. (2011) Kobayashi, C., Karakas, A. I., & Umeda, H. 2011, MNRAS, 414, 3231
- Lambert et al. (1995) Lambert, D. L., Smith, V. V., Busso, M., Gallino, R., & Straniero, O. 1995, ApJ, 450, 302
- Lattanzio et al. (1996) Lattanzio, J., Frost, C., Cannon, R., & Wood, P. R. 1996, Mem. Soc. Astron. Italiana, 67, 729
- Lau et al. (2012) Lau, H. H. B., Gil-Pons, P., Doherty, C. L., & Lattanzio, J. C. 2012, A&A, submitted
- Lederer & Aringer (2009) Lederer, M. T. & Aringer, B. 2009, A&A, 494, 403
- Liebert et al. (2005) Liebert, J., Bergeron, P., & Holberg, J. B. 2005, ApJS, 156, 47
- Lugaro et al. (2012) Lugaro, M., Karakas, A. I., Stancliffe, R. J., & Rijs, C. 2012, ApJ, 747, 2
- Marigo (2001) Marigo, P. 2001, A&A, 370, 194
- Marigo (2002) —. 2002, A&A, 387, 507
- Nomoto (1984) Nomoto, K. 1984, ApJ, 277, 791
- Piotto et al. (2005) Piotto, G., et al. 2005, ApJ, 621, 777
- Reimers (1975) Reimers, D. 1975, Circumstellar envelopes and mass loss of red giant stars (Problems in stellar atmospheres and envelopes.), 229–256
- Roederer et al. (2011) Roederer, I. U., Marino, A. F., & Sneden, C. 2011, ApJ, 742, 37
- Romano et al. (2010) Romano, D., Karakas, A. I., Tosi, M., & Matteucci, F. 2010, A&A, 522, A32
- Siess (2010) Siess, L. 2010, A&A, 512, A10
- Smith & Lambert (1987) Smith, V. V., & Lambert, D. L. 1987, MNRAS, 226, 563
- Stancliffe et al. (2004) Stancliffe, R. J., Tout, C. A., & Pols, O. R. 2004, MNRAS, 352, 984
- Sterling & Dinerstein (2008) Sterling, N. C. & Dinerstein, H. L. 2008, ApJS, 174, 158
- Travaglio et al. (2004) Travaglio, C., Gallino, R., Arnone, E., Cowan, J., Jordan, F., & Sneden, C. 2004, ApJ, 601, 864
- Truran & Iben (1977) Truran, J. W. & Iben, Jr., I. 1977, ApJ, 216, 797
- van Loon et al. (2005) van Loon, J. T., Cioni, M.-R. L., Zijlstra, A. A., & Loup, C. 2005, A&A, 438, 273
- van Loon et al. (1999a) van Loon, J. T., Groenewegen, M. A. T., de Koter, A., Trams, N. R., Waters, L. B. F. M., Zijlstra, A. A., Whitelock, P. A., & Loup, C. 1999a, A&A, 351, 559
- van Loon et al. (1999b) van Loon, J. T., Zijlstra, A. A., & Groenewegen, M. A. T. 1999b, A&A, 346, 805
- van Raai et al. (2012) van Raai, M. A., Lugaro, M., Karakas, A. I., Garcia-Hernandez, D. A., & Yong, D. 2012, A&A, accepted
- Vassiliadis & Wood (1993) Vassiliadis, E. & Wood, P. R. 1993, ApJ, 413, 641
- Ventura & D’Antona (2005a) Ventura, P. & D’Antona, F. 2005a, A&A, 431, 279
- Ventura & D’Antona (2005b) —. 2005b, A&A, 439, 1075
- Ventura & D’Antona (2011) —. 2011, MNRAS, 410, 2760
- Ventura & Marigo (2009) Ventura, P. & Marigo, P. 2009, MNRAS, 399, L54
- Ventura & Marigo (2010) —. 2010, MNRAS, 408, 2476
- Wachter et al. (2002) Wachter, A., Schröder, K.-P., Winters, J. M., Arndt, T. U., & Sedlmayr, E. 2002, A&A, 384, 452
- Wachter et al. (2008) Wachter, A., Winters, J. M., Schröder, K.-P., & Sedlmayr, E. 2008, A&A, 486, 497
- Yong et al. (2008a) Yong, D., Karakas, A. I., Lambert, D. L., Chieffi, A., & Limongi, M. 2008a, ApJ, 689, 1031
- Yong et al. (2008b) Yong, D., Lambert, D. L., Paulson, D. B., & Carney, B. W. 2008b, ApJ, 673, 854