Bulk Fermi surface and momentum density in heavily doped La2-xSrxCuO4 using high resolution Compton scattering and positron annihilation spectroscopies
Abstract
We have observed the bulk Fermi surface (FS) in an overdoped (=0.3) single crystal of La2-xSrxCuO4 by using Compton scattering. A two-dimensional (2D) momentum density reconstruction from measured Compton profiles yields a clear FS signature in the third Brillouin zone along [100]. The quantitative agreement between density functional theory (DFT) calculations and momentum density experiment suggests that Fermi-liquid physics is restored in the overdoped regime. In particular the predicted FS topology is found to be in good accord with the corresponding experimental data. We find similar quantitative agreement between the measured 2D angular correlation of positron annihilation radiation (2D-ACAR) spectra and the DFT based computations. However, 2D-ACAR does not give such a clear signature of the FS in the extended momentum space in either the theory or the experiment.
pacs:
74.72-h, 78.70.Ck, 78.70.Bj, 71.10.AyI Introduction
High temperature cuprate superconductors DSH ; BeK such as La2-xSrxCuO4 (LSCO) show interesting Mott insulator behavior sudip ; fulde at low doping while at high doping these materials display Fermi liquid properties. DSH ; proust ; hussy This fascinating phase diagram is complicated by the presence of various inhomogeneities such as stripe ordering Kivel and possible clustering of dopants.BB Many models of the overdoped metallic phase have been put forward, some generalizing the concept of the Fermi liquid, while others attempt to use Hubbard or t-J models. In this context, it is important to investigate the electron momentum density of these materials, which, when compared to predictions of theoretical models, can give an indication of their correctness or applicability.
Insight into the evolution of electronic states can be obtained via Fermi surface (FS) measurements in various doping regimes. Experimental FS work on the cuprates has to date been limited mainly to angle-resolved photoemission (ARPES),DSH ; BeK quantum oscillations (QO),QOsc and scanning tunneling spectroscopies (STS).hanaguri However, ARPESabARPES and STSabSTM are surface sensitive probes. Although QO measurements probe the bulk, they provide only FS areas without giving information on the location of the FSs in momentum space. Furthermore QO require long mean free paths and large magnetic fields which could alter the ground state. For underdoped samples there is evidence of FSs distorted from Local Density Approximation (LDA) based band structure predictions, involving arcs or pockets, but as doping is increased it appears that a large, LDA-like FS becomes manifest as the pseudogap collapses near optimal doping. For an overdoped Tl-cuprate, the FS has been found to be large and closed around , peets07 suggesting that the Van Hove singularity (vHS) still lies below the Fermi energy in good agreement with LDA calculations.bba94
These considerations provide motivation for deploying genuinely bulk sensitive spectroscopies for FS measurements in the cuprates. Two such spectroscopies, which have been used extensively for this purpose, are high-resolution Compton scattering cs1 ; cs2 and two-dimensional angular correlation of positron annihilation radiation (2D-ACAR).acar1 ; acar2 ; acar3 Compton scattering probes the momentum density of the many-body electronic ground state of the system and is insensitive to the presence of defects or surfaces in the sample.lsmo 2D-ACAR also probes the bulk momentum density, but its interpretation can be complicated by positron spatial distribution effects.manuel_acar_review ; Blandin ; howel On the other hand, the Compton scattering technique requires large single crystals of materials having atoms with high atomic numbers (), as is the case for all cuprates, but it suffers from the problem of a relatively low signal from valence electrons sitting on the large background contribution from the core electrons.
With this background, the present article reports a study of the FS and electron momentum density (EMD) of an overdoped single crystal of La2-xSrxCuO4 (LSCO) for the hole doping level =0.3. Compton scattering and 2D-ACAR experiments have been carried out on the same LSCO sample, and the results are analyzed through parallel computations of the FS, the EMD as well as the electron-positron momentum density within the framework of DFT. The conventional picture of the metallic state based on Landau Fermi liquid theory is expected to become increasingly viable with doping as the system becomes more weakly correlated, even though the physics of the cuprates is generally dominated by deviations from such a simple picture of electronic states. For this reason, the overdoped LSCO provides a good starting system for investigating the fermiology of the cuprates.
Although earlier Compton studies have provided some insight into the ground-state momentum density and electron correlation effects in LSCO, laukkanen ; science_lsco we attempt to study the FS of LSCO using high-resolution Compton scattering experiments. The 2D-ACAR experiments, on the other hand, have been deployed successfully by several groups in the past for delineating the FSs of the cuprates in a number of favorable cases.manuel_acar_review
Here, by measuring a series of high resolution Compton profiles, we reconstruct the 2D momentum density in overdoped LSCO and identify a clear signature of the FS in the third Brillouin zone. Moreover, the DFT-based theoretical EMD is found to be in quantitative accord with the Compton scattering results, indicating that the ground state wavefunction in the overdoped system is well-described by the weakly correlated DFT picture. We have also found a quantitative level of agreement between the measured and computed 2D-ACAR spectra. However, the 2D-ACAR spectra do not reveal clear FS signatures due to the well-known positron spatial distribution effects, which can make the positron insensitive to electrons in the Cu-O planes.
The remainder of this article is organized as follows. Section II describes experimental details of sample preparation and of Compton scattering and positron-annihilation experiments. Section III provides technical details of our DFT-based EMD, FS and electron-positron momentum density computations. Section IV discusses momentum density anisotropy results, while Sec. V considers the FS determination. The article concludes with a summary of the results in Sec. VI.
II EXPERIMENTS
The heavily overdoped single crystal () was grown by the traveling solvent floating zone method. For this purpose, a powder sample was first synthesized by the conventional solid state reaction method. It was then shaped into feed rods under hydrostatic pressure and sintered at 1173 K for 12 hours, and at 1423 K for an additional 10 hours. In this process, excess CuO of 2 mol% was added to the feed rods to compensate for the evaporation of CuO during the high temperature process. The grown crystal was subsequently annealed under an oxygen pressure of 3 atm at 1173 K for 100 hours. Superconducting quantum interference device (SQUID) measurements, using MPMS-XL5HG (Quantum Design, Inc.), showed no superconductivity down to 2 K. Neutron diffraction studies indicated that the crystal is tetragonal (I4/mmm) down to the lowest temperature. The crystal was also characterized by other experiments. exp1 ; exp2 ; exp3
We have measured 10 Compton profiles with scattering vectors equally
spaced between the [100] and [110] directions using the Cauchois-type
x-ray spectrometer at the BL08W beamline of SPring-8.spring8 All
measurements were carried out at room temperature. The overall momentum
resolution is estimated to be 0.13 a.u. full-width-at-half-maximum (FWHM).
The incident x-ray energy was 115 keV and the scattering angle was
rad. Approximately 5 counts in total were collected at
the Compton peak channel, and two independent measurements were performed
in order to check the results. Each Compton profile was corrected for
absorption, analyzer and detector efficiencies, scattering cross section,
possible double scattering contributions, and x-ray background. The
core-electron contributions were subtracted from each Compton profile. A
two-dimensional momentum density, representing a projection of the
three-dimensional momentum density onto the plane, was reconstructed
from each set of ten Compton profiles using the direct Fourier transform
method.fourier
The 2D-ACAR was measured using the Delft University 2D-ACAR spectrometerfalub with a conventional 22Na positron source. The data were taken at a temperature of about K. To correct for the sample shape mm the data were convoluted with a gaussian of FWHM of 0.1 channel in the direction and 1.7 channels in the direction (along which the positrons impinge on the sample), where one channel corresponds to 0.184 mrad. The total resolution is mrad2 FWHM (1 mrad = 0.137 a.u). The total number of coincidences collected is and the maximum number of coincidences at the center is counts.
The effects of superconductivity on the 2D-ACAR as well as Compton spectra peter are expected to be below the resolution of the current experiments. For this reason, we have not carried out experiments on the superconducting state in connection with the present study.
III CALCULATIONS
Our electronic structure calculations are based on the LDA within the framework of the DFT. An all-electron fully charge-self-consistent semi-relativistic Korringa-Kohn-Rostoker (KKR) methodology was used.bansil The crystal structure of LSCO was taken to be body-centered tetragonal (BCT) with space group (139) using lattice parameters and given in Ref. sahrakorpi, . A non-spinpolarized calculation neglecting the magnetic structure was performed. Self-consistency was obtained for and the effect of doping was treated within a rigid band model by shifting the Fermi energy to accommodate the proper number of electrons.foot2ab ; footAB2 ; footAB3 The results are in good agreement with other calculations.freeman The formalism for computing momentum density, , is discussed in Refs. mijnarends1, ; mijnarends3, ; mijnarends4, ; mijnarends5, . The EMD is calculated according to the formula
| (1) |
and the ACAR spectrum is computed as
| (2) |
where denotes the electronic wave function, the positron wavefunction, and with G a reciprocal lattice vector. is the occupation function agp which in the independent particle model equals if the electron state is occupied and when it is empty, and the summation extends over the occupied k states. In the calculation, we have neglected the enhancement factor for the annihilation rate.gga The inclusion of enhancement effects is crucial for the calculation of lifetimes but is well-known Blandin ; icpa_bba92 to be not very important for discussing questions of bonding and FS signals in momentum density. The momentum densities are calculated on a momentum mesh with step (. The momentum is expressed in atomic units defined by where is the Bohr radius. The calculations include contributions from both the filled valence bands and the conduction-band which gives rise to the FS in LSCO. To study the electronic structure of the system, we consider two quantities of interest, 2D-EMD and 1D-EMD, which are the projection of EMD in 2D and 1D, respectively, given by:
| (3) |
and
| (4) |
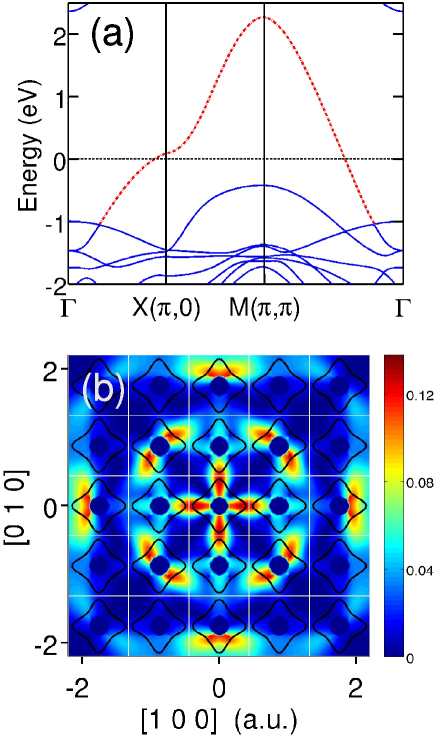
The calculated band structure of LSCO () near the Fermi level is illustrated in Fig. 1(a). The band closest to the Fermi level is shown by the red dotted curve. This CuO2 energy band is dominated by copper-oxygen orbitals. The present calculation for =0.3 predicts that the vHS is above the Fermi energy, so the FS has a diamond shape closed around the point. Figure 1(b) shows the 2D momentum density contribution of the band, , together with the FS sections at for the doping level mapped periodically throughout the momentum space. The Brillouin zones are visualized in the figure by a grid of , where is the lattice constant. The momentum density acts as a matrix element on the FS map. Thus, since has strong amplitudes in the third Brillouin zones, the FS could be more easily detected there.
The positron annihilation and Compton scattering experiments probe all the electrons in the system. However, core and semi-core electrons give isotropic distributions while the anisotropy of the spectra is produced by electrons near the Fermi energy. Therefore, we can concentrate on analyzing the residual anisotropy after subtraction of the isotropic part. We consider an anisotropy with symmetry, given byc4v :
| (5) |
In order to enhance FS signals, it is also possible to calculate another anisotropy obtained by subtraction of a smooth cylindrical average of the distribution defined by
| (6) |
where is a smoothed cylindrical average of , in which the original spectrum is averaged over rotation angles from 0∘ to 45∘ in steps of 1∘.
IV Momentum Density Anisotropy
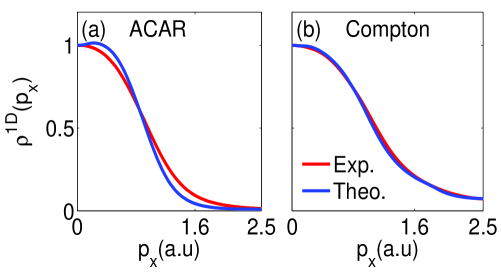
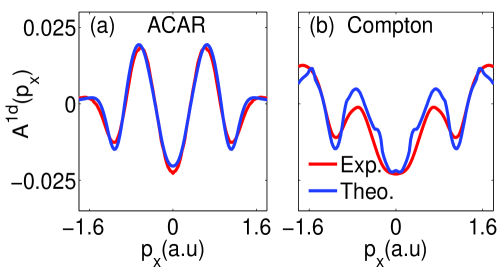
We start by comparing the experimental 1D profiles based on Compton scattering and ACAR measurements with the corresponding theoretical predictions. Figure 2 shows a good level of accord between theory and experiment, especially for the Compton results. Further insight is gained by considering the 1D-projection of the anisotropy of Eq. LABEL:eq5 given by
| (7) |
where is the momentum range over which the projection is taken.note2 The profile , shown in Fig. 3, is also equal to the difference of profiles lsmo between two crystallographic directions [100] - [110] and it can be compared to a similar Compton profile anisotropy measured by Shukla et al. at a lower hole doping.shukla99 The amplitude of the theory is the same as that in the experiment, while in Ref. shukla99, the theoretical had to be scaled down by a factor of to obtain agreement with experiment. We note that theory predicts that the main contribution of correlation effects is an isotropic redistribution of the momentum density,lp so that the amplitudes of oscillation in become significantly reduced in the strongly correlated system. Hence our quantitative agreement between theory and experiment suggests that the doped regime is consistent with Fermi liquid physics and that correlation effects modifying the anisotropy shukla99 ; bba_platzman are relatively weak.
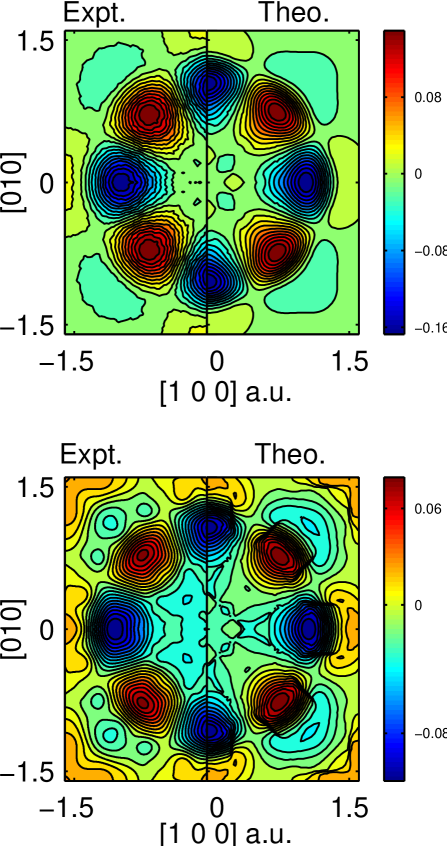
In order to focus on the Cu-O band contribution, Fig. 4 presents the 2D anisotropy distributions in the () plane for positron annihilation and Compton scattering spectra, respectively. note1 The anisotropy of the ACAR note1 in Fig. 4 can be modeled by a molecular orbital method turchi involving the overlap of the positron wavefunction with Cu 3 states hybridized with O 2 states. For an atomic orbital, the momentum density has the same point symmetry as the corresponding charge density. This result carries over to molecular states turchi and is equally applicable to solid-state wave functions.harthoorn78 The Compton scattering anisotropy maps are very similar overall to the positron-annihilation results, except that the Compton spectra extend to significantly higher momenta. This is expected since in the ACAR case the tendency of the positron to avoid positively charged ionic cores has the effect of suppressing higher momentum components of the EMD produced by the core and the localized valence electrons. Figure 4 clearly shows that the theory reproduces most of the structure observed in the measured Compton as well as positron-annihilation distributions, including the momenta at which various features are located. The fourfold symmetry of the spectra is a consequence of the symmetry of the underlying body-centered tetragonal lattice.
Therefore, an important finding of our work is that the correlations that ordinarily reduce the Compton anisotropy amplitudes are no longer effective at this doping. Similar Fermi liquid behavior has been reported in studies of overdoped Tl-cuprates.DSH ; proust ; hussy Moreover, the trend of the weakening of correlation effects with doping is also consistent with the changes observed in x-ray absorption towfiq ; peets09 and photoelectron spectroscopies.schneider
V FERMI SURFACE RESULTS
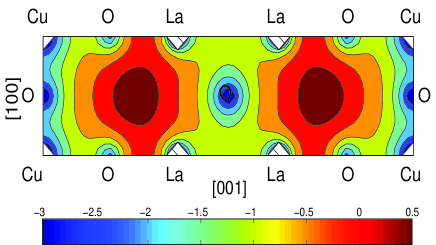
We comment briefly on the positron results first. Although the electron-positron momentum density measured in a positron-annihilation experiment contains FS signatures, the amplitude of such signatures is controlled by the extent to which the positron wavefunction overlaps with the states at the Fermi energy. Figure 5 shows the positron density distribution in a planar section of the LSCO unit cell. As in the calculation by Blandin et al. Blandin , our result indicates that the positron does not probe well the FS contribution of the Cu-O planes in LSCO. Moreover, positron-annihilation favors FS contributions involving O 2 rather than Cu 3 states because the positron wavefunction overlaps more with extended O states compared to the more tightly bound Cu 3 states.
Indeed, we see little evidence of FS signatures in either the computed or the measured ACAR distributions Fig.3 (a). A more favorable case for the 2D-ACAR distribution is provided by the YBa2Cu3O7 cuprate superconductor, where the 1-dimensional ridge FS has a two-fold symmetry which distinguishes it from important four-fold symmetry wave function effects.haghighi ; hoffmann On the other hand, the Compton scattering calculation reveals a clear Fermi surface feature near a momentum a.u., and equivalent positions, Fig. 4(b). Strikingly, a similar feature is seen in the experimental spectrum on the left-side of the figure. To see this more clearly, we apply a Lock-Crisp-West folding procedure, Fig. 6.
The Lock-Crisp-West (LCW) theoremLCW can be used both in Compton scattering 2D-EMD and in the case of 2D-ACAR data to study the non isotropic features of the momentum density by folding the data into a single central Brillouin zone. This technique can enhance FS discontinuities (‘breaks’) by coherently superposing the umklapp terms.Blandin However, the LCW folding can also artificially enhance errors in the experimental data.bba94 Thus, to more clearly expose FS features in the data, we consider the cylindrical anisotropy defined by Eq. 6.
Since the subtracted function is smooth and slowly varying this procedure does not contribute to, nor create, new structures in the spectrum remaining after subtraction.
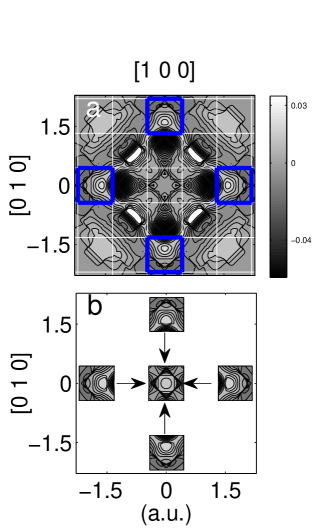
Figure 6 (a) shows the cylindrical anisotropy of the theoretical 2D-EMD spectrum. The momentum density is represented in the extended zone scheme. Because the FS is periodic, a complete FS must exist in each Brillouin zone, but with its intensity modulated by matrix element effects, as in Fig. 1(b). For a predominantly -wave FS, the matrix element effects will strongly suppress spectral weight near , so the FS breaks are most clearly seen in higher Brillouin zones. These FS breaks appear superimposed on the momentum density in the form of discontinuities which can occur in any Brillouin zone. In Fig.6 (a), the Fermi surface breaks are the regions where the contours run closely together so that the electron momentum density varies rapidly at these locations. Figure 6 (a) shows the calculated Fermi breaks in several Brillouin zones. In particular, in the third zones framed with blue squares, the arc-like features are theoretically predicted FSs associated with Cu-O planes. Due to the tetragonal symmetry, a rotation of the spectrum by will generate symmetry-related regions (blue squares) with equivalent strong FS features. These regions are isolated in Fig.6 (b). By performing a ‘partial folding’, that is, folding only these regions back into the first Brillouin zone, we produce a full FS, where strong matrix element effects are substantially circumvented. The resulting FS map is shown in the center of Fig.6 (b), and again on a larger scale in Fig.7 (a). Applying the same procedure to other Brillouin zone regions produces similar results. For instance, the four regions along the diagonal neighboring the central region can also yield full FS information, but here it is superimposed on strong momentum density features.
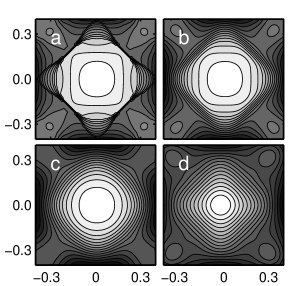
In Figure 7 we compare the theoretical FS obtained via the aforementioned ‘partial folding’ procedure to the corresponding experimental result. Figure 7 (a) shows that the partial backfolding technique produces the FS of correct size and topology. The same procedure when applied to the experimental spectrum yields results of Fig.7 (d). To compare with theory, we have convoluted the spectrum in Fig.7(a) with a.u and a.u. resolutions, leading to the distributions of Figs.7 (b) and (c) respectively. The latter is close to the actual experimental resolution used in this work.
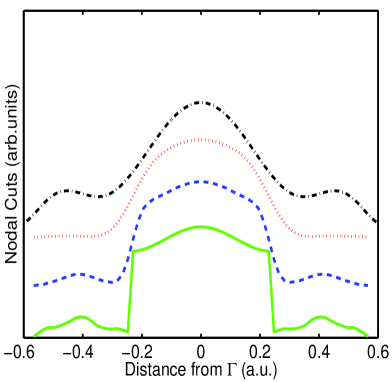
By comparing the four frames in Fig. 7, one can see that the experimental spectrum in Fig. 7 (d) shows FS structures consistent with the LDA theory shown in Fig. 7 (a). Clearly the FS discontinuity along the nodal direction is smeared when including resolution broadening as shown in Fig.7 (b) and Fig7 (c ). The best overall agreement between theory and experiment lies between Fig. 7 (b) and Fig7 (c ). This is also confirmed by the cuts taken along the nodal direction plotted in Fig.8. The remaining discrepancy between experiment and theory could result from intrinsic or extrinsic inhomogeneity effects such as the appearance of local ferromagnetic clusters about concentrated regions of dopant atoms,BB which have been neglected in the present simulations. Our conclusion is that the closed FS for predicted by our LDA calculation is consistent both with the present Compton scattering data and with surface-sensitive ARPES results.Yoshida
VI CONCLUSIONS
We have performed momentum density measurements
on a high quality overdoped LSCO sample using both Compton scattering and 2D-ACAR.
First principles calculations were also performed for the corresponding spectra.
The quantitative agreement between the calculations and the experiment for ACAR as well as
EMD anisotropies suggests that
overdoped LSCO can be explained within the conventional Fermi-liquid theory.
Nevertheless, a FS signal was only clearly observed by Compton scattering in
the third Brillouin zone along [100]. Our FS analysis
confirms previous ARPES FS measurements Yoshida showing an electron-like FS
in the overdoped regime. This validation is important since
we provide via deep inelastic x-ray scattering experiments a truly
bulk-sensitive image of momentum density maps of electrons near the Femi level.
In general, this momentum density information is difficult to extract
from ARPES experiments due to difficulties associated with matrix element
effects and the well-known surface sensitivity of ARPES.
Acknowledgements This work is supported by the USDOE grants No. DE-FG02-07ER46352 and No. DE-FG02-08ER46540 (CMSN) and benefited from the allocation of supercomputer time at NERSC and Northeastern University’s Advanced Scientific Computation Center (ASCC), and the Stichting Nationale Computer faciliteiten (National Computing Facilities Foundation, NCF). The work at JASRI was supported by a Grant-in-Aid for Scientific Research (nos. 18340111 and 22540382) from the Ministry of Education, Culture, Sports, Science, and Technology (MEXT), Japan, and that at Tohoku University was supported by a Grant-in-Aid for Scientific Research (nos. 16104005, 19340090 and 22244039) from the MEXT, Japan. The Compton scattering experiments were performed with the approval of JASRI (Proposals, 2003B0762, 2004A0152, 2007B1413, 2008A1191).
References
- (1) A. Damascelli, Z.-X. Shen and Z. Hussain, Rev. Mod. Phys. 75, 473 (2003).
- (2) K.H. Bennemann and J.B. Ketterson (Eds.), Physics of Superconductors, vol. 2, (Springer, Berlin, 2004).
- (3) S. Chakravarty, B.I. Halperin and D.R. Nelson, Phys. Rev. Lett. 60, 1057 (1988); A. Aharony, R. J. Birgeneau, A. Coniglio, M. A. Kastner, and H. E. Stanley, Phys. Rev. Lett. 60, 1330 (1988).
- (4) P. Fulde, Electron Correlations in Molecules and Solids, (Springer, Berlin, 1995).
- (5) C. Proust, E. Boaknin, R.W. Hill, L. Taillefer, and A.P. Mackenzie, Phys. Rev. Lett. 89, 147003 (2002).
- (6) N.E. Hussey, M. Abdel-Jawad, A. Carrington, A.P. Mackenzie, L. Balicas, Nature 425, 814 (2003).
- (7) S.A. Kivelson, I.P. Bindloss, E. Fradkin, V. Oganesyan, J.M. Tranquada, A. Kapitulnik, and C. Howald, Rev. Mod. Phys. 75, 1201 (2003).
- (8) B. Barbiellini and T. Jarlborg, Phys. Rev. Lett. 101, 157001 (2008).
- (9) N. Doiron-Leyraud, C. Proust, D. LeBoeuf, J. Levallois, J.B. Bonnemaison, Ruixing Liang, D. A. Bonn, W. N. Hardy, and Louis Taillefer, Nature (London) 447, 565 (2007); E.A. Yelland, J. Singleton, C. H. Mielke, N. Harrison, F. F. Balakirev, B. Dabrowski, and J. R. Cooper, Phys. Rev. Lett. 100, 047003 (2008); A.F. Bangura, J. D. Fletcher, A. Carrington, J. Levallois, M. Nardone, B. Vignolle, P. J. Heard, N. Doiron-Leyraud, D. LeBoeuf, L. Taillefer, S. Adachi, C. Proust, and N. E. Hussey, Phys. Rev. Lett. 100, 047004 (2008); S. C. Riggs, O. Vafek, J. B. Kemper, J. B. Betts, A. Migliori, F. F. Balakirev, W. N. Hardy, Ruixing Liang, D. A. Bonn and G. S. Boebinger Nature Physics 7, 332 (2011); S.E. Sebastian, N. Harrison, P. A. Goddard, M. M. Altarawneh, C. H. Mielke, Ruixing Liang, D. A. Bonn, W. N. Hardy, O. K. Andersen, G. G. Lonzarich, arXiv:1001.5015.
- (10) T. Hanaguri, Y. Kohsaka, J.C. Davis, C. Lupien, I. Yamada, M. Azuma, M. Takano, K. Ohishi, M. Ono, and H. Takagi, Nat. Phys. 3, 865 (2007).
- (11) A. Bansil and M. Lindroos, Phys. Rev. Letters 83, 5154(1999); A. Bansil, M. Lindroos, S. Sahrakorpi, and R. S. Markiewicz, Physical Review B 71, 012503 (2005); M. Lindroos and A. Bansil, Phys. Rev. Letters 77, 2985(1996).
- (12) J. Nieminen, H. Lin, R. S. Markiewicz, and A. Bansil, Phys. Rev. Lett. 102, 037001 (2009); J. Nieminen, I. Suominen, R. S. Markiewicz, H. Lin, and A. Bansil, Phys. Rev. B 80, 134509 (2009).
- (13) D.C. Peets, J D F Mottershead, B Wu, I S Elfimov, Ruixing Liang, W N Hardy, D A Bonn, M Raudsepp, N J C Ingle and A Damascelli, New J. Phys. 9, 28 (2007).
- (14) B. Barbiellini, M. Gauthier, L. Hoffmann, T. Jarlborg, A. A. Manuel, S. Massidda, M. Peter and G. Triscone, Physica C 229, 113 (1994).
- (15) M. J. Cooper, P. E. Mijnarends, N. Shiotani, N. Sakai and A. Bansil in X-Ray Compton Scattering, Oxford University Press (2004); M. J. Cooper, Rep. Prog. Phys. 48, 415 (1985).
- (16) Y. Tanaka, Y. Sakurai, A.T. Stewart, N. Shiotani, P.E. Mijnarends, S. Kaprzyk, and A. Bansil, Phys. Rev. B 63, 045120 (2001); S. Huotari, K. Hämäläinen, S. Manninen, S. Kaprzyk, A. Bansil, W. Caliebe, T. Buslaps, V. Honkimäki, and P. Suortti, Phys. Rev. B 62, 7956 (2000); G. Stutz, F. Wohlert, A. Kaprolat, W. Schülke, Y. Sakurai, Y. Tanaka, M. Ito, H. Kawata, N. Shiotani, S. Kaprzyk, and A. Bansil, Phys. Rev. B 60, 7099 (1999).
- (17) P.E. Bisson, P. Descouts, A. Dupanloup, A.A. Manuel, E. Perreard, M. Peter and R. Sachot, Helv. Phys. Acta 55, 110 (1982); J. Mader, S. Berko, H. Krakauer and A. Bansil, Phys. Rev. Letters 37, 1232(1976); J. C. Campuzano, L. C. Smedskjaer, R. Benedek, G. Jennings, and A. Bansil, Phys. Rev. B43, 2788(1991).
- (18) L. P. Chan, K. G. Lynn and D. R. Harshman, Mod. Phys. Lett. B 6, 617 (1992).
- (19) R.N. West, in Positron Spectroscopy of Solids, A. Dupasquier and A.P.Mills Jr. eds, (IOS Press, Amsterdam 1995) pp. 75-143
- (20) B. Barbiellini, A. Koizumi, P. E. Mijnarends, W. Al- Sawai, Hsin Lin, T. Nagao, K. Hirota, M. Itou, Y. Sakurai and A. Bansil, Phys.Rev. Lett. 102, 206402 (2009); Y. Sakurai, Y. Tanaka, A. Bansil, S. Kaprzyk, A. T. Stewart, Y. Nagashima, T. Hyodo, S. Nanao, H. Kawata, and N. Shiotani, Phys. Rev. Letters 74, 2252(1995).
- (21) L. C. Smedskjaer, A. Bansil, U. Welp, Y. Fang and K. G. Bailey, Physica C 192, 259 (1992); A.A. Manuel, A. Shukla, L. Hoffmann, T. Jarlborg, B. Barbiellini, S. Massidda, W. Sadowski, E. Walker, A. Erb and M. Peter, J. Phys. and Chem. of Solids 56, 1951 (1995); A.A. Manuel, Handbook on the Physics and Chemistry of Rare Earths Vol. 30, edited by K.A. Gschneider, Jr., L. Eyring and M.B. Maple, (Elsevier Science B.V. 2000); P. E. Mijnarends, A. C. Kruseman, A. van Veen, H. Schut and A. Bansil, J. Physics: Condens. Matter 10, 10383(1998).
- (22) P. Blandin, S. Massidda, B. Barbiellini, T. Jarlborg, P. Lerch, A. A. Manuel, L. Hoffmann, M. Gauthier, W. Sadowski, E. Walker, M. Peter, Jaejun Yu and A. J. Freeman, Phys. Rev. B 46, 390 (1992).
- (23) R. H. Howell, P. A. Sterne, M. J. Fluss, J. H. Kaiser, K. Kitazawa and H. Kojima, Phys. Rev. B 49, 13127 (1994).
- (24) J. Laukkanen, K. Hämäläinen, S. Manninen, A. Shukla, T. Takahashi, K. Yamada, B. Barbiellini, S. Kaprzyk and A. Bansil, J. Phys. Chem. Solids 62, 2249 (2001).
- (25) Y. Sakurai, M. Itou, B. Barbiellini, P. E. Mijnarends, R. S. Markiewicz, S. Kaprzyk, J.-M. Gillet, S. Wakimoto, M. Fujita, S. Basak, Yung Jui Wang, W. Al-Sawai, H. Lin, A. Bansil and K. Yamada, Science 332, 698 (2011).
- (26) S. Wakimoto, H. Zhang, K. Yamada, I. Swainson, Hyunkyung Kim and R. J. Birgeneau, Phys. Rev. Lett. 92, 217004 (2004).
- (27) S. Wakimoto, Young-June Kim, Hyunkyung Kim, H. Zhang, T. Gog and R. J. Birgeneau, Phys. Rev. B 72, 224508 (2005).
- (28) S. Wakimoto, R. J. Birgeneau, A. Kagedan, Hyunkyung Kim, I. Swainson, K. Yamada and H. Zhang, Phys. Rev. B 72, 064521 (2005).
- (29) N. Hiraoka, M. Itou, T. Ohata, M. Mizumaki, Y. Sakurai and N. Sakai, J. Synchrotron Radiat. 8, 26 (2001); M. Itou and Y. Sakurai, AIP Conf. Proc. 705, 901 (2004); Y. Sakurai and M. Itou, J. Phys. Chem. Solids 65, 2061 (2004).
- (30) I. Matsumoto, J. Kwiatkowska, F. Maniawski, M. Itou, H. Kawata, N. Shiotani, S. Kaprzyk, P. E. Mijnarends, B. Barbiellini and A. Bansil, Phys. Rev. B 64, 045121 (2001).
- (31) C. V. Falub, P. E. Mijnarends, S.W.H. Eijt, M.A. van Huis, A. van Veen and H. Schut, Phys. Rev. B 66, 075426 (2002).
- (32) S.E. Barnes and M. Peter, Phys. Rev. B 40, 10958 (1989).
- (33) A. Bansil, S. Kaprzyk, P. E. Mijnarends and J. Toboła, Phys. Rev. B 60, 13396 (1999).
- (34) S. Sahrakorpi, M. Lindroos, R. S. Markiewicz and A. Bansil, Phys. Rev. Lett. 95, 157601 (2005).
- (35) The rigid band picturefootAB2 is expected to be reasonable for doping away from the cuprate planes. It will be interesting to examine doping effects via first principles approaches footAB3 .
- (36) A. Bansil, Z. Naturforsch. 48 A, 165 (1993); Hsin Lin, S. Sahrakorpi, R. S. Markiewicz and A. Bansil, Phys. Rev. Letters 96, 097001 (2006); H. Asonen, M. Lindroos, M. Pessa, R. Prasad, R. S. Rao and A. Bansil, Phys. Rev. B25, 7075 (1982).
- (37) S. Kaprzyk and A. Bansil, Phys. Rev. B 42, 7358(1990); L. Schwartz and A. Bansil, Phys. Rev. B 10, 3261(1974); R. Prasad and A. Bansil, Phys. Rev. B21, 496 (1980).
- (38) J. Yu, A.J. Freeman and J.-H. Xu, Phys. Rev. Lett. 58, 1035 (2008).
- (39) P. E. Mijnarends and A. Bansil, Phys. Rev. B 13, 2381 (1976); ibid. Phys. Rev. B 19, 2912 (1979).
- (40) P. E. Mijnarends and A. Bansil, J.Phys.: Condens. Matter 2, 911 (1990).
- (41) A. Bansil, R. S. Rao, P. E. Mijnarends and L. Schwartz, Phys. Rev. B 23, 3608 (1981).
- (42) P.E. Mijnarends and A. Bansil, in Positron Spectroscopy of Solids, edited by A. Dupasquier and A. P. Mills (IOS Press, Amsterdam, 1995), p. 25.
- (43) B. Barbiellini and A. Bansil, J. Phys. Chem. Solids 62, 2181 (2001); B. Barbiellini, J. Phys Chem. Solids 61, 341 (2000).
- (44) B. Barbiellini, M. J. Puska, T. Torsti and R. M. Nieminen, Phys. Rev. B 51, 7341 (1995); B. Barbiellini, M. J. Puska, T. Korhonen, A. Harju, T. Torsti and R. M. Nieminen, Phys. Rev. B. 53, 16201 (1996).
- (45) B. Barbiellini, P. Genoud, P. Lerch, T. Jarlborg and M. Peter, Materials Sciences Forum 105-110, 599 (1992).
- (46) is the Schoenflies notation for a group containing a reflection in addition to , a single 4-fold axis symmetry. See e.g. M. Tinkham, Group Theory and Quantum Mechanics, (McGraw-Hill, 1964).
- (47) The limits of integration are within the momentum interval [-2.5, 2.5] a.u.
- (48) A. Shukla, B. Barbiellini, A. Erb, A.A. Manuel, T. Buslaps, V. Honkimäki and P. Suortti, Phys. Rev. B 59, 12127 (1999).
- (49) L. Lam and P.M. Platzman, Phys. Rev. B 9, 5122 (1974).
- (50) B. Barbiellini and P.M. Platzman, Mat. Sci. Forum 255-257, 189 (1997).
- (51) Our experimental ACAR spectra are in reasonable accord with earlier studies Refs. Blandin, ; howel, .
- (52) P.E.A. Turchi, A.L. Wachs, K.L. Wetzler, J.H. Kaiser, R.N. West, Y.C. Jean, R.H. Howell and M.J. Fluss, J. Phys. Condens. Matter 2, 1635 (1990).
- (53) R. Harthoorn and P.E. Mijnarends, J. Phys. F 8, 1147 (1978).
- (54) T. Ahmed, T. Das, J.J. Kas, Hsin Lin, B. Barbiellini, Fernando D. Vila, R.S. Markiewicz, A. Bansil and J. J. Rehr, Phys. Rev. B 83 115117 (2011).
- (55) D. C. Peets, D. G. Hawthorn, K. M. Shen, Y.-J. Kim, D. S. Ellis, H. Zhang, S. Komiya, Y. Ando, G. A. Sawatzky, R. Liang, D. A. Bonn and W. N. Hardy, Phys. Rev. Lett. 103, 087402 (2009).
- (56) M. Schneider, R.-S. Unger, R. Mitdank, R. Müller, A. Krapf, S. Rogaschewski, H. Dwelk, C. Janowitz and R. Manzke, Phys. Rev. B 72, 014504 (2005).
- (57) H. Haghighi, J. H. Kaiser, S. Rayner, R. N. West, J. Z. Liu, R. Shelton, R. H. Howell, F. Solal, P. A. Sterne and M. J. Fluss, Phys. Rev. Lett. 67, 382 (1991).
- (58) L. Hoffmann, A.A. Manuel, M. Peter, E. Walker, M. Gauthier, A. Shukla, B. Barbiellini, S. Massidda, Gh. Adam, S. Adam, W. N. Hardy and Ruixing Liang, Phys. Rev. Lett. 71, 4047 (1993).
- (59) D.G. Lock, V.H.C. Crisp and R.N. West, J. Phys. F 3, 561 (1973).
- (60) T. Yoshida, X.J. Zhou, M. Nakamura, S.A. Kellar, P.V. Bogdanov, E.D. Lu, A. Lanzara, Z. Hussain, A. Ino, T. Mizokawa, A. Fujimori, H. Eisaki, C. Kim, Z.X. Shen, T. Kakeshita and S. Uchida, Phys. Rev. B. 63, 220501 (2001); T. Yoshida, X. J. Zhou, K. Tanaka, W. L. Yang, Z. Hussain, Z. X. Shen, A. Fujimori, S. Sahrakorpi, M. Lindroos, R. S. Markiewicz, A. Bansil, Seiki Komiya, Yoichi Ando, H. Eisaki, T. Kakeshita and S. Uchida, Phys. Rev. B 74, 224510 (2006).