Are motorways rational from slime mould’s point of view?
Abstract
We analyse the results of our experimental laboratory approximation of motorways networks with slime mould Physarum polycephalum. Motorway networks of fourteen geographical areas are considered: Australia, Africa, Belgium, Brazil, Canada, China, Germany, Iberia, Italy, Malaysia, Mexico, The Netherlands, UK, USA. For each geographical entity we represented major urban areas by oat flakes and inoculated the slime mould in a capital. After slime mould spanned all urban areas with a network of its protoplasmic tubes we extracted a generalised Physarum graph from the network and compared the graphs with an abstract motorway graph using most common measures. The measures employed are the number of independent cycles, cohesion, shortest paths lengths, diameter, the Harary index and the Randić index. We obtained a series of intriguing results, and found that the slime mould approximates best of all the motorway graphs of Belgium, Canada and China, and that for all entities studied the best match between Physarum and motorway graphs is detected by the Randić index (molecular branching index).
Keywords: transport networks, motorways, slime mould, unconventional computing
1 Introduction
The increase of long-distance travel and subsequent reconfiguration of vehicular and social networks [35] requires novel and unconventional approaches towards analysis of dynamical processes in complex transport networks [15], routing and localisation of vehicular networks [43], optimisation of interactions between different parts of a transport network during scheduling of the road expansion and maintenance [53], and shaping of transport network structure [17]. “The concept of a network is useful, but it may be misleading, because it gives the impression that it arises from a coherent planning process, whereas in practice almost all road networks have evolved gradually, being added to and altered over time to meet the ever-changing needs and demands of travellers. … even our more recently built network of roads, the motorways designated for exclusive use of motor vehicles, has been result of nearly a century of thinking and rethinking about what should be built.” [21]
Modern motorway networks are based on the millennium-long emergence of roads. First there were prehistoric trackways — mesolithic footways established by early men ’seeking most direct and convenient alternatives by process of trial and error’ [16, 21] or based on the routes selected by the animals [54], timber trackways and droveways (used primarily by cattle). Further development of roads was country-specific. Talking about England we can speculate that Romans were building roads along pre-existing trackways and possibly along Ridgeways. In the 1700s turnpikes were established. They were based on pre-existing roads with few local diversions [18]. The turnpikes were then substituted by single carriageways, dual carriageways and, finally, motorways [21]. Thus backtracking the history of motorways we arrive to pathways developed by living creatures. How were the pathways developed? Were they efficient? More or less accurate answers could be found by imitating the road network development with living substrates.
While choosing a biological object to imitate the growth of road networks we want it to be experimental laboratory friendly, easy to cultivate and handle, and convenient to analyse. Ants would indeed be the first candidate. They do develop trails very similarly to pre-historic people. The great deal of impressive results has been published on ant-colony inspired computing [23, 49]. However ant colonies require substantial laboratory resources, experience and time in handling them. Actually very few, if any, papers were published on experimental laboratory implementation of ant-based optimisation (also there is the issue of what happens if ant collide on the paths, or fight), the prevalent majority of publications being theoretical. There is however an object which is extremely easy to cultivate and handle, and which exhibits remarkably good foraging behaviour and development of intra-cellular transport networks. This is the plasmodium of Physarum polycephalum. Plasmodium is a vegetative stage of acellular slime mould P. polycephalum, a single cell with many nuclei, which feeds on microscopic particles [50]. When foraging for its food the plasmodium propagates towards sources of food particles and microbes, surrounds them, secretes enzymes and digests the food. Typically, the plasmodium forms a congregation of protoplasm covering the food source. When several sources of nutrients are scattered in the plasmodium’s range, the plasmodium forms a network of protoplasmic tubes connecting the masses of protoplasm at the food sources. A structure of the protoplasmic networks is apparently optimal, in a sense that it covers all sources of nutrients and provides a robust and speedy transportation of nutrients and metabolites in the plasmodium’s body [38, 39, 40].
Motorway networks are designed for efficient vehicular transportation of goods and passengers, protoplasmic networks are developed for efficient intra-cellular transportation of nutrients and metabolites. Is there a similarity between these two networks?
To uncover analogies between biological and human-made transport networks and to project behavioural traits of biological networks onto development of vehicular transport networks we conducted a series of experimental laboratory studies on evaluation and approximation of motorway networks by P. polycephalum in fourteen geographical regions: Africa, Australia, Belgium, Brazil, Canada, China, Germany, Iberia, Italy, Malaysia, Mexico, The Netherlands, UK, and USA [2]–[14],[51]. We represented each region with an agar plate, imitated major urban areas with oat flakes, inoculated plasmodium of P. polycephalum in a capital, and analysed structures of protoplasmic networks developed. For all regions studied in laboratory experiments [2]–[14],[51], we found that, the network of protoplasmic tubes grown by plasmodium matches, at least partly, the network of human-made transport arteries. The shape of a country and the exact spatial distribution of urban areas, represented by sources of nutrients, may play a key role in determining the exact structure of the plasmodium network. In the present paper we aim to answer two principal questions. What measures, apart from straightforward comparison of edges between motorway and plasmodium networks, are reliable indicators of matching? Which regions have the most ‘Physarum friendly’ motorway networks, i.e. show highest degree of matching between motorways and protoplasmic networks along several measures? In the course of investigation we got the answers to these questions and also obtained a few quite intriguing results on hierarchies of motorway and protoplasmic networks based on measures and topological indices.
2 Experimental
In laboratory experiments [2]–[14],[51] we considered fourteen regions: Australia, Africa, Belgium, Brazil, Canada, China, Germany, Iberia, Italy, Malaysia, Mexico, The Netherlands, UK, and USA. Agar plates, 2% agar gel (Select agar, Sigma Aldrich), were cut in a shape of any particular region and placed in polyestyrene square Petri dishes mm or mm. For each region we choose the most populated urban areas scaled down locations of which were projected onto agar gel. Numbers of the areas selected for each country are as follows: Africa , Australia , Belgium , Brazil , Canada , China , Germany , Iberia , Italy , Malaysia , Mexico , Netherlands , UK , USA , see detailed configurations in [2]–[14],[51].
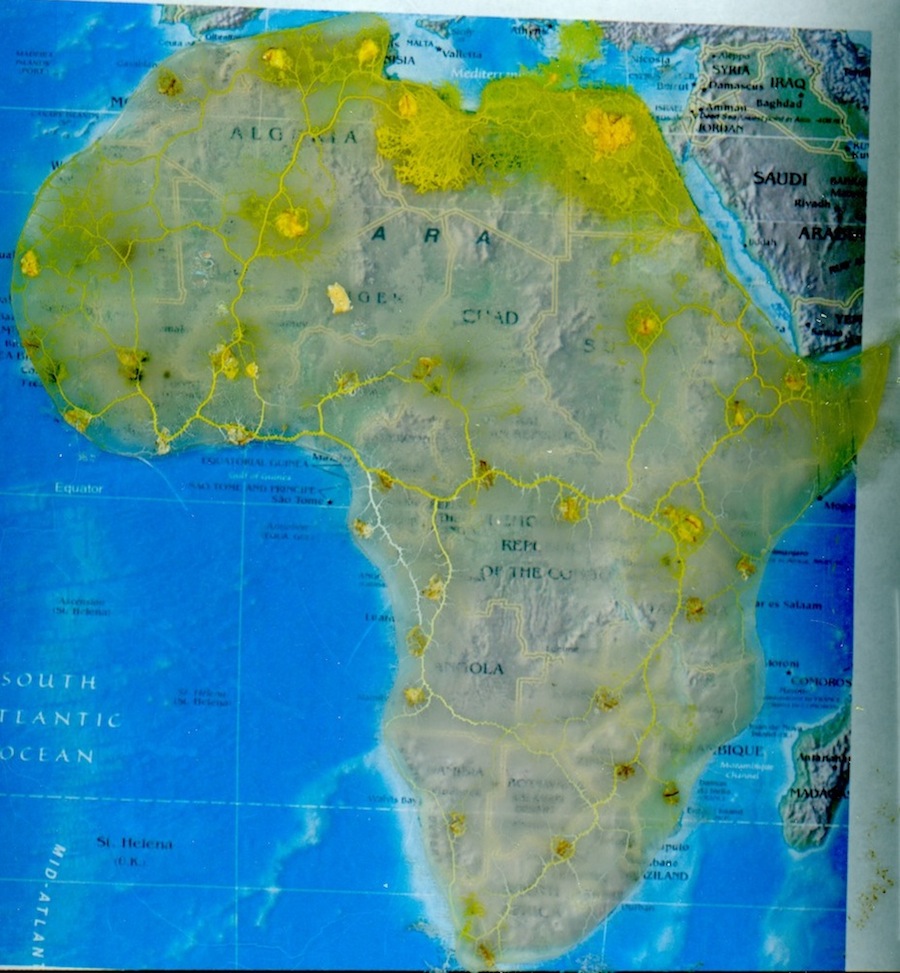
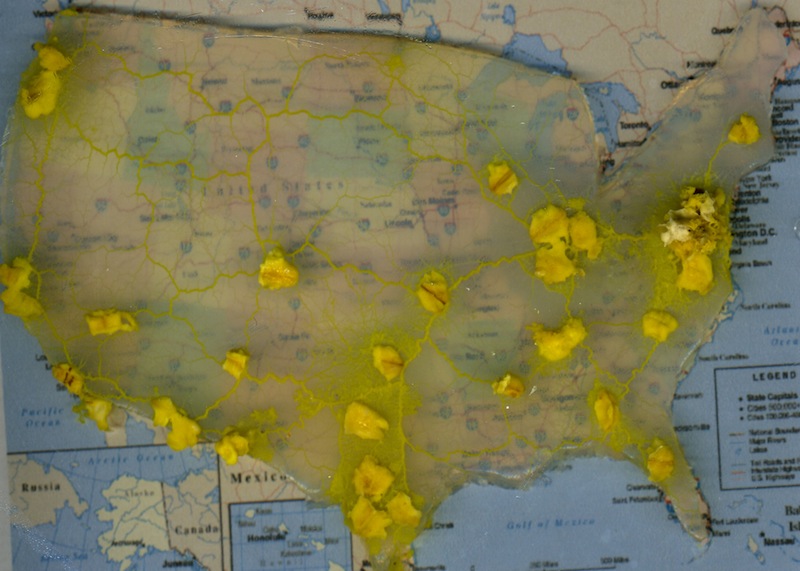
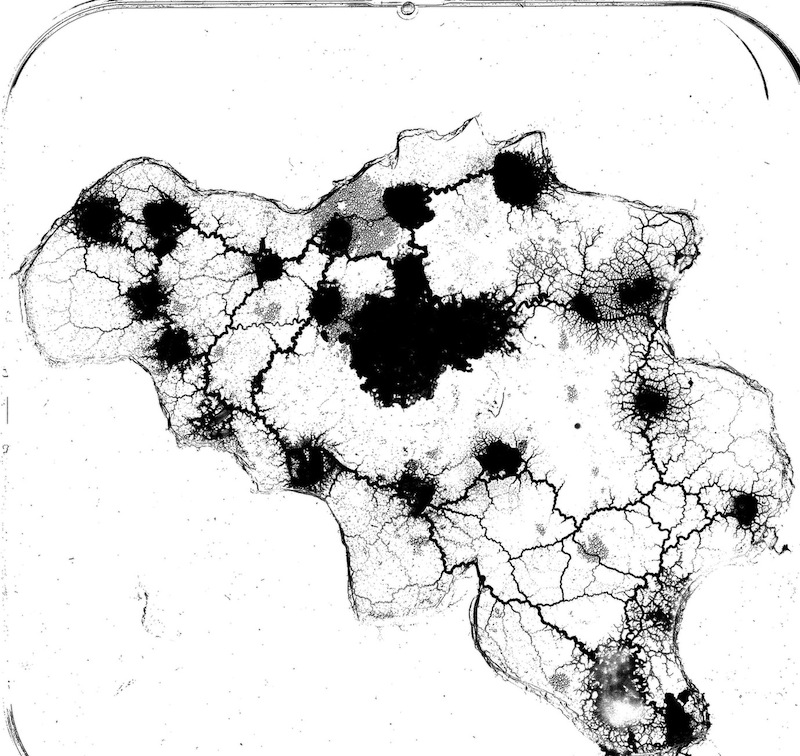
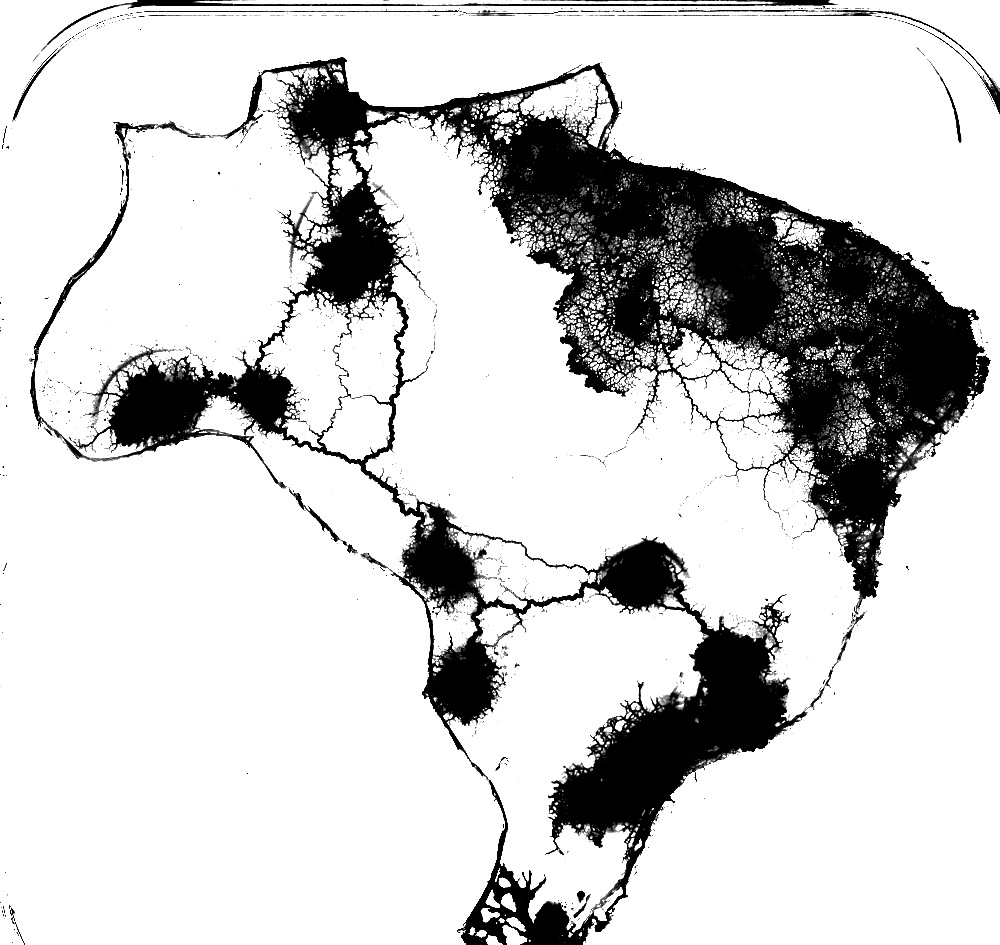
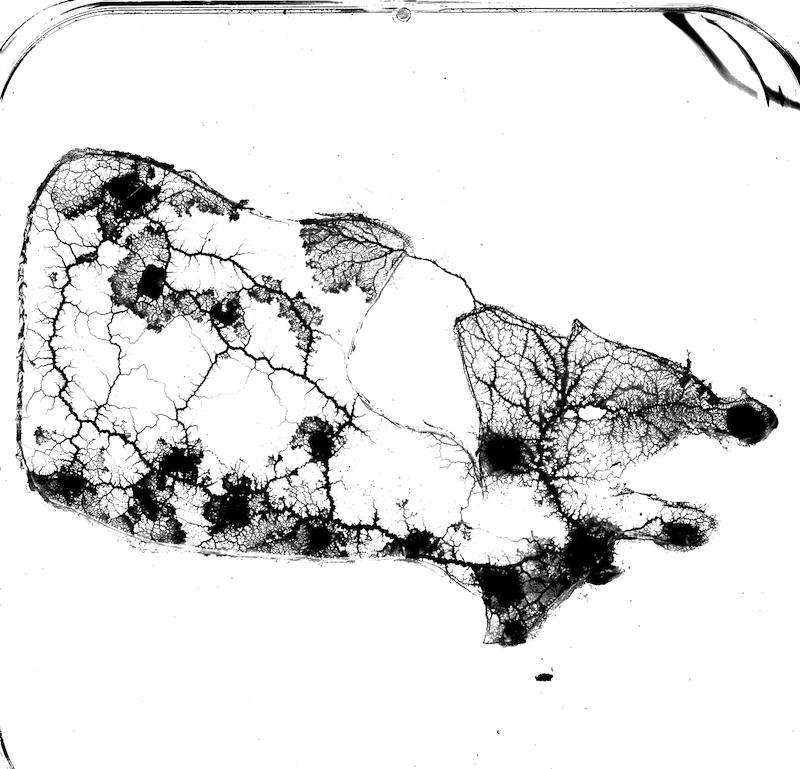
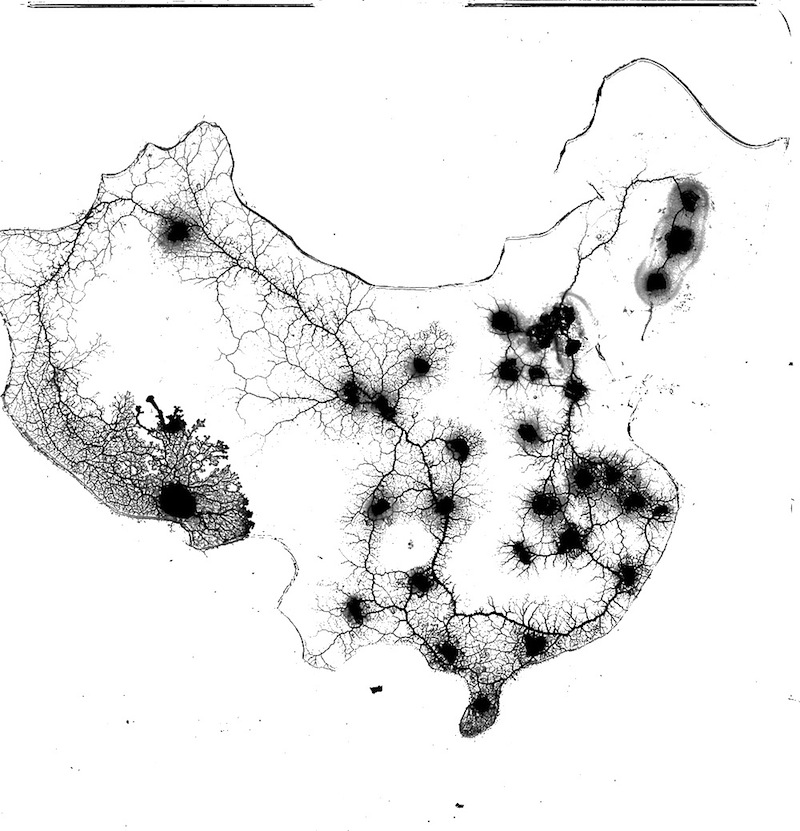
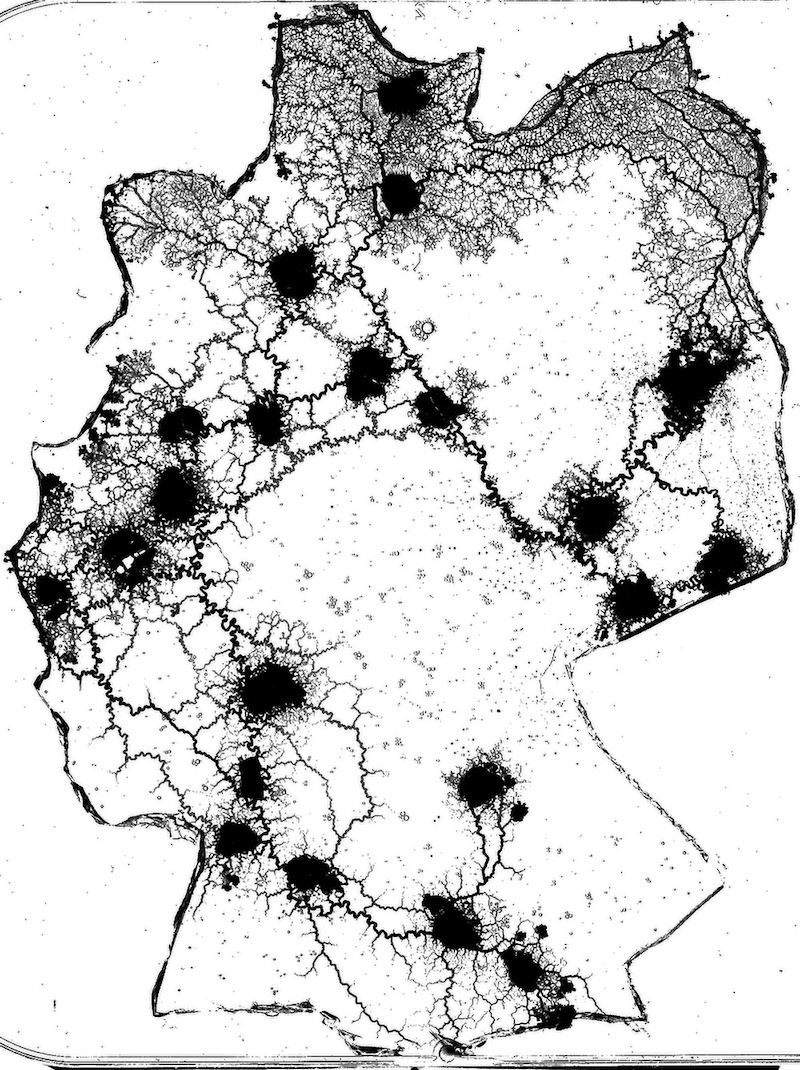
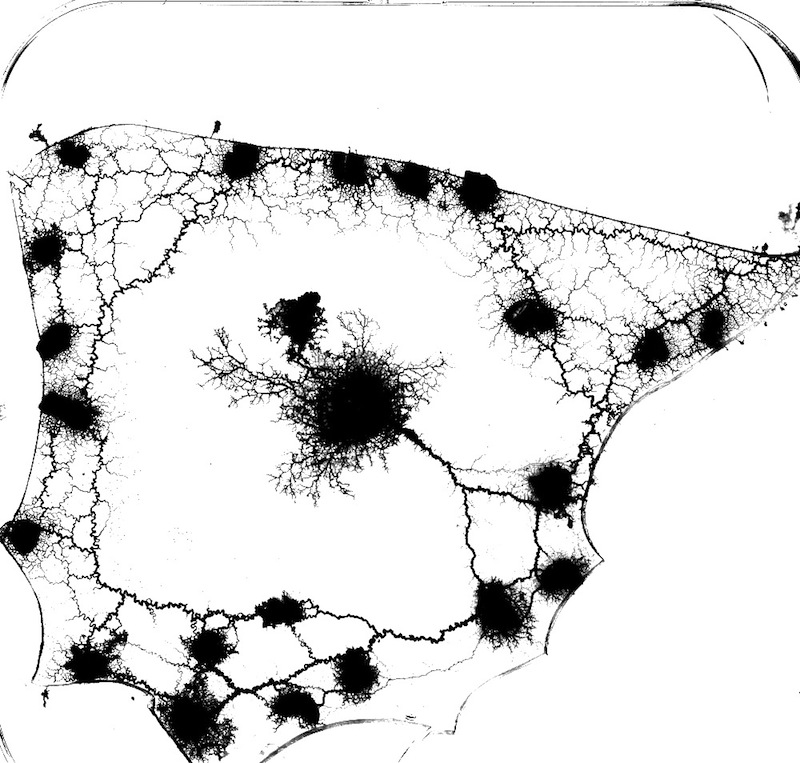
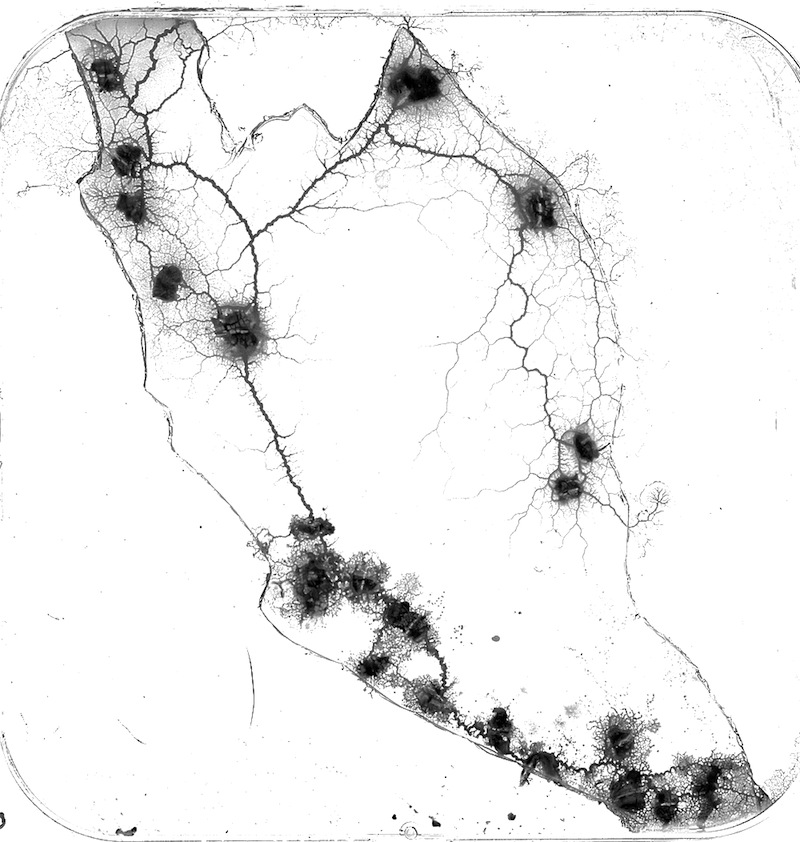
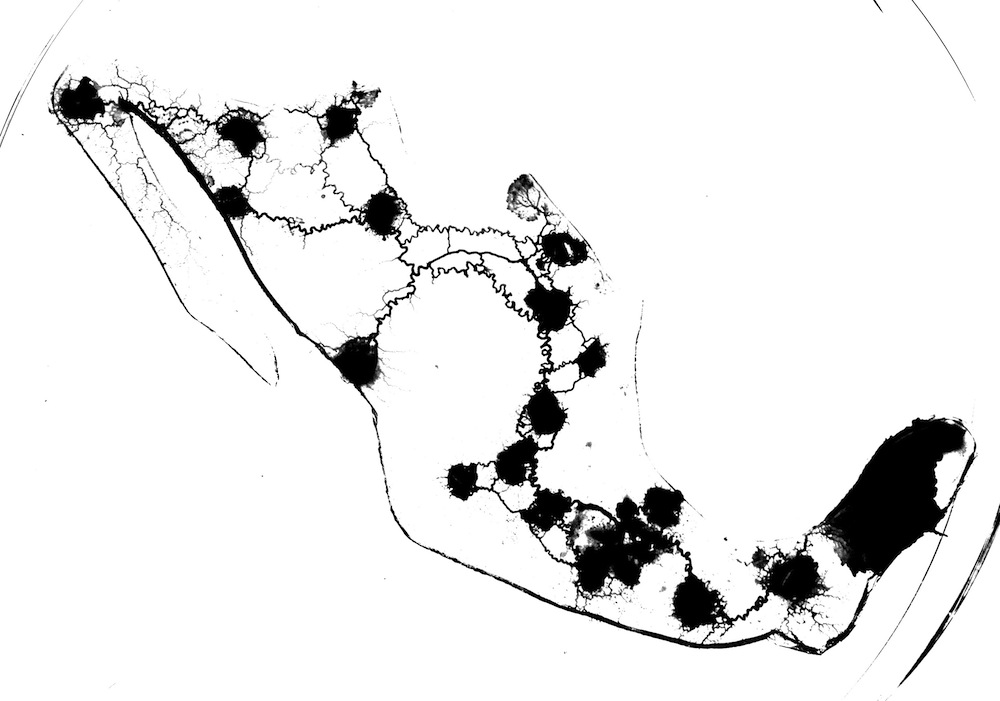
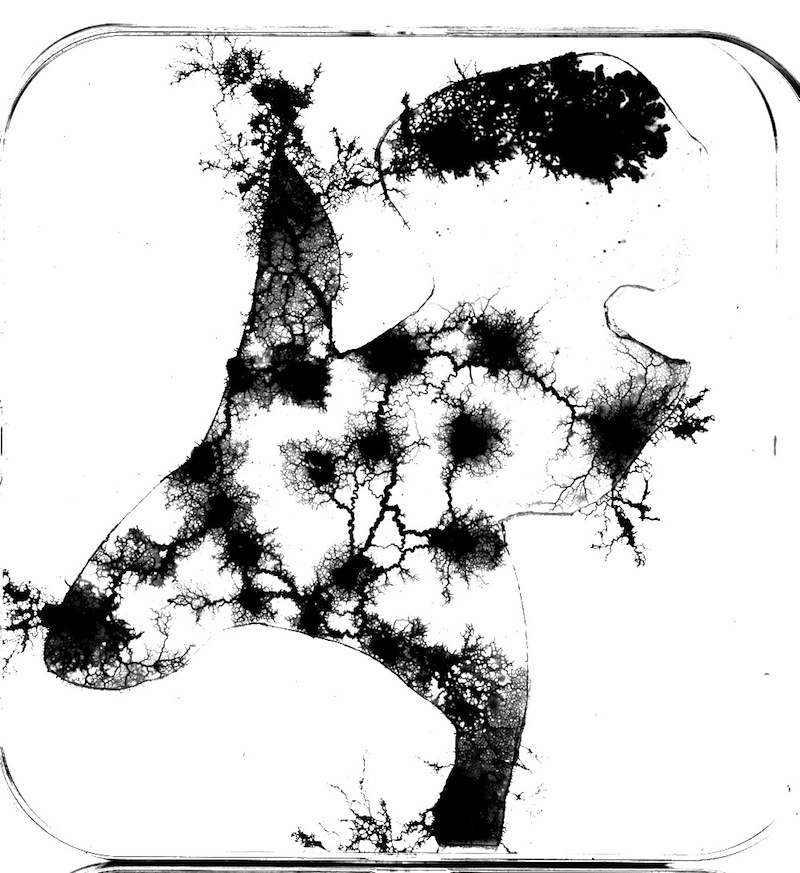
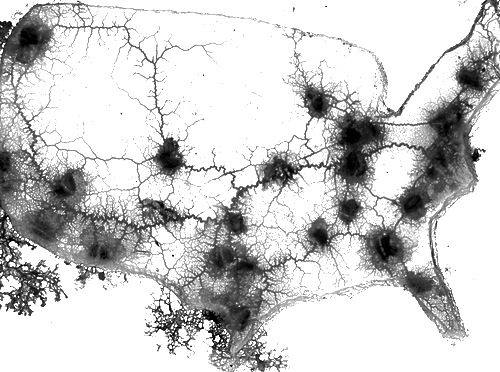
At the beginning of each experiment a piece of plasmodium, usually already attached to an oat flake, is placed in the capital city. The Petri dishes with plasmodium were kept in darkness, at temperature 22-25 C, except for observation and image recording (Fig. 1). Periodically (usually in 12 h or 24 h intervals) the dishes were scanned in Epson Perfection 4490. Examples of typical protoplasmic networks recorded in laboratory experiments are shown in Fig. 2. Detailed examples and scenarios of colonisation of various regions by the slime mould are provided in original papers [2]–[14],[51].
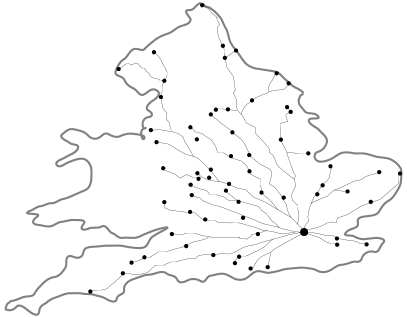
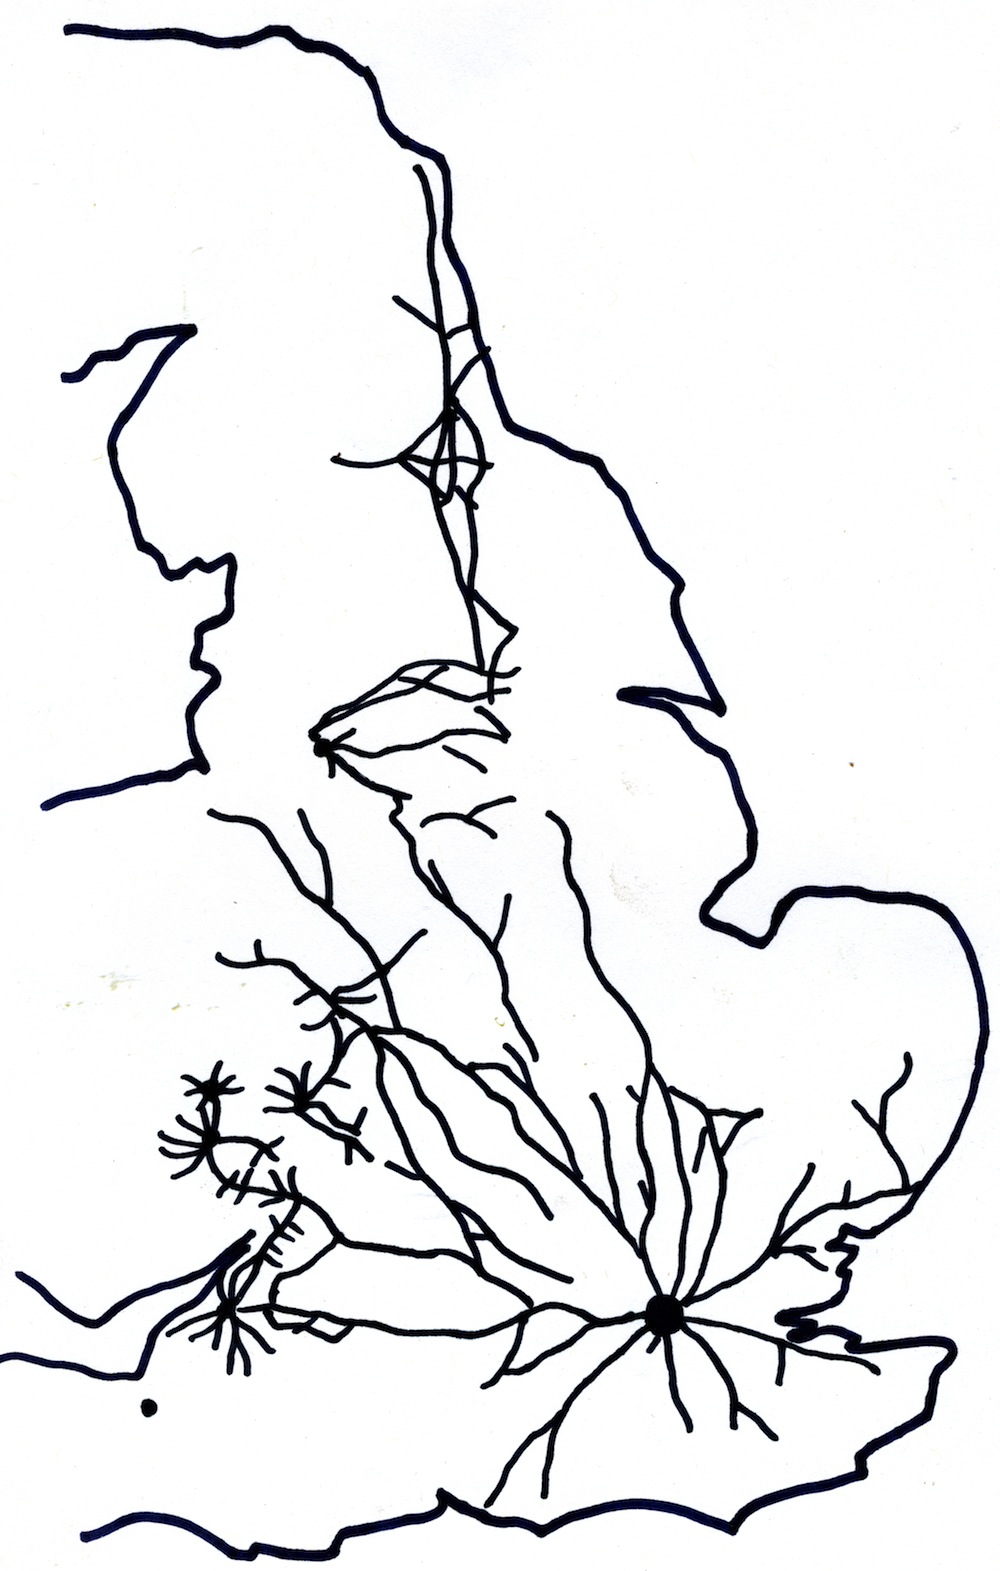
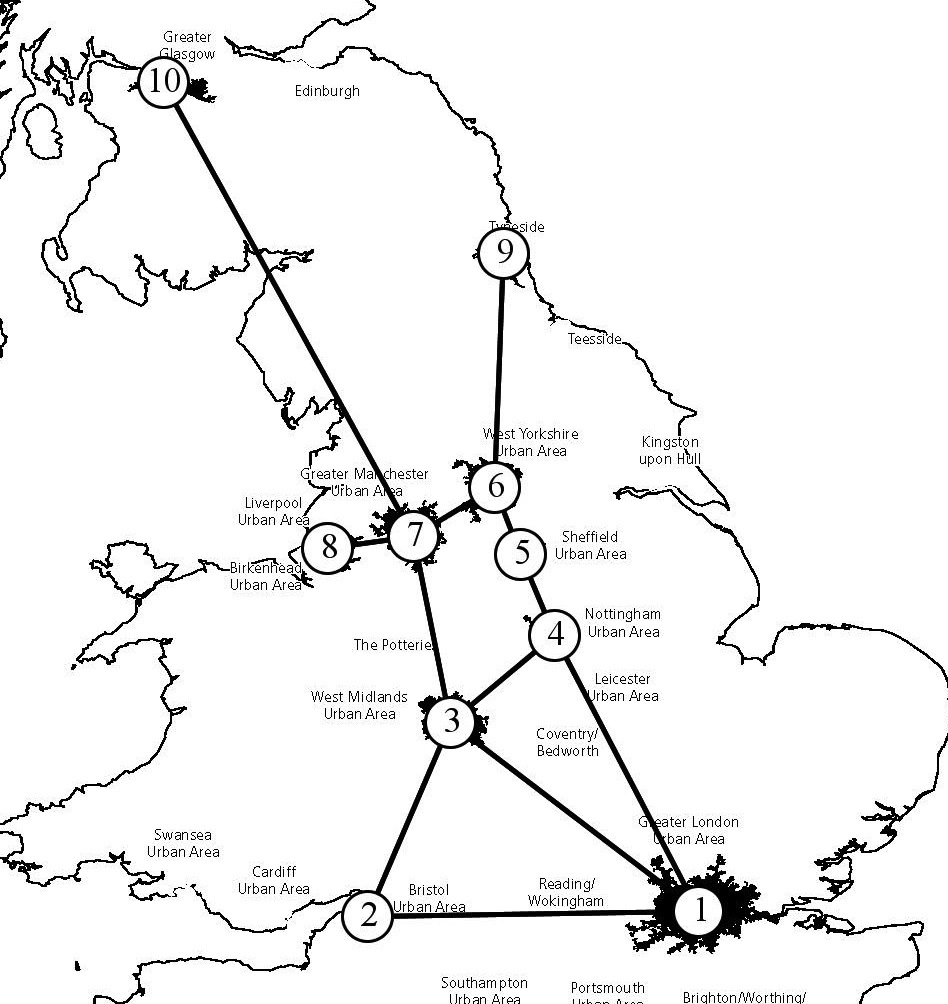
In our experiments we always inoculated plasmodium of P. polycephalum in a capital of any particular country. This is because in the majority of cases — but not in all cases indeed — capitals are the most populated and industrially developed urban areas, and the road ’diffusion’ in ancient times was usually originated from the capital city. For example, see a rough scheme of turnpikes in England (Fig. 3), which demonstrates a classical growth pattern, typical for fungi, myxomecetes and bacterial colonies. Moreover, we can even see evidence of secondary growth from other cities, e.g. in Fig. 3 we see the main turnpike network growing from London and several sub-networks growing from Bristol, Ross, Leominster, Worcester, and Manchester.
Unlike bacterial colonies and fungal mycelia, the Physarum plasmodium is able to shift the mass of its body plan by the adaptive assembly and disassembly of its protoplasmic tube network and utilise the transport of structural components within the network to the leading edge of growth. The morphology of the plasmodium is thus less dependent on the initial inoculation site and the active zone of growth can move throughout the environment as the plasmodium forages for food.
Also, from our previous experimental studies we know that when plasmodium is inoculated in every point of a given planar set, the protoplasmic network formed approximates the Delaunay triangulation of the set [1, 48]. Neither of the motorway networks considered match the Delaunay triangulation of major urban areas, thus simultaneous inoculation in all urban areas would not bring any additional benefits.
As with every living creature, the plasmodium of P. polycephalum does not always repeat its foraging pattern. To generalise our experimental results we constructed a Physarum graph with weighted-edges. A Physarum graph is a tuple , where is a set of urban areas, is a set edges, and associates each edge of with a frequency (or weight) of the edge occurrence in laboratory experiments. For every two regions and from there is an edge connecting and if a plasmodium’s protoplasmic link is recorded at least in one of experiments, and the edge has a weight calculated as a ratio of experiments where protoplasmic link occurred in the total number of experiments . We do not take into account the exact configuration of the protoplasmic tubes but merely their existence. In original papers [2]–[14],[51] we dealt with threshold Physarum graphs . The threshold Physarum graph is obtained from the Physarum graph by the transformation: . That is, all edges with weights less than or equal to are removed. With the increase of in a family of threshold Physarum graphs the graphs undergo the following transitions (see country-specific details in [2]–[14],[51]):
non-planar connected planar connected disconnected all nodes are isolated
.
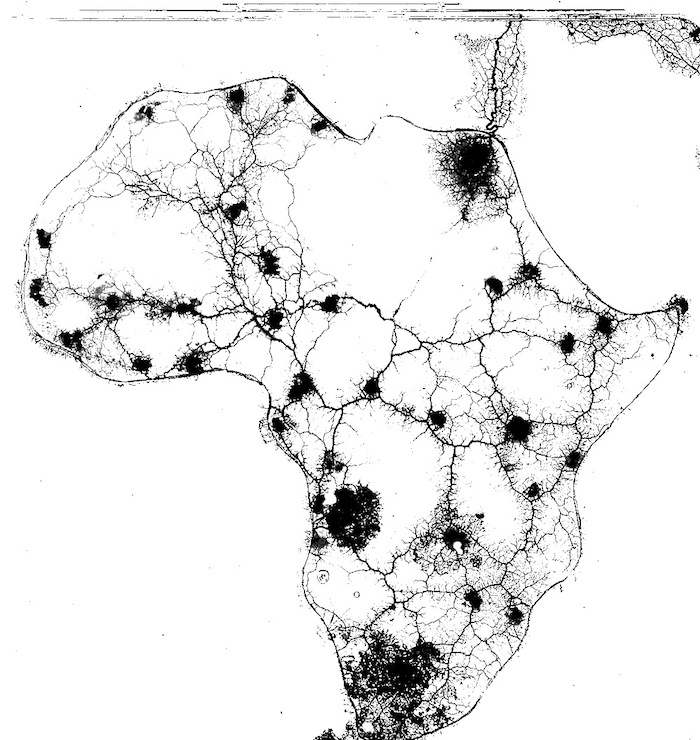
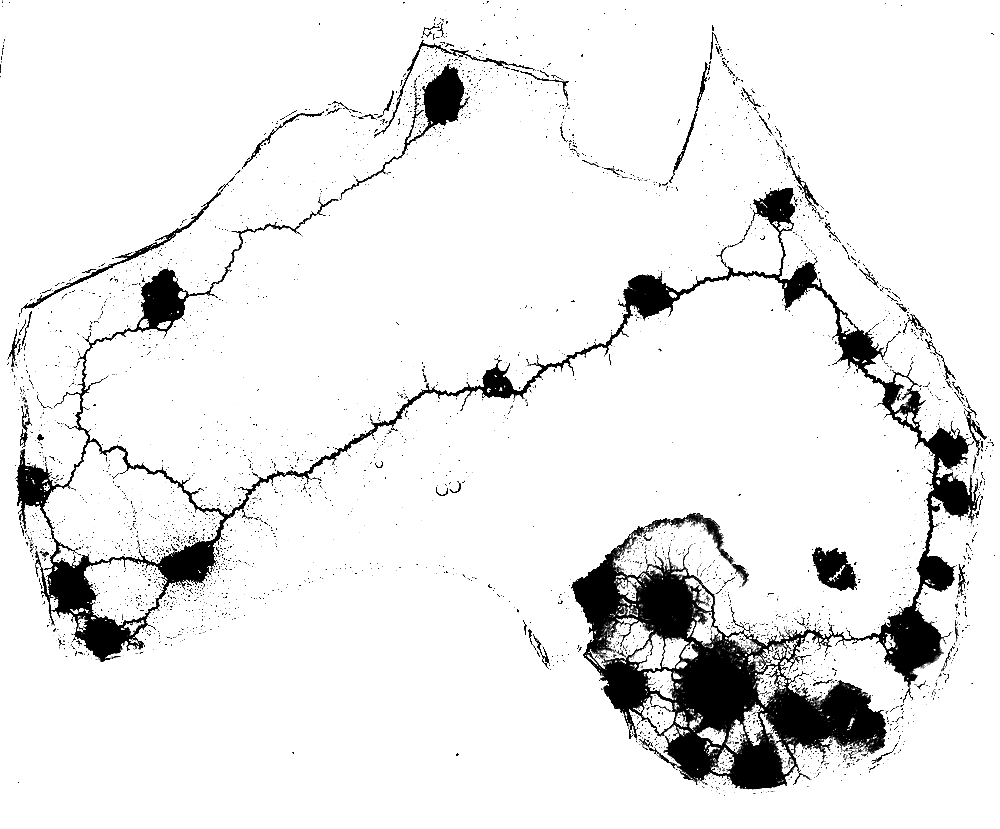
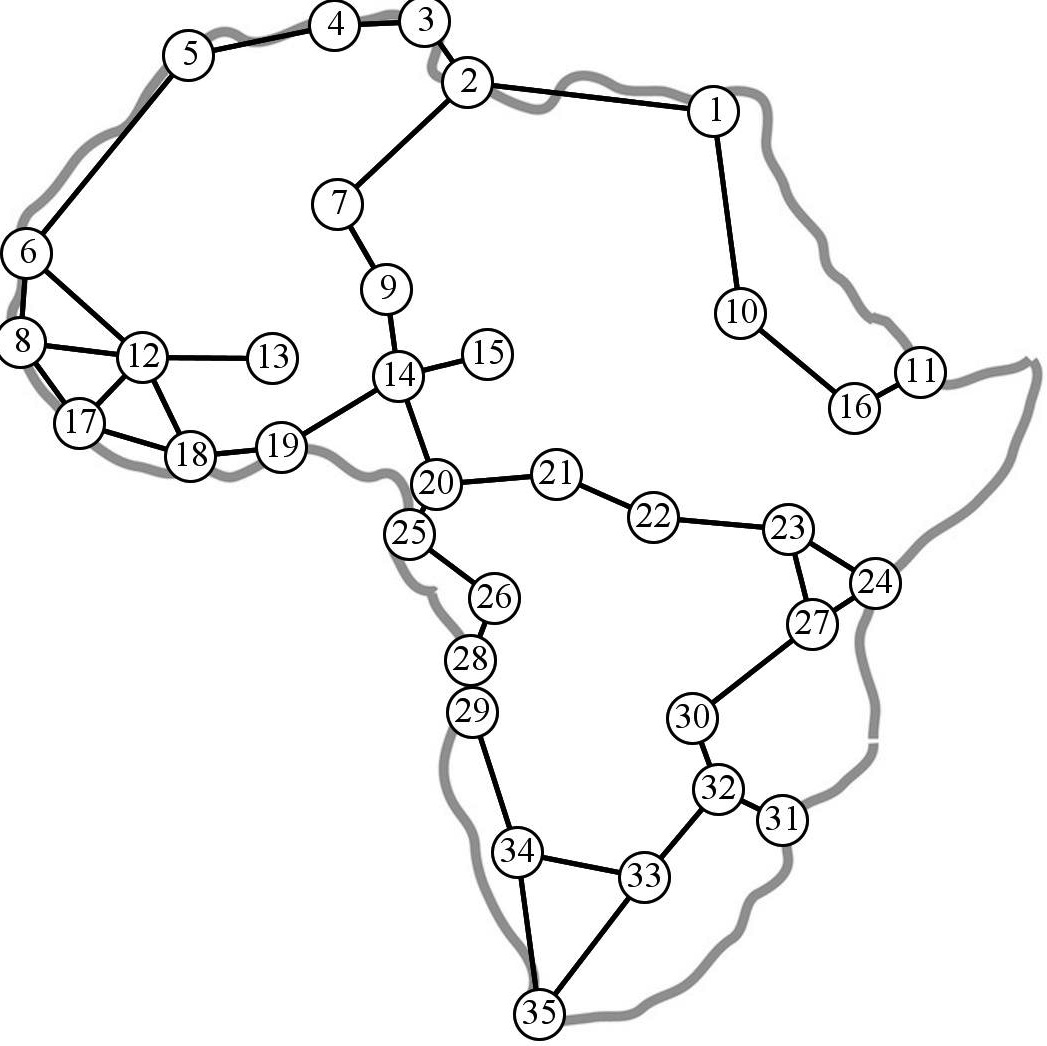
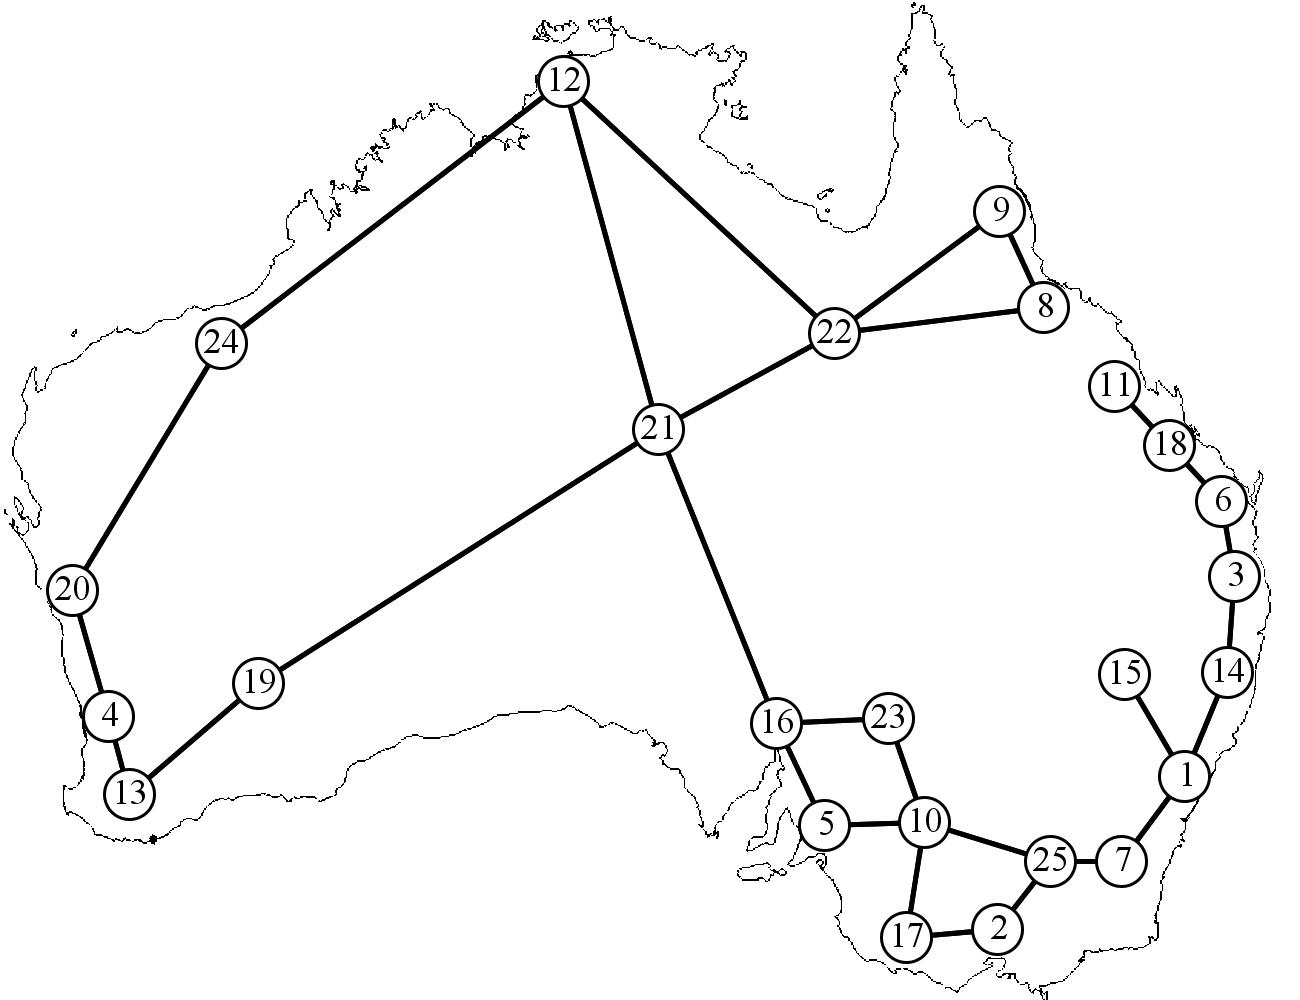
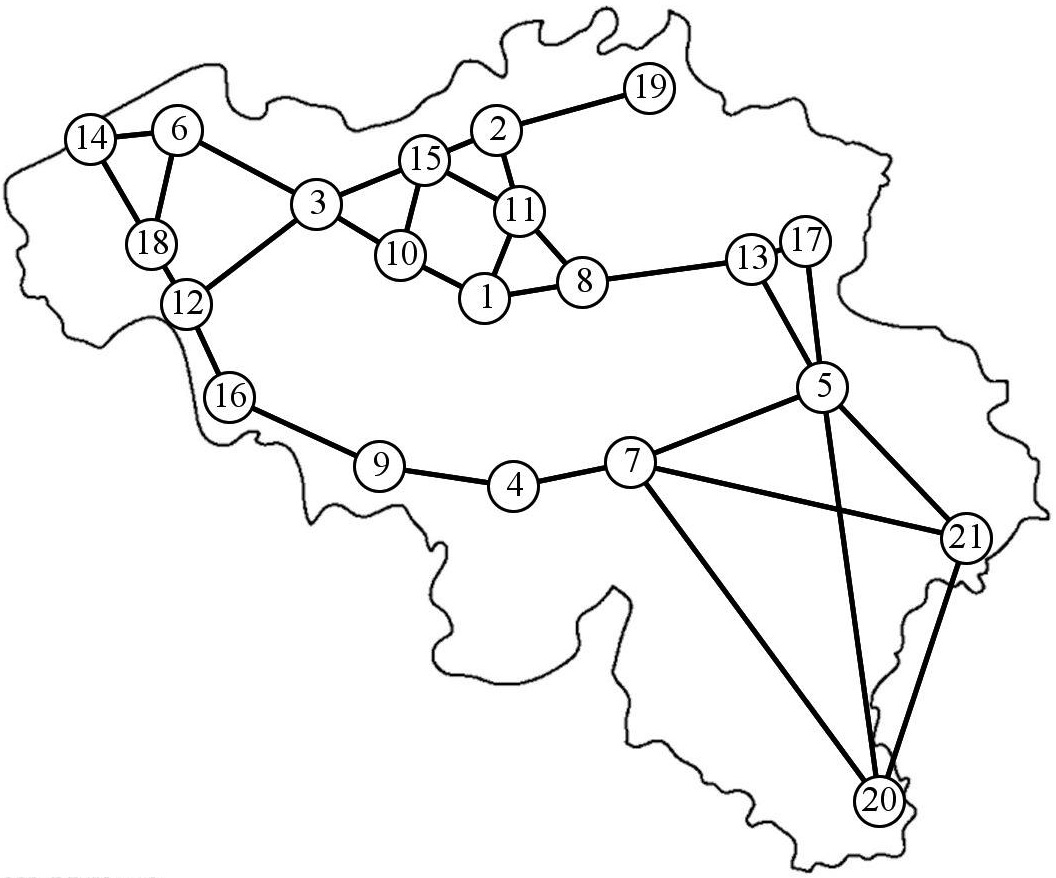
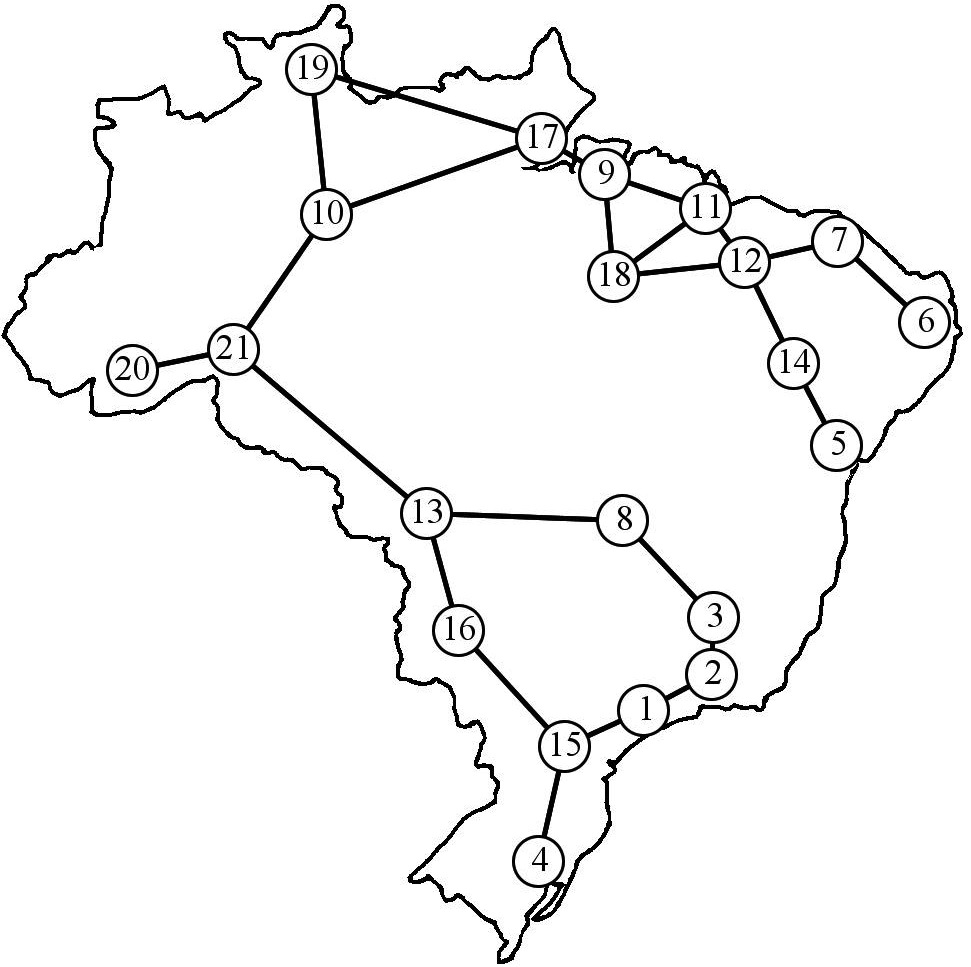
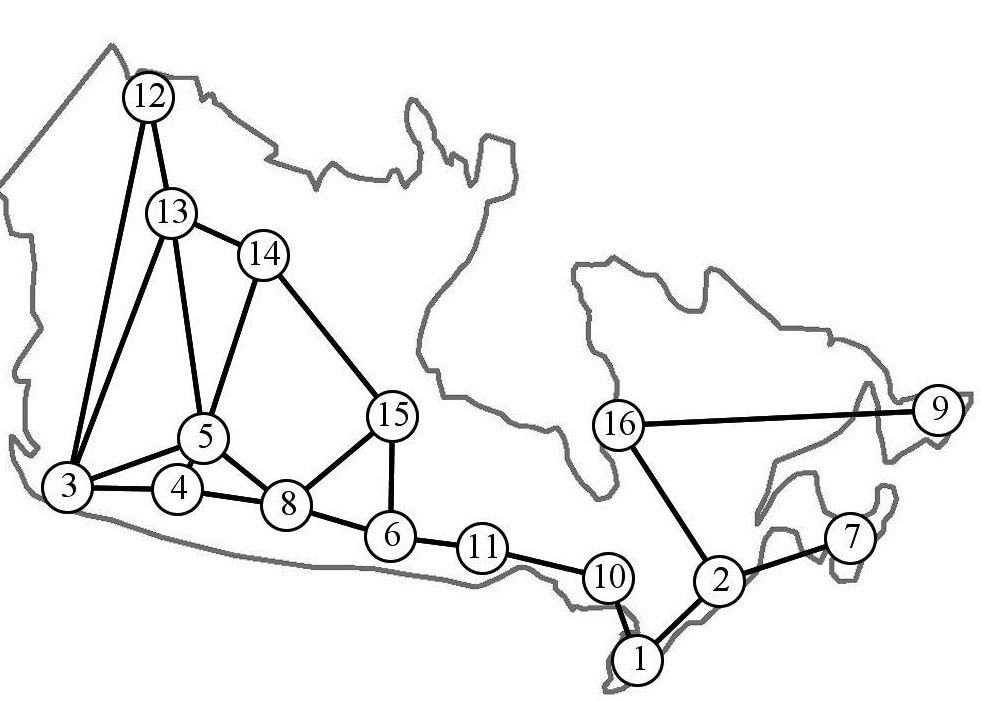
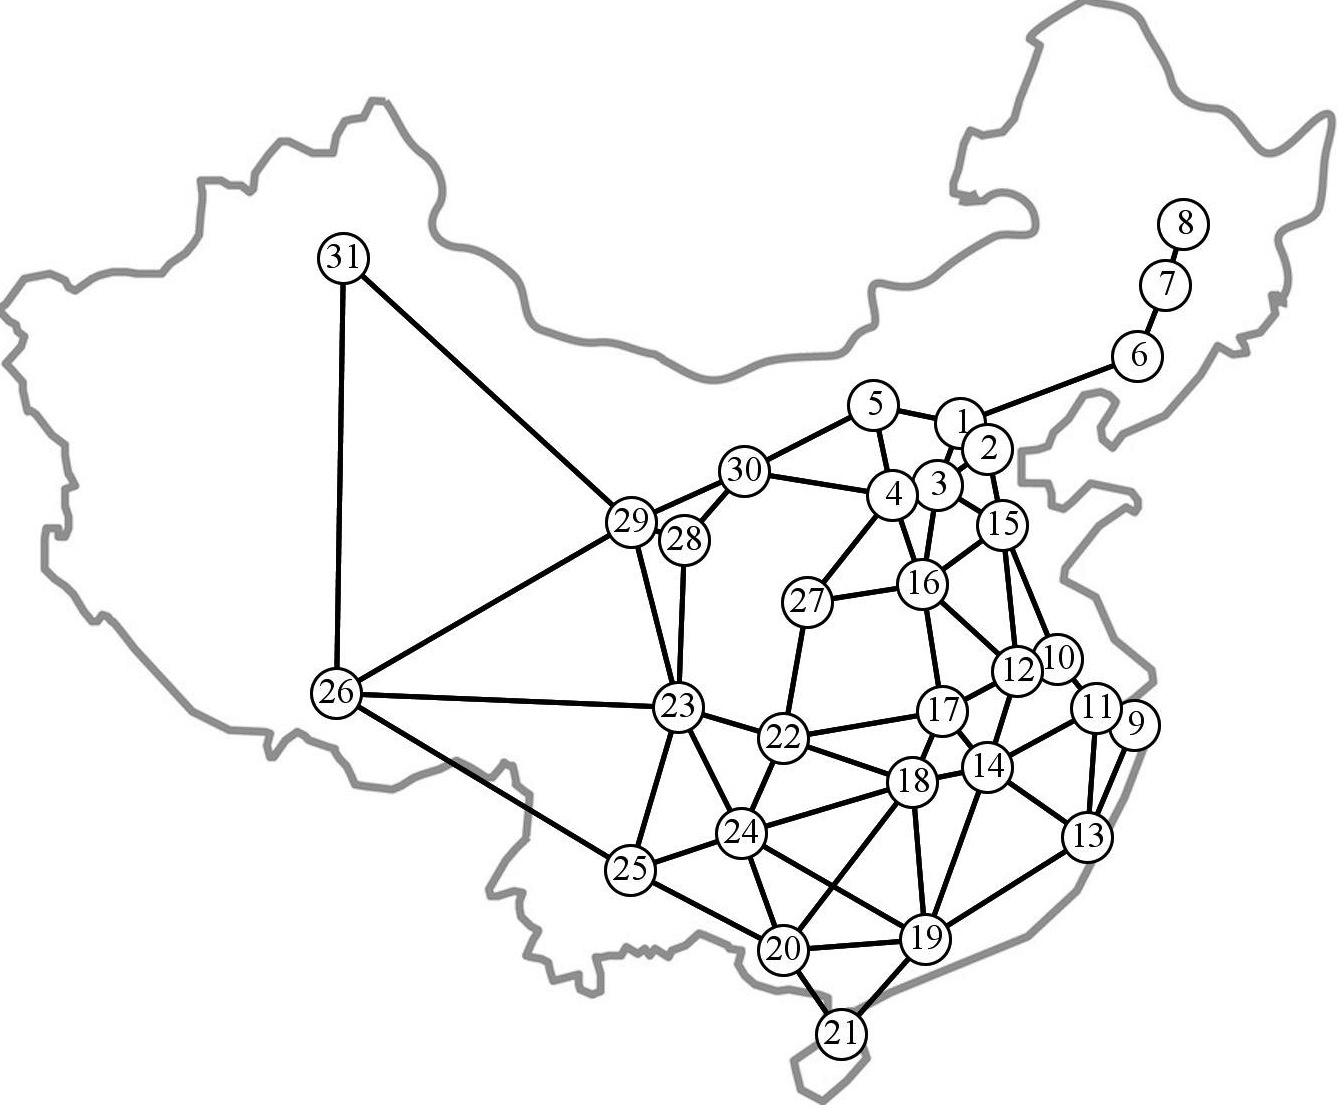
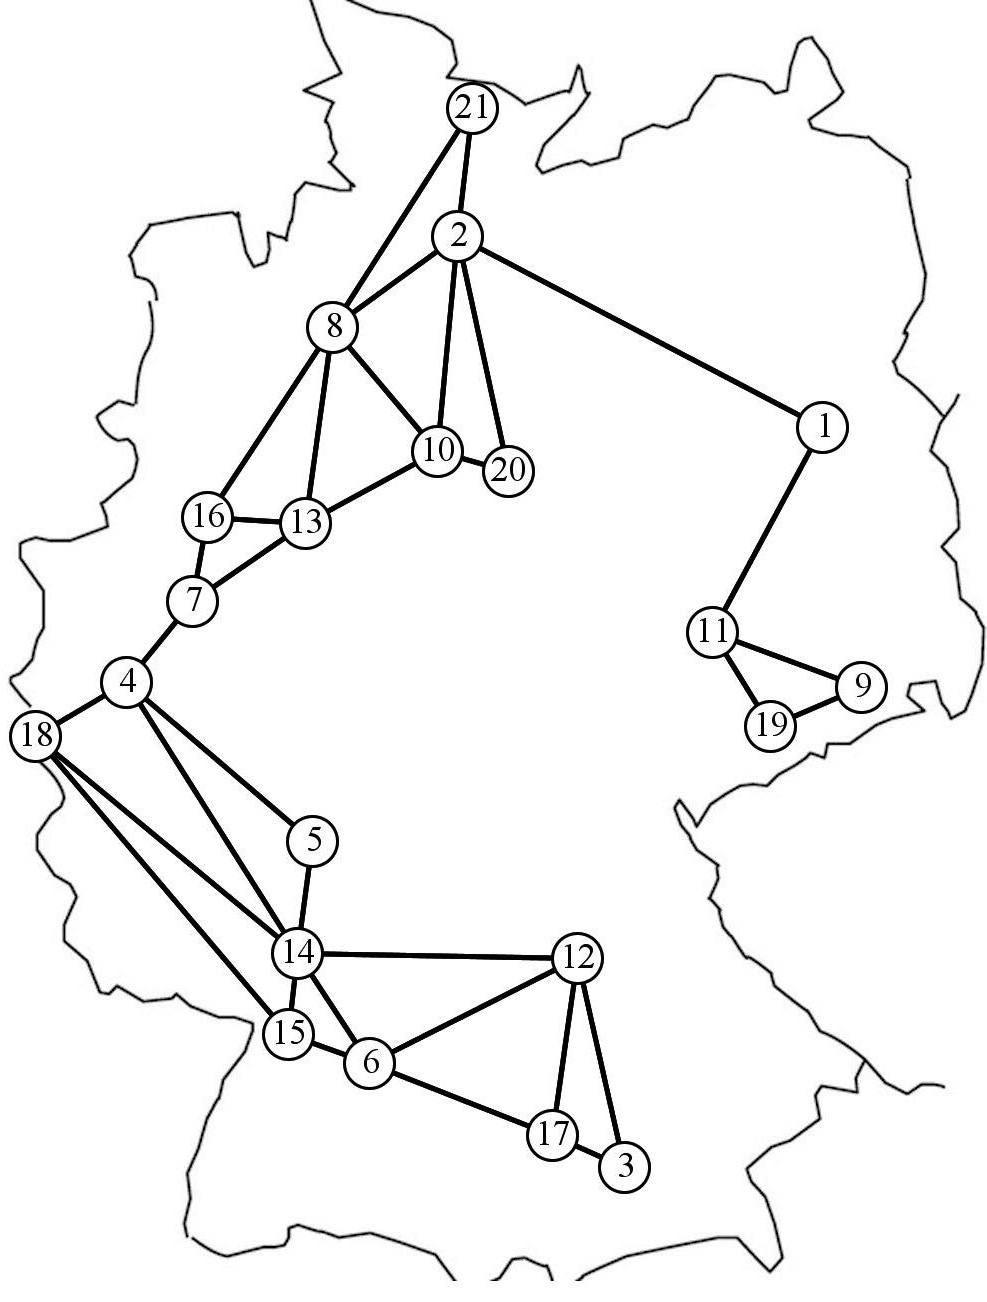
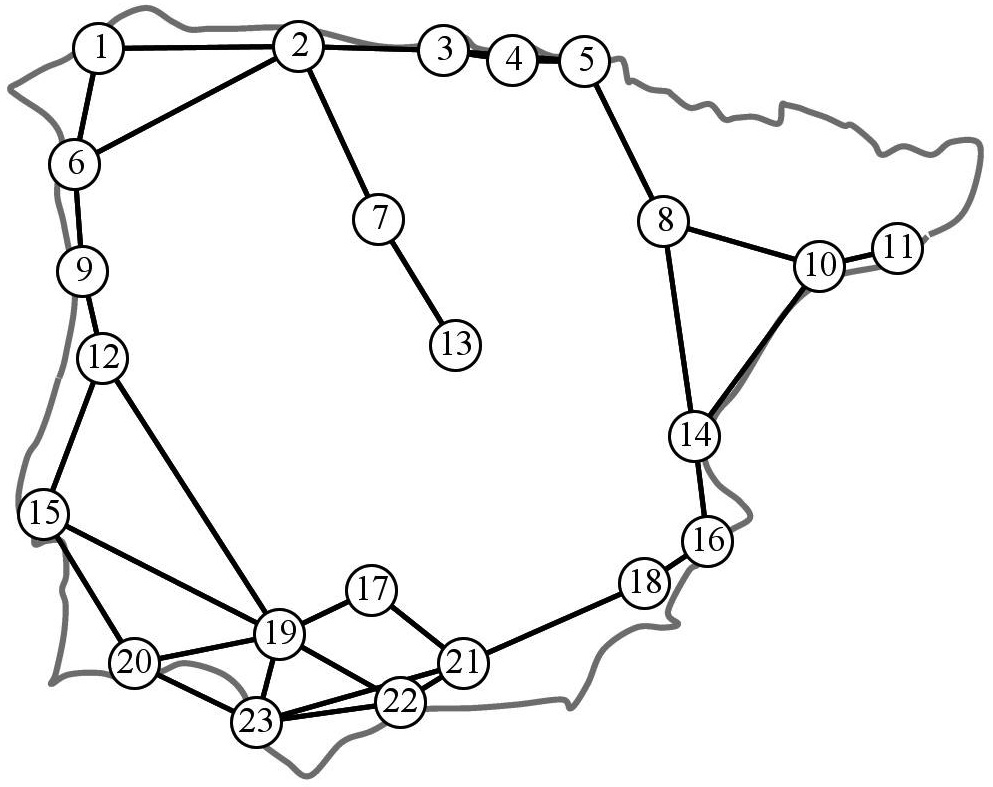
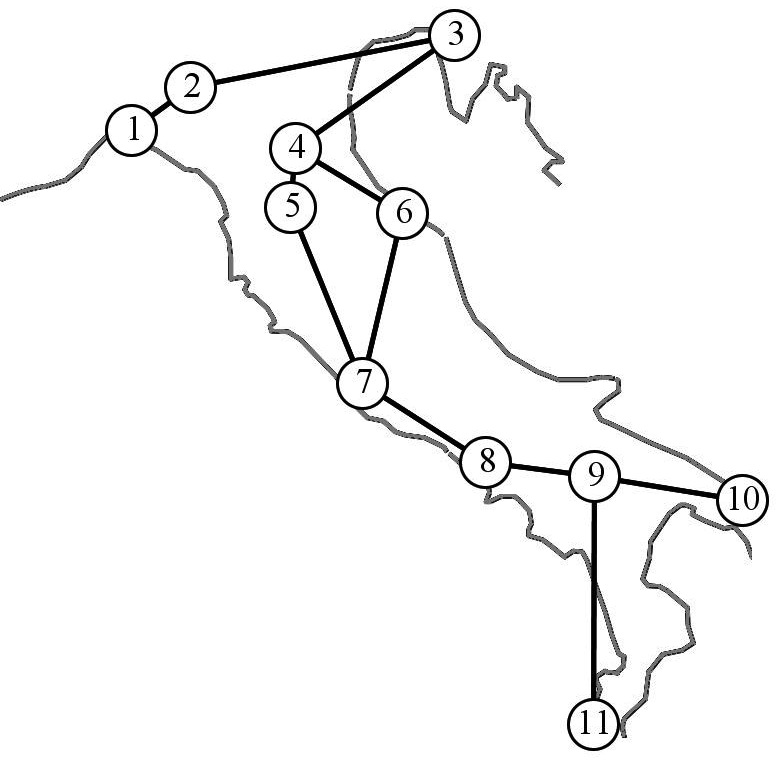
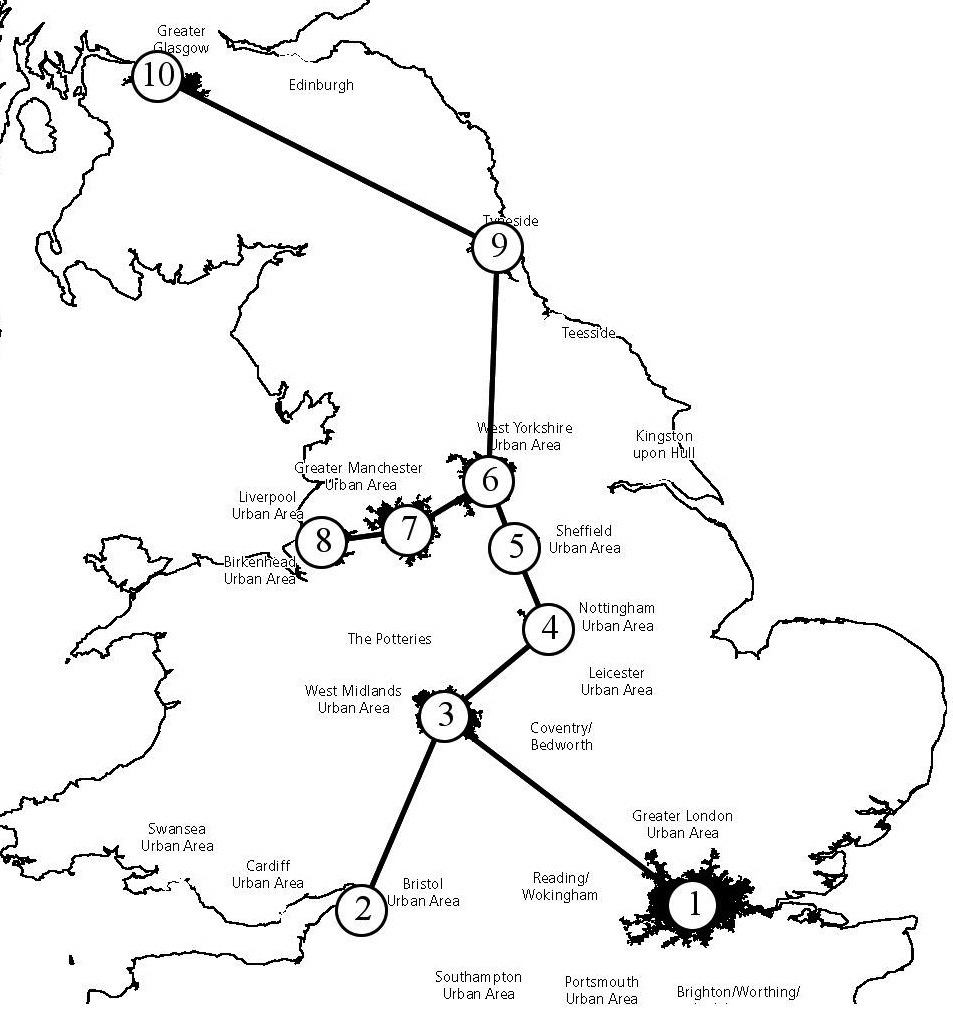
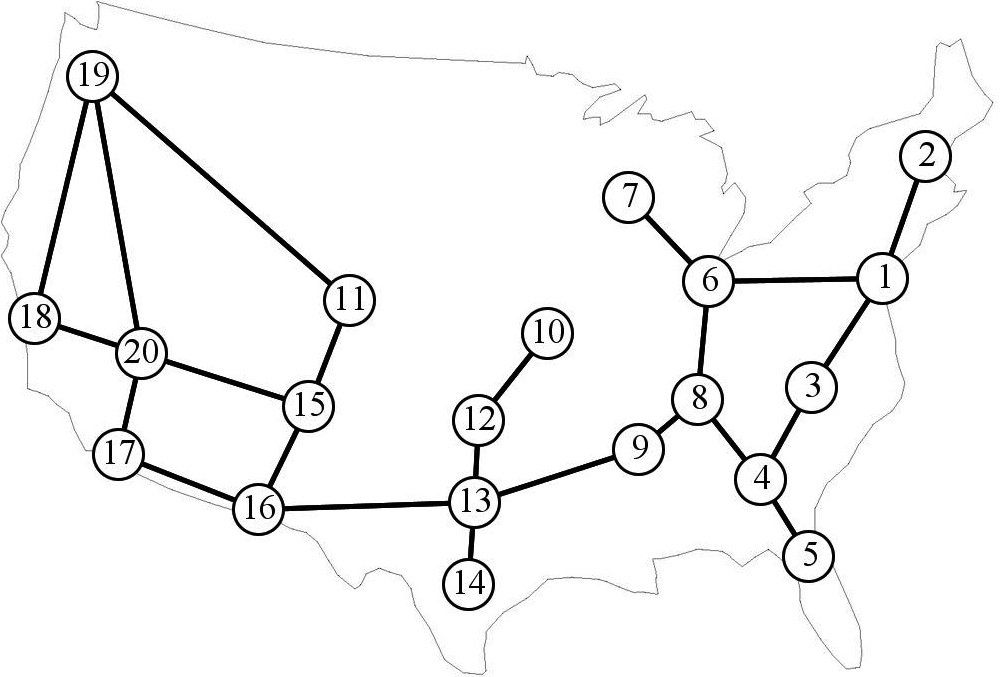
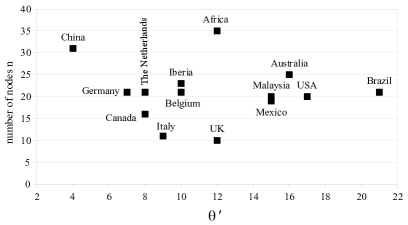
In the present paper we consider only ’stressed’ Physarum graphs , which have maximum possible values and yet remain connected: . These Physarum graphs are shown in Fig. 4. Values of for studied regions are illustrated in Fig. 6(a).
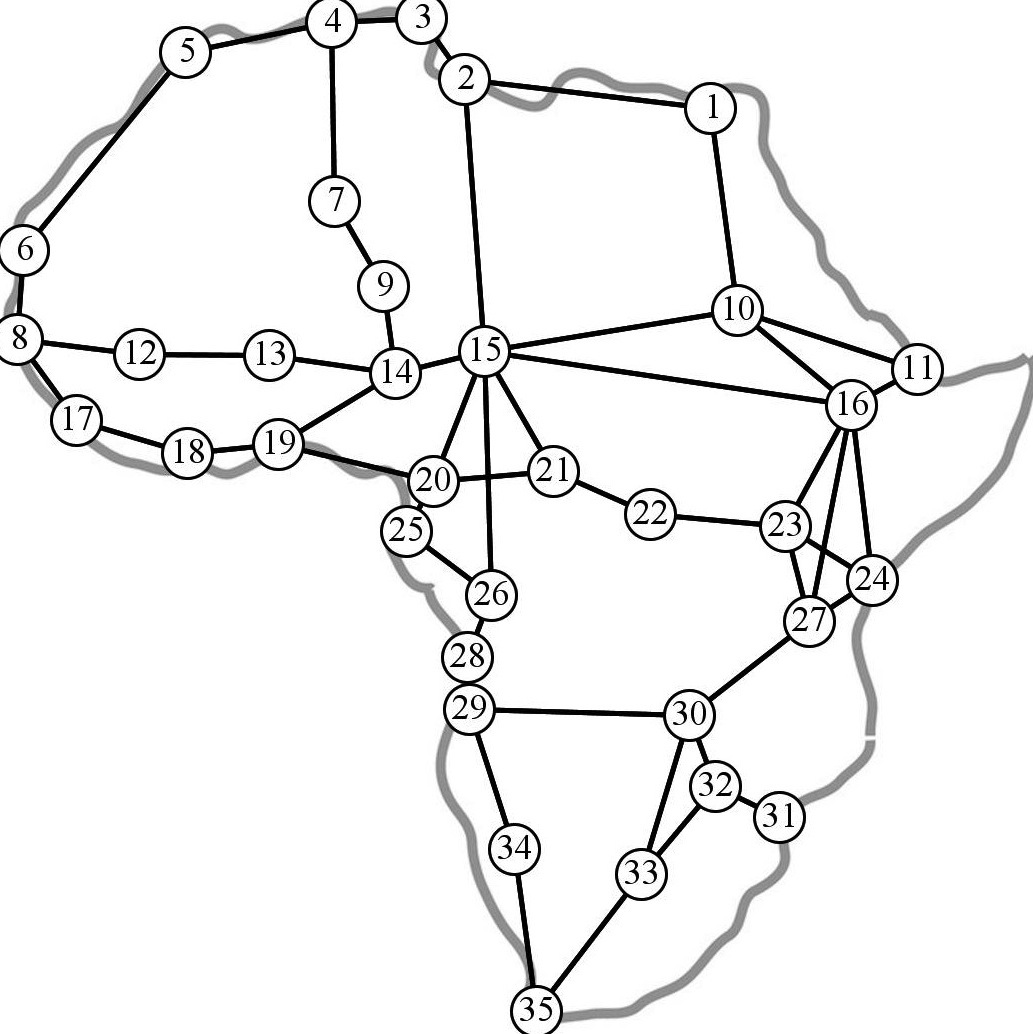
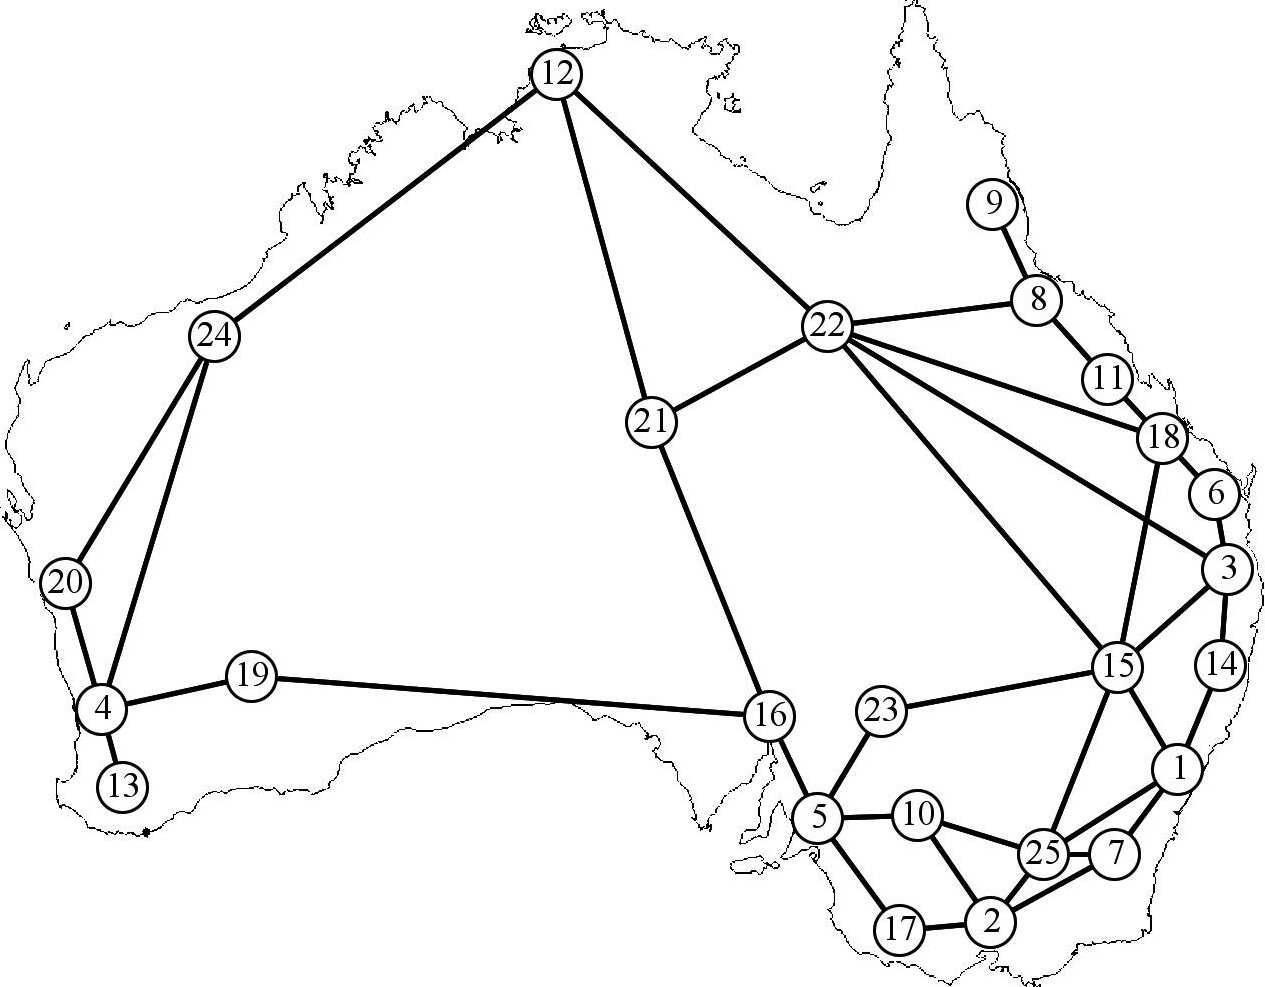
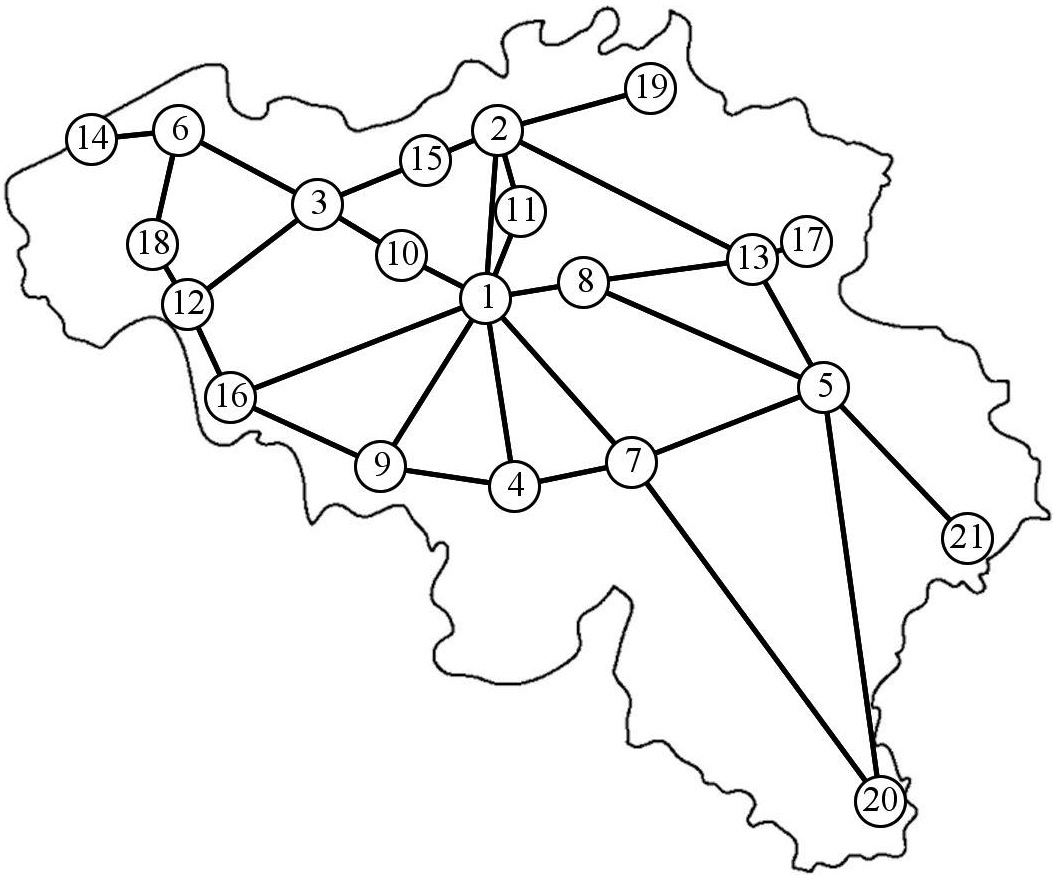
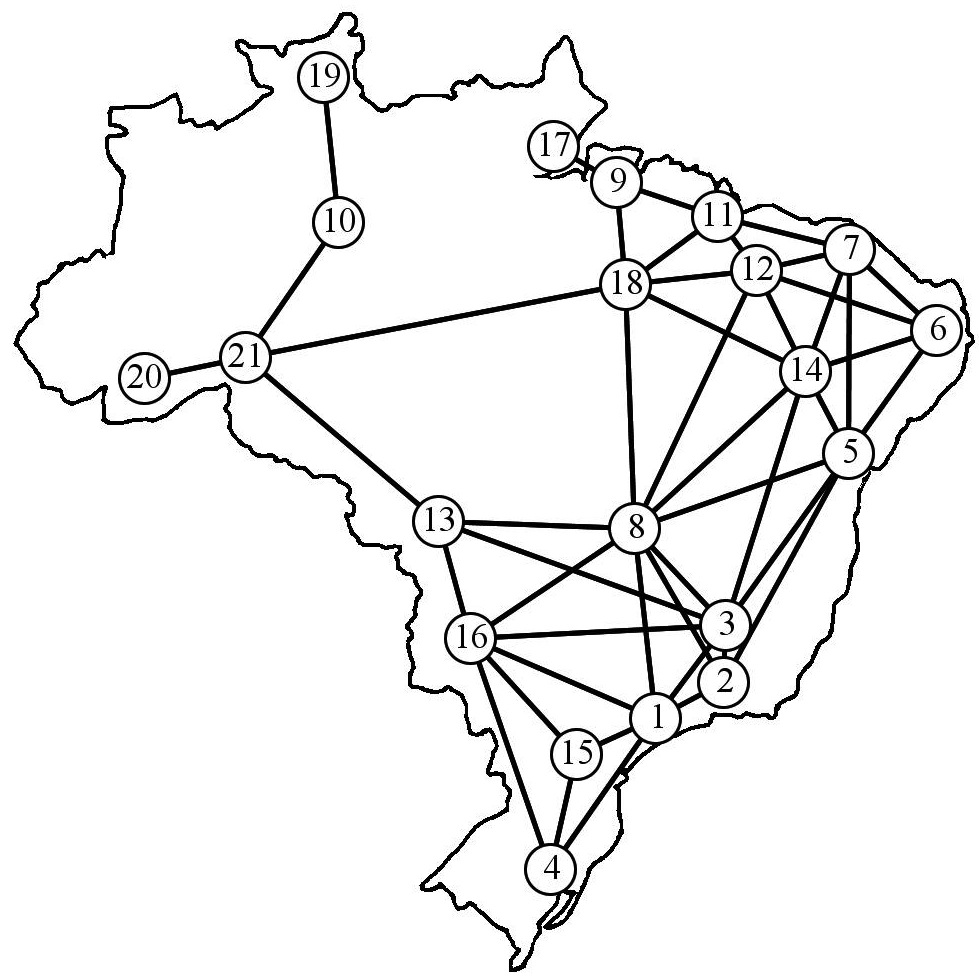
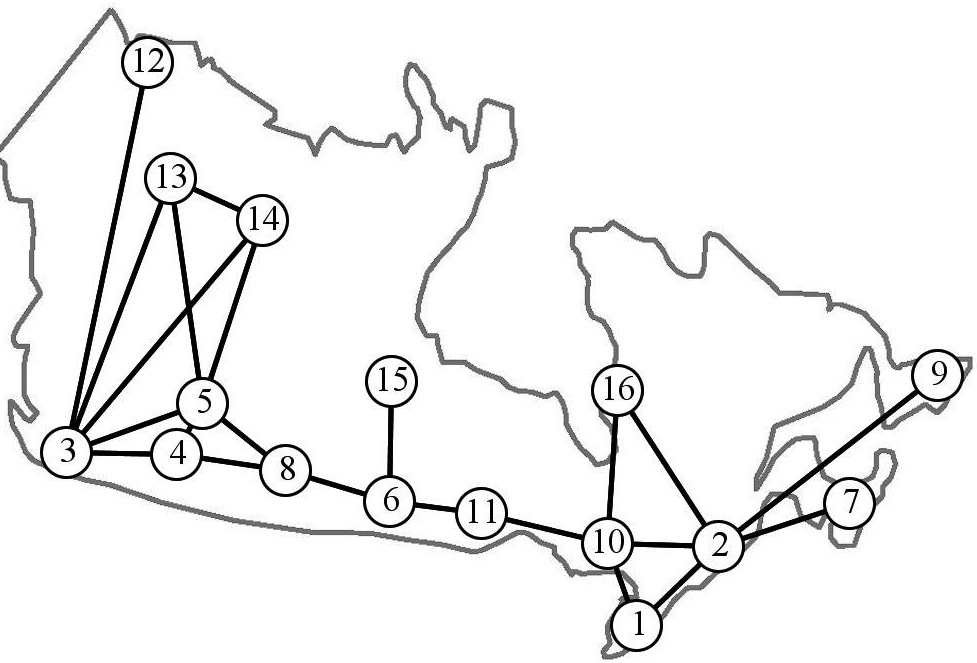
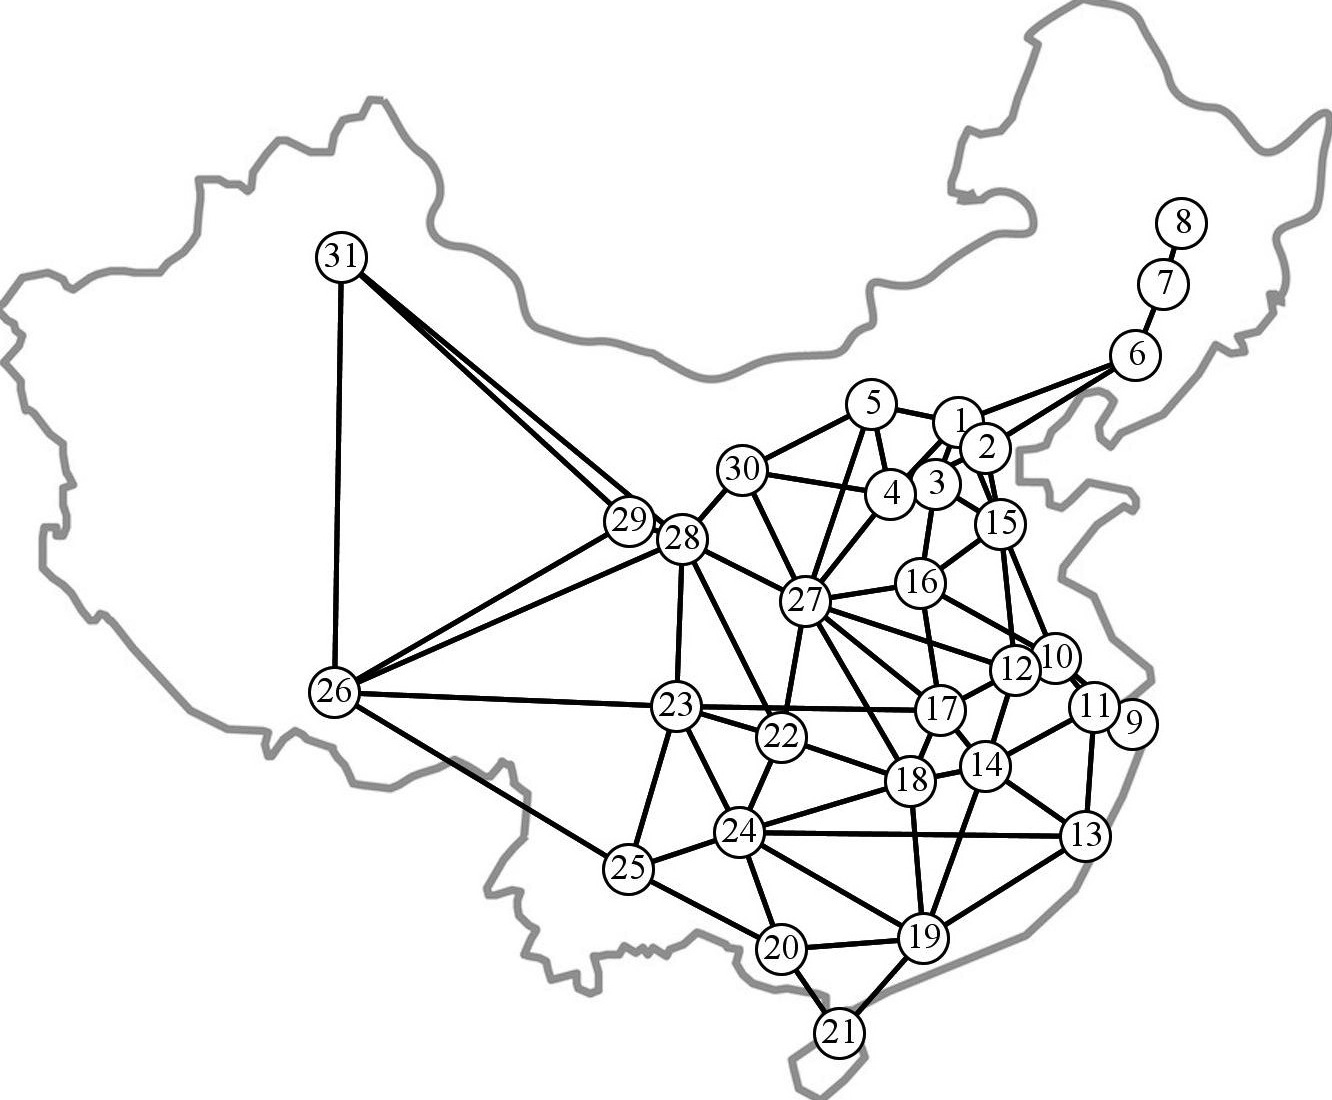
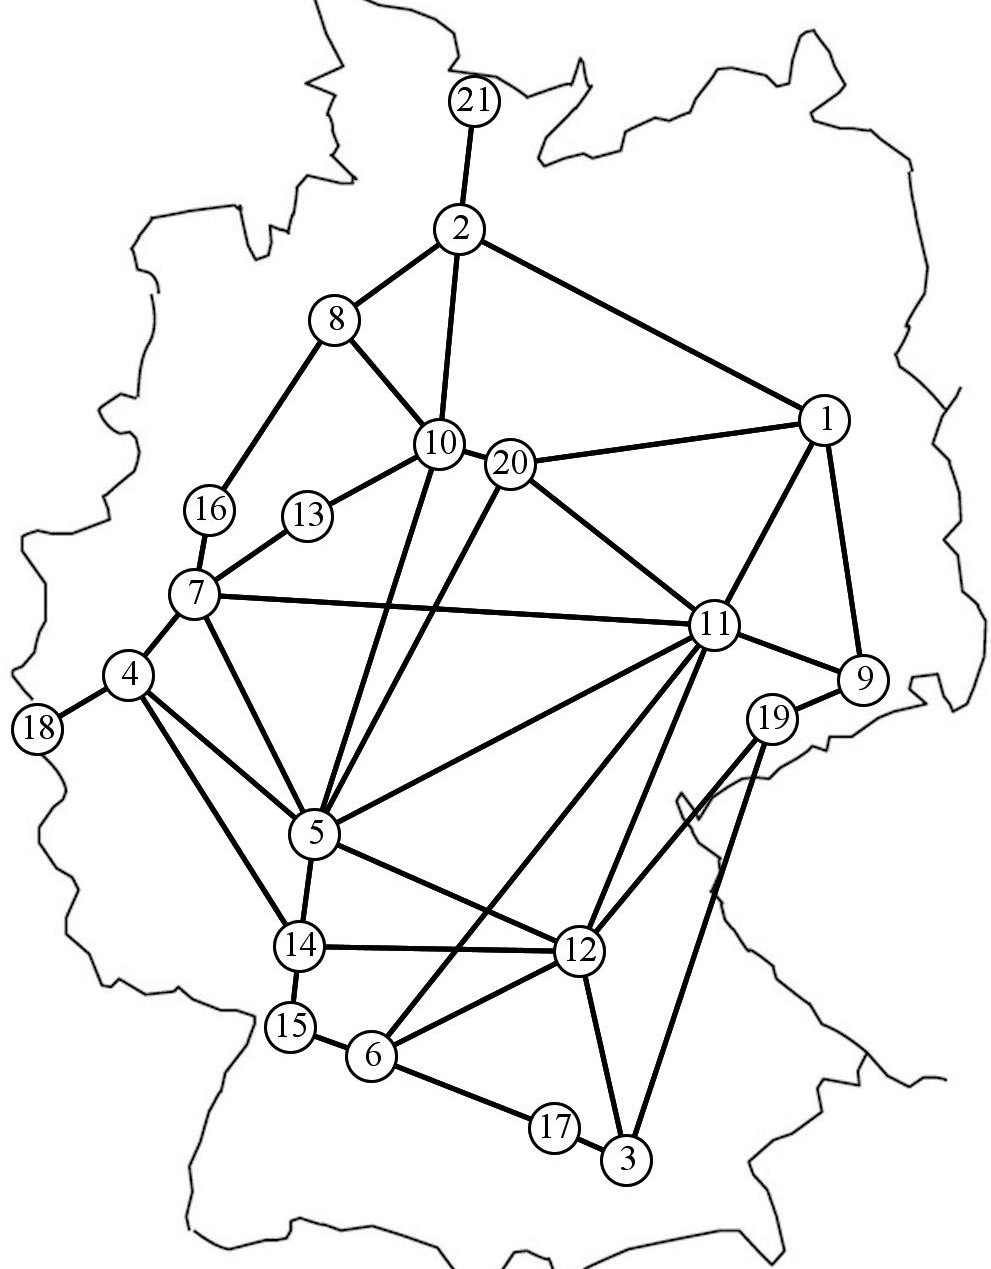
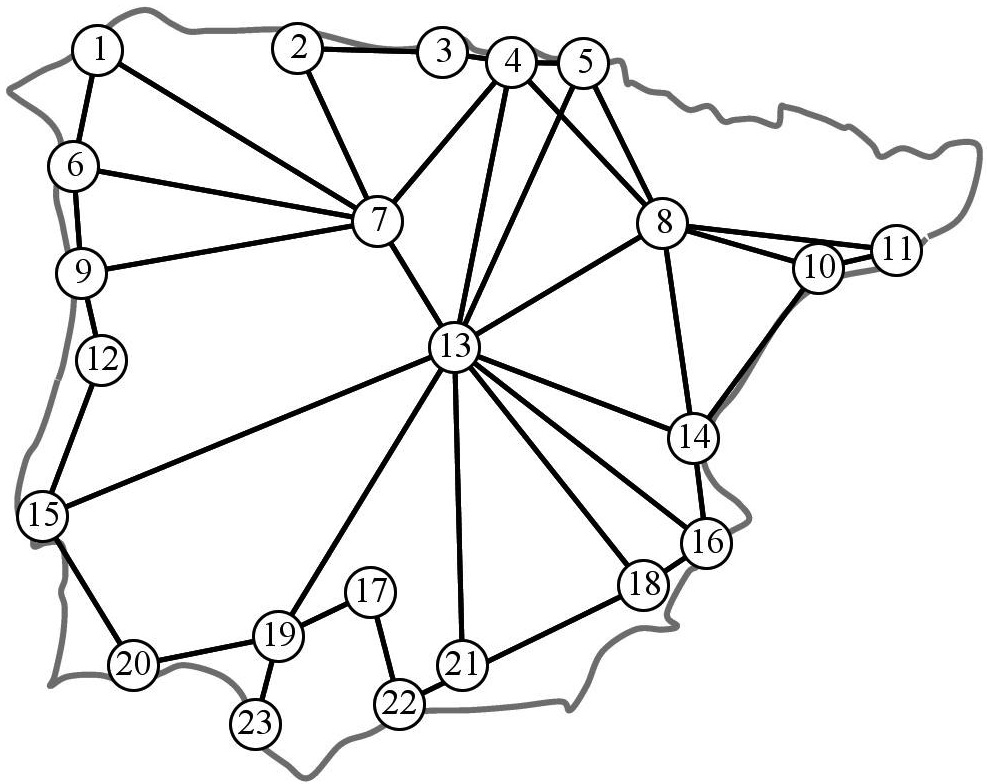
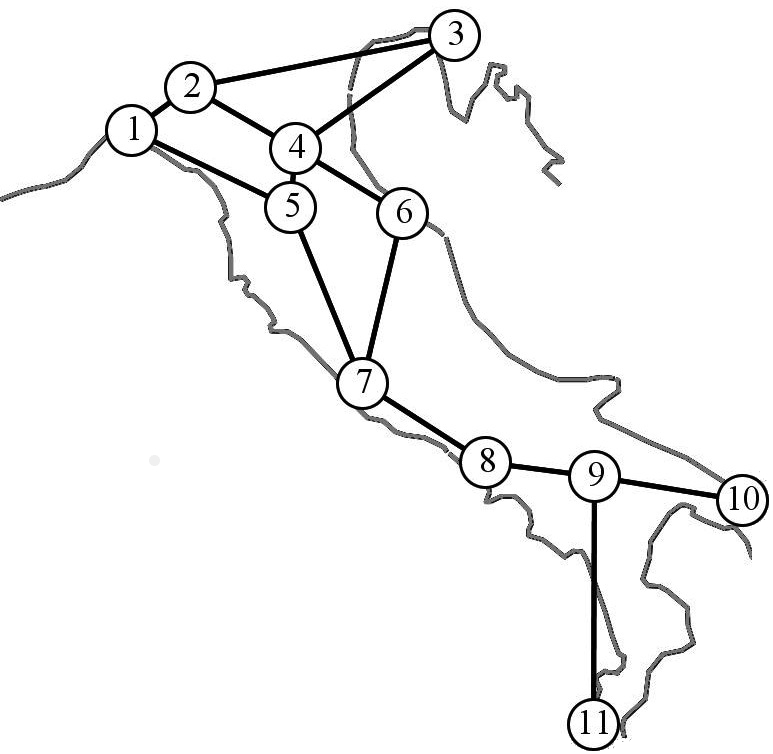
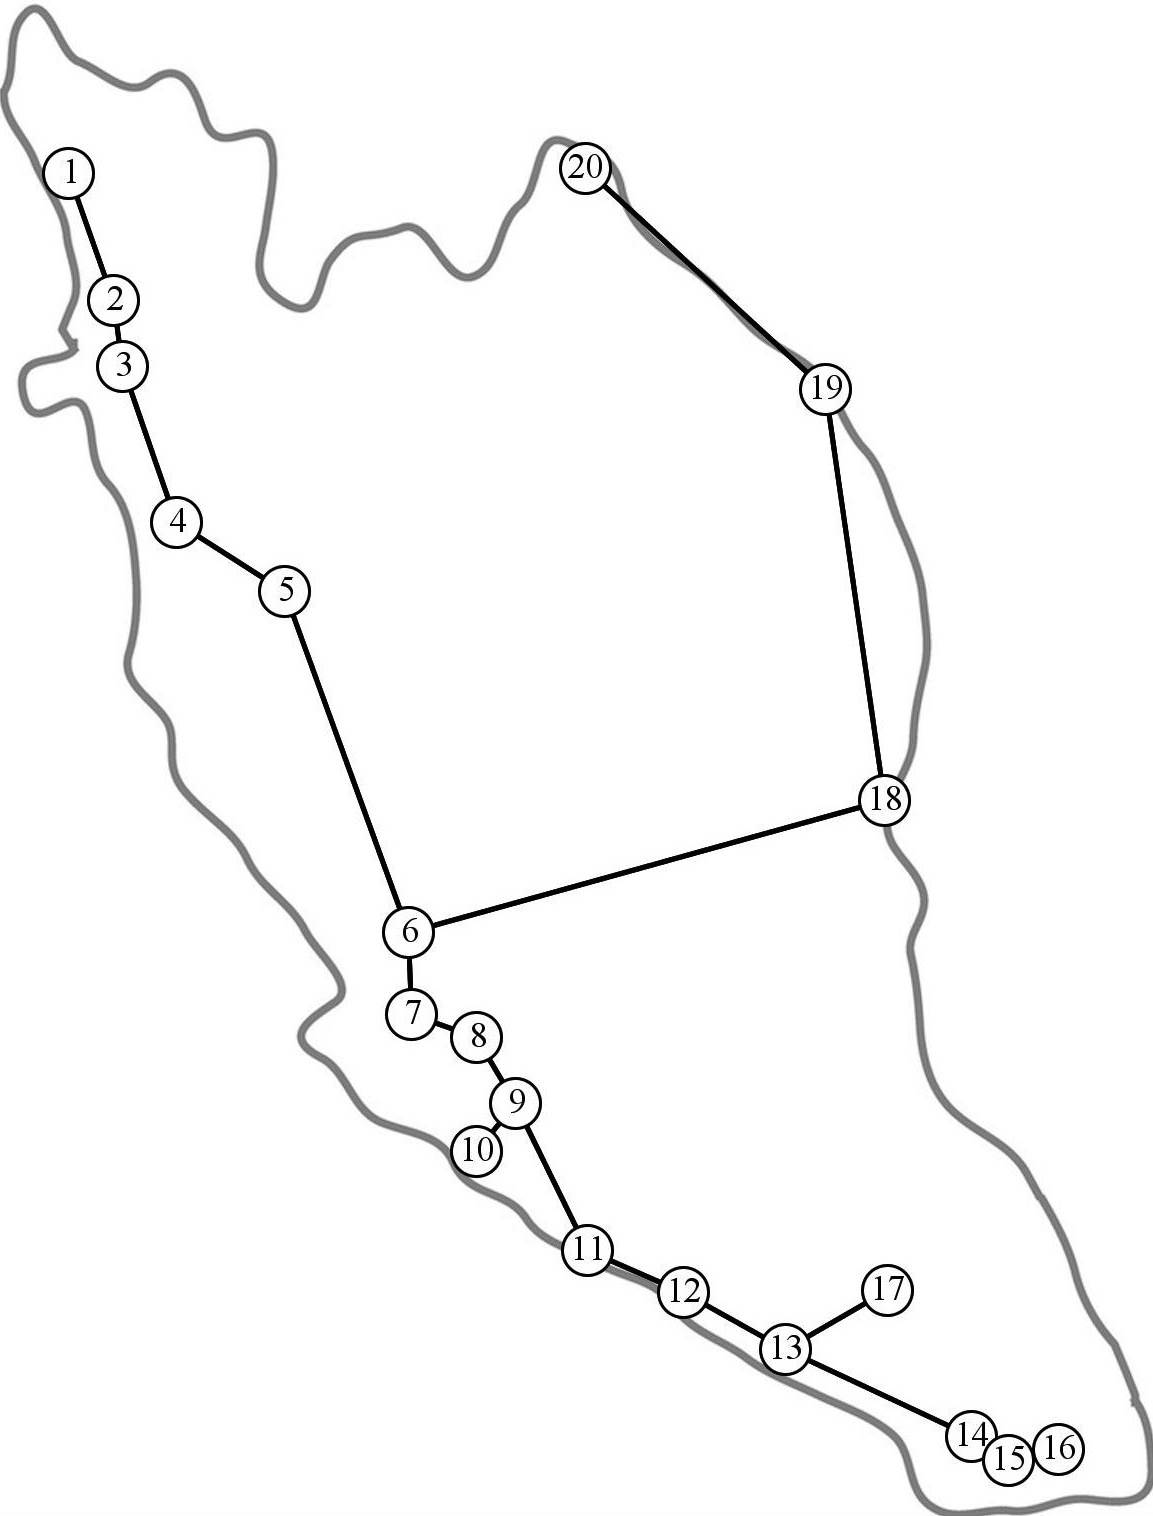
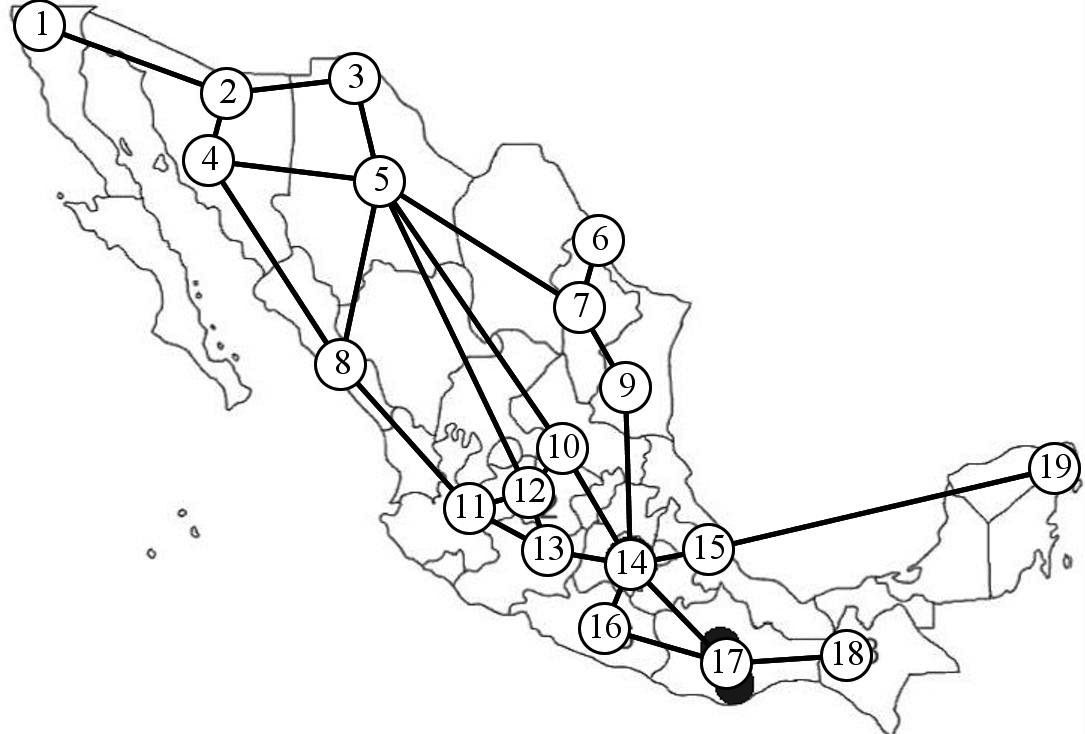
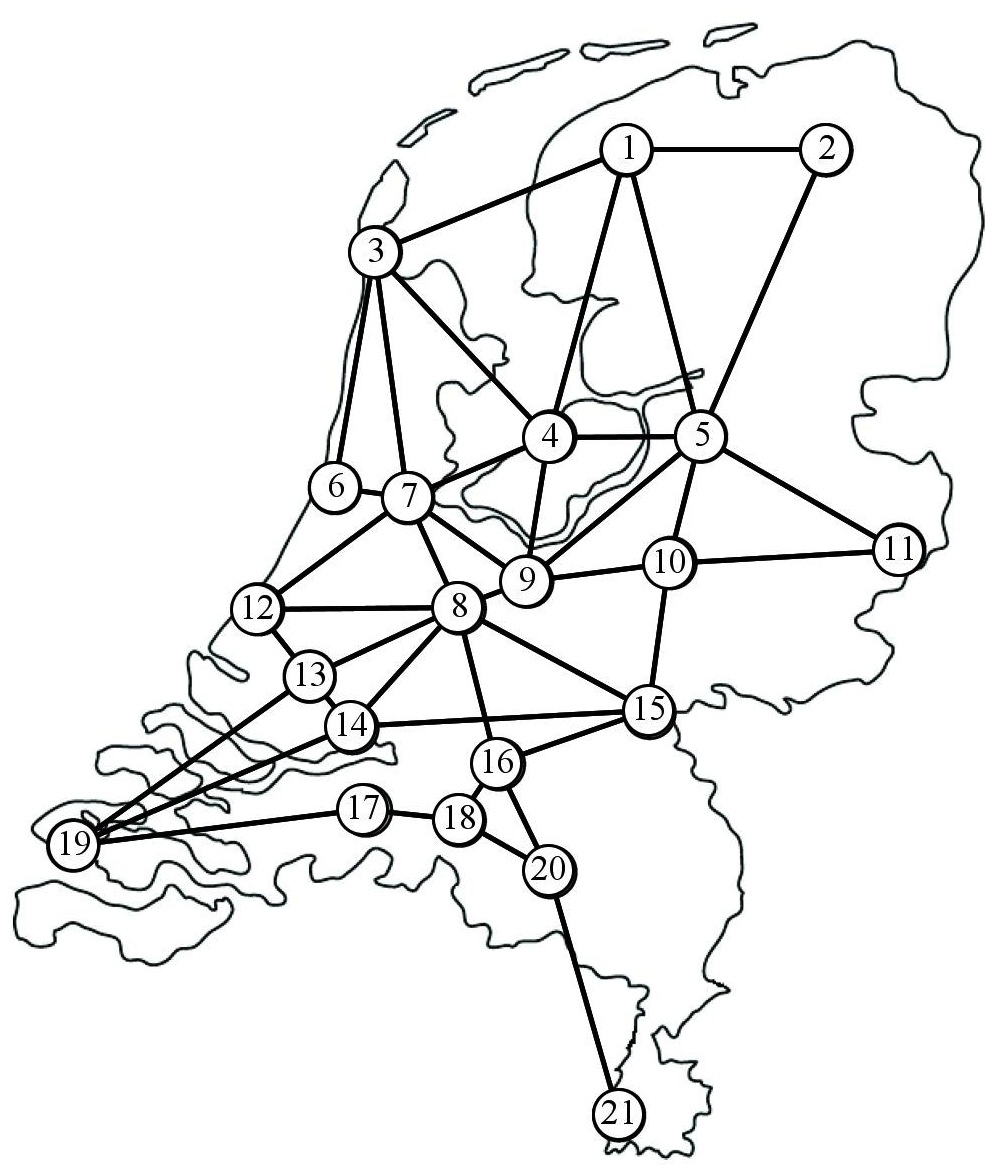
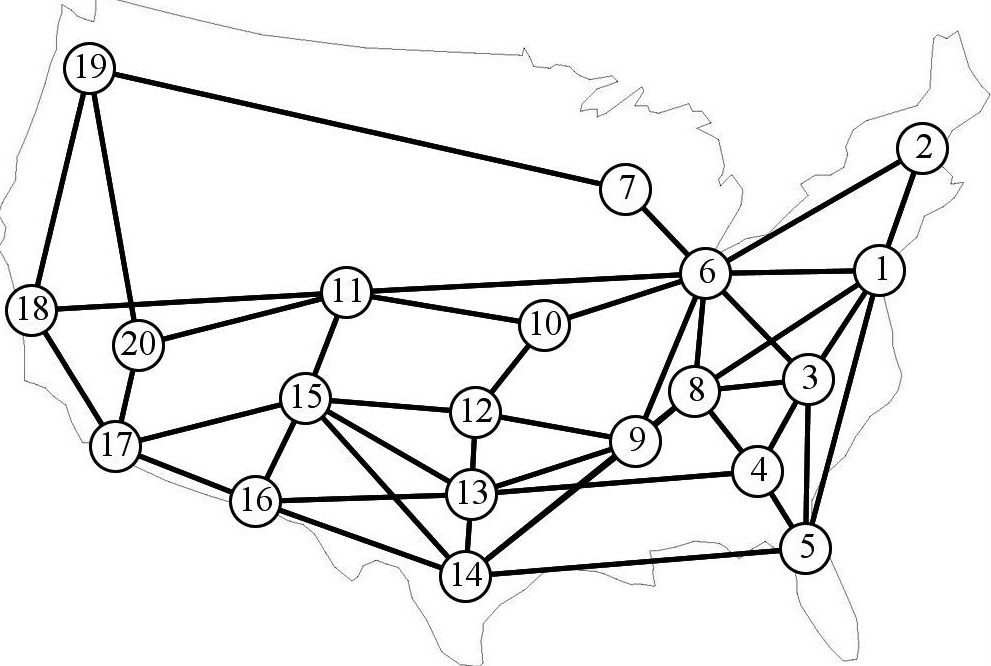
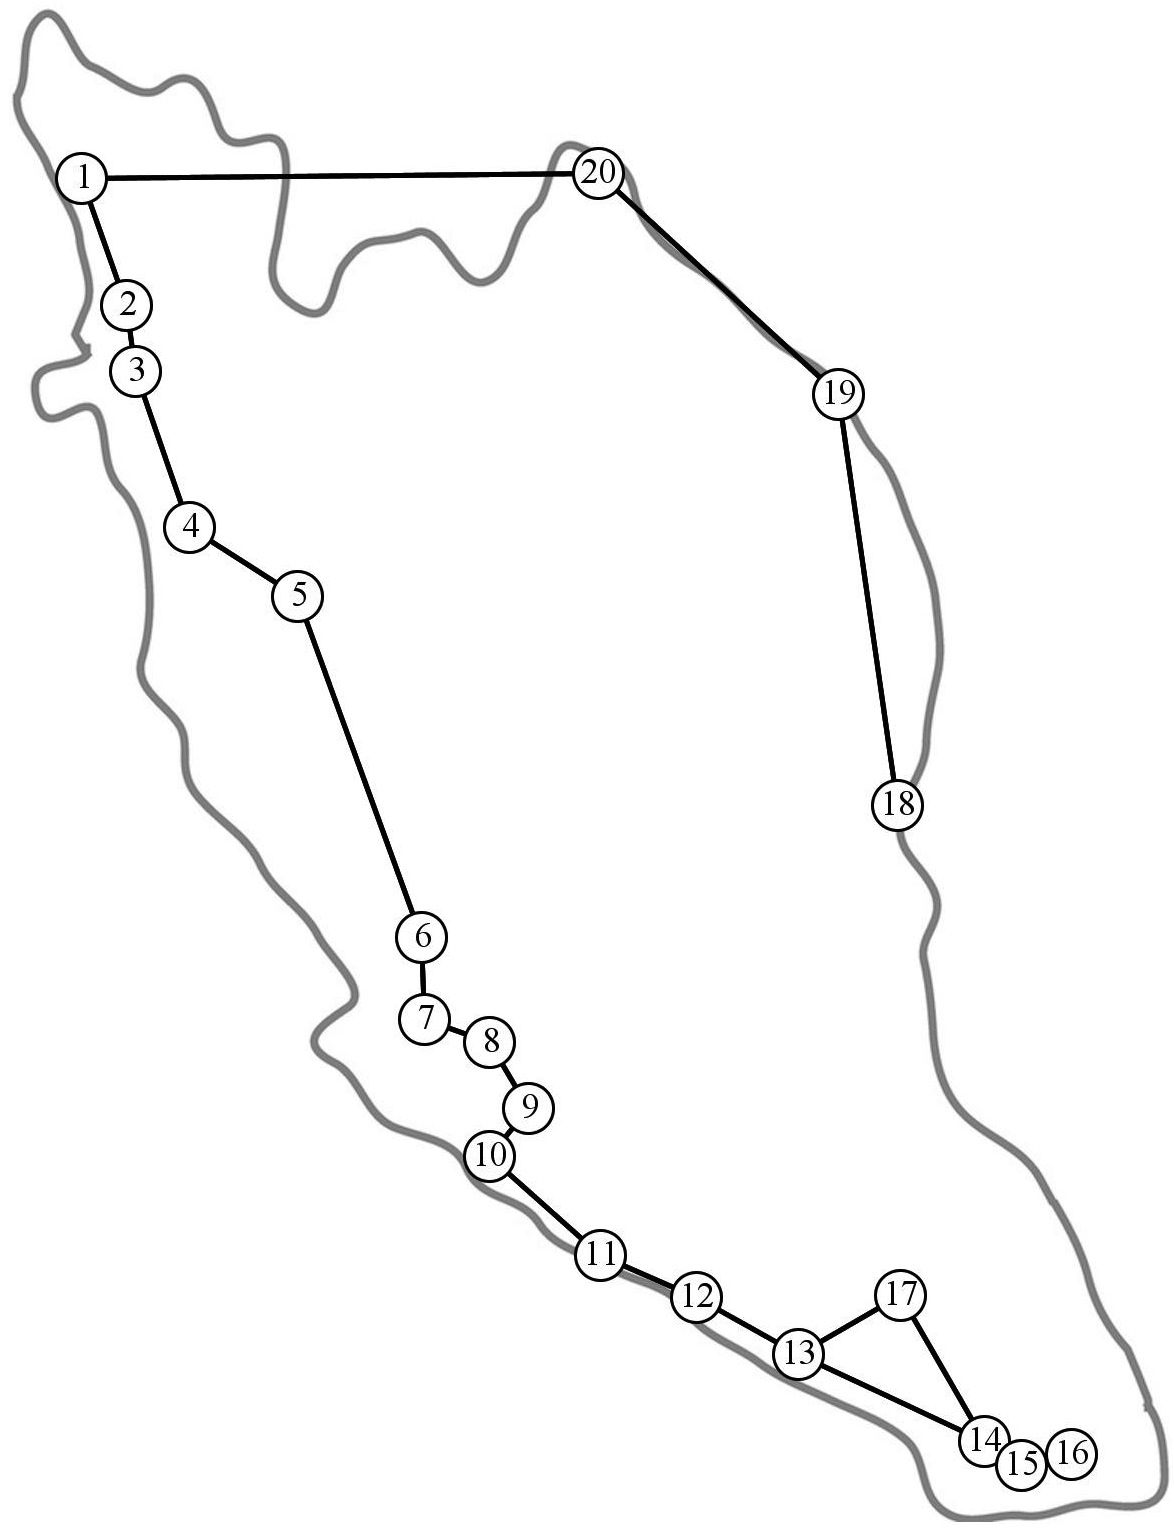
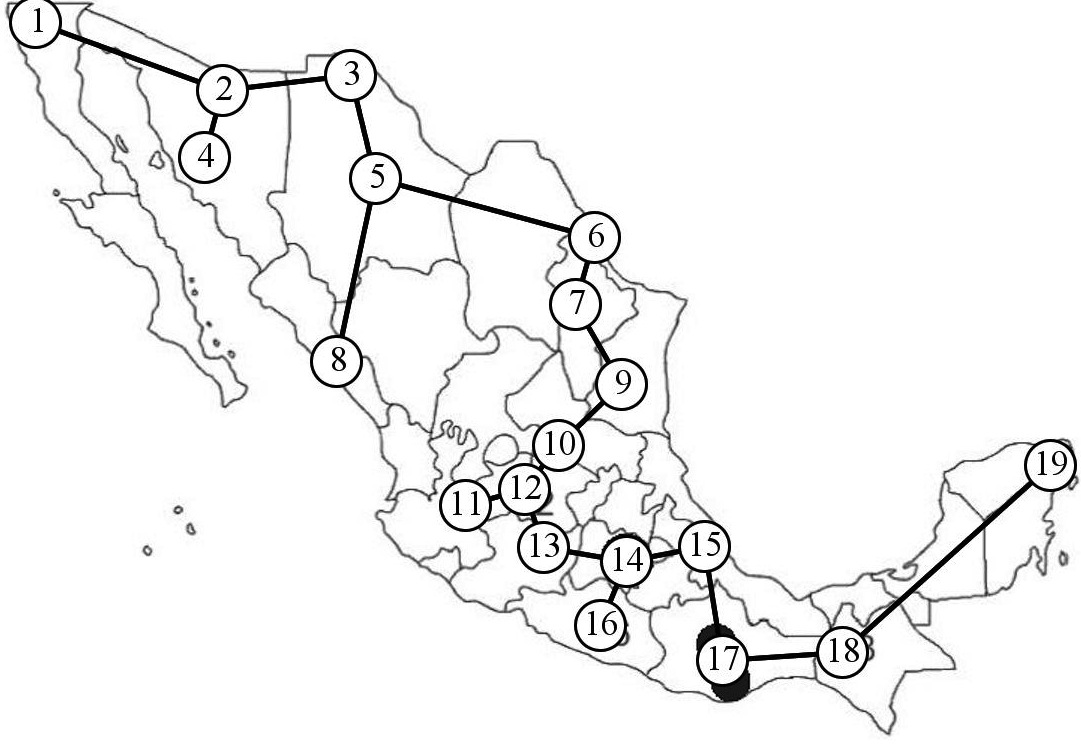
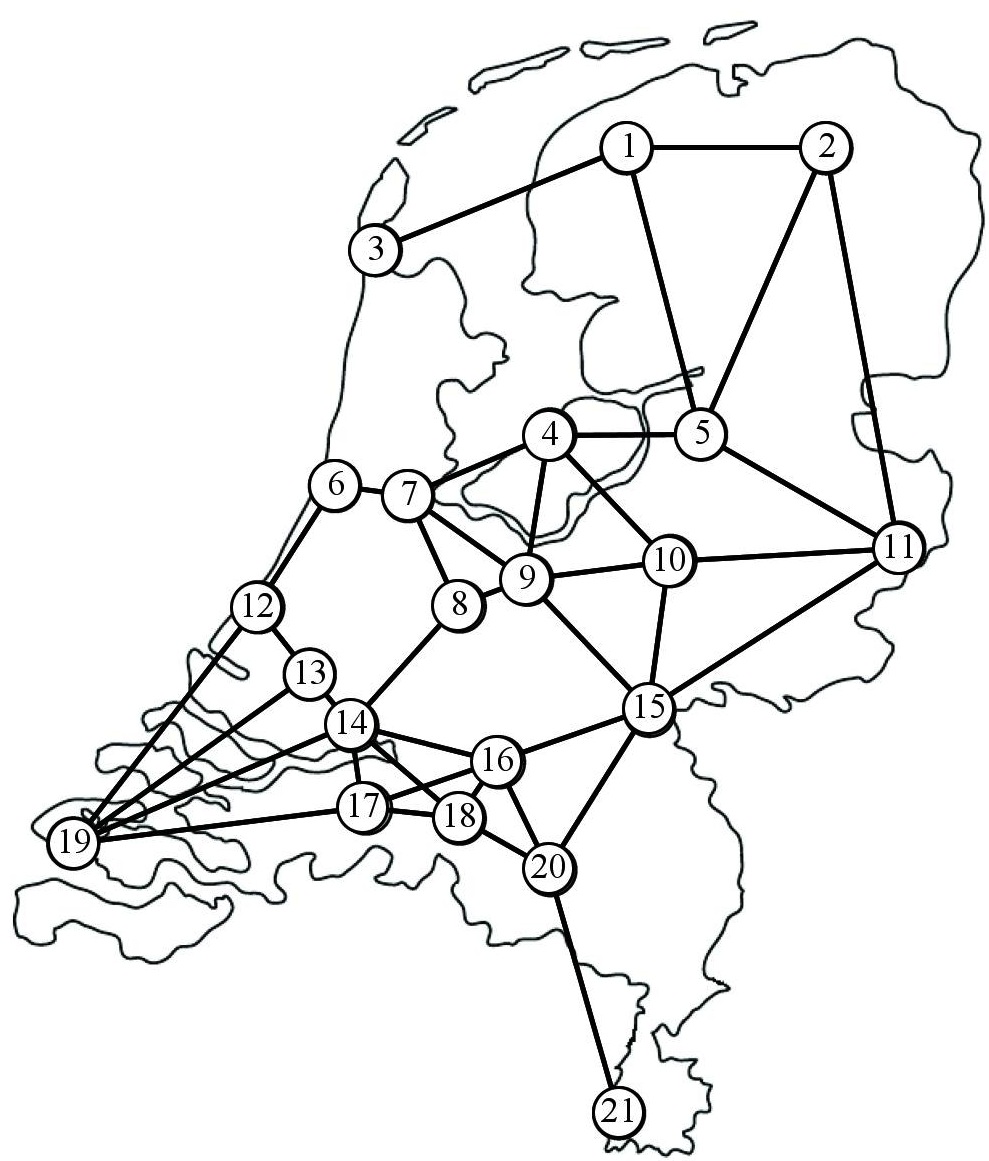
To compare the Physarum graphs with motorway graphs we construct a motorway graph as follows. Let be a set of urban regions, for any two regions and from , the nodes and are connected by an edge (, ) if there is a motorway starting in and passing in the vicinity of and not passing in the vicinity of any other urban area . Motorway graphs extracted from maps of motorway/highway/expressway/autobahn networks are shown in Fig. 5.
Motorway and Physarum graphs were compared directly and using integral measures and indices. Let be a number of edges in motorway graph and be number of edges in Physarum graph , and and be nodes, and and be adjacency matrices. Direct matching between motorway and Physarum graphs is calculated as , where if , and 0, otherwise. An economy of matching is calculated as . Also, we compared the graphs by their average shortest path measured in nodes, average shortest path measured in normalised edge lengths (for each edge we normalised its Euclidean length as , average degrees (sum of degrees of nodes divided by a number of nodes), average edge length (of normalised edges), diameters (longest shortest path) in nodes and normalised edge lengths, and maximum number of vertex independent cycles (two cycles are independent of each other if they do not share nodes or edges).
To measure ’compactness’ of graphs we calculated average cohesion: let be an average degree of a graph and be a number of common neighbours of nodes and , and is a degree of node , then cohesion between nodes and is calculated as . Three topological indices were calculated: Harary index [42], -index [24], and Randić index [44].
The Harary index is calculated as follows: , where is a graph distance matrix, where is a length of a shortest path (in normalised edge lengths) between and , and if and 0, otherwise. The -index shows a relationship between the total length of the graph and the distance along its diameter [24]: . The Randić index [44] is calculated as , where is an adjacency matrix, or .
3 Results
3.0.1 Matching and Economy
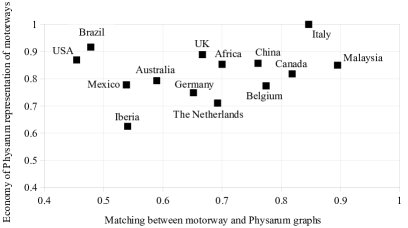
Top three regions in the best matches between motorway and Physarum graphs are Malaysia, Italy and Canada and top three most economically matched are Italy, Brazil and UK (Fig. 6(b)).
Finding 1
Let if , then regions can be arranged in the following hierarchy of absolute Physarum matching: USA Brazil {Mexico, Iberia} Australia {Germany, UK } {Africa, the Netherlands } {China, Belgium } Canada Italy Malaysia.
We can consider a product of matching to economy as a rough parameter for estimating ’slime-optimality’ of motorways approximation. By values of regions can be arranged in the descending slime-optimality as follow (exact values of are in brackets):
-
1.
Italy (0.85)
-
2.
Malaysia (0.76)
-
3.
Canada (0.67), China (0.65), Belgium (0.6), Africa (0.6), UK (0.59)
-
4.
Netherlands (0.49), Germany (0.48), Australia (0.47), Brazil (0.44), Mexico (0.42), USA (0.4)
-
5.
Iberia (0.34)


3.0.2 Average degrees
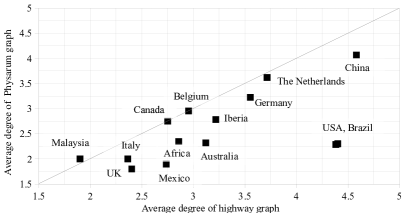
Averages degrees of motorway graphs are usually lower than degrees of the corresponding Physarum graphs (Fig. 7(a)). This is particularly visible with USA and Brazil motorway graphs, which average degrees are nearly 4.5 while Physarum graphs approximating the motorways have twice less average degree. Belgium, Canada and Malaysia show almost perfect match between Physarum and motorway graphs in average degrees (Fig. 7(a)).
3.0.3 Maximum number of independent cycles
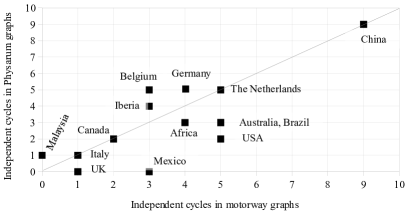
Motorway and Physarum graph of China, the Netherlands, Canada and Italy have the maximum number of independent cycles (Fig. 7(b)) and show a good match. Other regions can be subdivided on two groups:
-
•
number of independent cycles is higher in motorway graphs: Africa, Australia, Brazil, Mexico, UK, USA
-
•
number of independent cycles is higher in Physarum graphs: Belgium, Berlin, Canada, Germany, Iberia and Malaysia.
The maximum number of independent cycles may characterise two properties of transport networks: fault-tolerance (more cycles indicate more chances for a transported objects to avoid faulty impassable links, sites of accidents, and jams) and locality (distant links increase chances of two cycles of sharing a node). Thus, we can propose that China motorway network is most fault-tolerant and locally connected, while transport networks in Canada, Italy, Malaysia and UK could be sensitive to disasters and overloads.
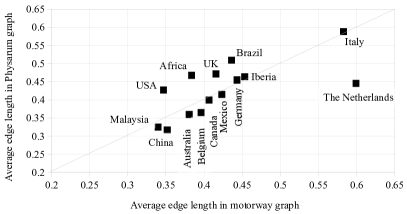
3.0.4 Average edge length
The closest match between Physarum and motorway graphs in average edge length is observed for Italy, Iberia, Germany, Mexico, Canada and Malaysia (Fig. 7(c)). Highest mismatch is shown by the Netherlands (edges of motorway graph are longer than edges of Physarum graph), and Brazil, Africa, and USA (edges of Physarum are longer, in average, than of motorway graphs).
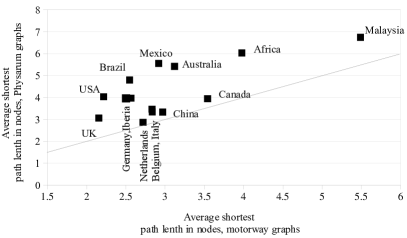
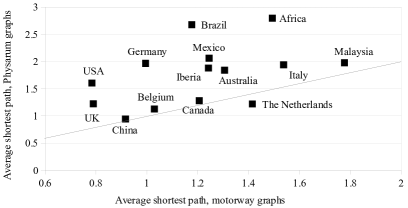
3.0.5 Average shortest paths
The average length of a shortest path between nodes shows little match between Physarum and motorway graphs (Figs. 7(d) and 7(e)). Usually Physarum graphs exhibit 1.5-2 times longer average shortest paths, this varies however between regions. Malaysia and Africa are the regions with longest average shortest paths, measured in nodes, in motorway and Physarum graphs (Figs. 7(d)). When shortest paths are measured in normalised edge length, Africa and Brazil have longest average shortest paths in Physarum graphs, and Malaysia and Italy in motorways graphs. Countries which show closest match between Physarum and motorway graphs — in average shortest path, measured in nodes (Figs. 7(d)) — are Canada, China, the Netherlands; and — in average shortest path measured in normalised lengths (Fig. 7(e)) — are Belgium, Canada, China.
3.0.6 Diameters
Being the longest shortest path, the diameter shows even less matching between Physarum and motorway graphs (Figs. 7(f) and 7(g)) than average shortest path matching. Physarum graphs match motorways in diameter measured in nodes for Belgium, and in diameter measured in normalised lengths for Belgium, China, and the Netherlands.

3.0.7 Cohesion
For most regions considered, average cohesion of Physarum graphs is typically higher than of motorway graphs (Fig. 8(a)). The difference is particularly strong for Brazil and USA, e.g. average cohesion of Brazilian motorway network is 0.8 while of the corresponding Physarum graphs it is 0.4. There is a match between Physarum and motorway graphs of Canada, Italy, and the Netherlands. The top three entries with highest cohesion of motorway graph are Brazil, Canada, China, and the Netherlands, and the top three regions with highest cohesion of Physarum graphs are Brazil, China and USA. Cohesion of each edge in the complete graph is , this limit is nearly approached by (Brazil) (Fig. 8(a)). Motorway and, especially, Physarum, graphs of Malaysia and Italy show minimal cohesion, because cohesion is zero in chains and graphs with cycles over three nodes.
Finding 2
Physarum matches motorway network of Canada, Italy and the Netherlands in terms of compactness, local densities and fault-tolerance of transport networks.
Average cohesion is an indicator of compactness [28]. A sub-set of the graph with high cohesion remains connected even when some edges are removed, thus cohesion may characterises stability [47] or even fault-tolerance of graphs. The cohesion of a node is the minimum number of edges whose deletion makes the node a cut node of the resulting graph [45], thus the cohesion is used to characterise a local density of sub-graphs [55], and it is related to centrality [20], and statistical properties of connectivity of graphs [52].
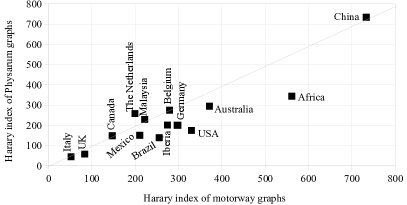
3.0.8 The Harary index
The Harary index [42] is well know for its predictive properties in chemistry [29, 30], and the index is based on ‘the chemists’ intuitive expectation that distant sites in a structure should influence each other less than the near site’ [37]. This is probably not the case with slime mould and man-made motorway networks. Only four out fourteen regions satisfy the relation : China, Canada, Belgium and Malaysia, where is the Harary index. Physarum poorly approximates motorways, in terms of the Harary index, in Brazil and USA (Fig. 8(b)).
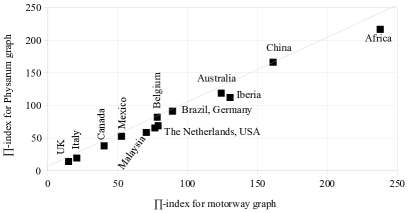
3.0.9 The -index
Five regions show over 0.1 mismatch, , between the -indices of Physarum and motorway graphs: Germany, Iberia, the Netherlands, Malaysia, and USA (Fig. 8(c)). This result is quite interesting. Recall, that the -index is a ratio of a total length of all normalised edges of a graph to a distance along the graph’s diameter. Physarum graphs neither match motorways in diameters (Figs. 7(f) and 7(g)), nor do we witness a good match in average edge length, or shortest paths (Figs. 7(c), 7(d), and 7(e)). However, when these factors are considered in proportion the match between the graphs occurs.
3.0.10 The Randić index
Finding 3
Physarum perfectly approximates motorway networks in terms of the Randić index.
| Country | |||||
|---|---|---|---|---|---|
| Africa | 16.98 | 16.88 | -0.006 | 17.5 | |
| Australia | 11.9 | 12.17 | 0.022 | 12.5 | |
| Belgium | 9.53 | 10.27 | 0.071 | 10.5 | |
| Brazil | 10.04 | 10.14 | 0.01 | 10.5 | |
| Canada | 7.25 | 7.76 | 0.066 | 8 | |
| China | 15.08 | 15.1 | 0.002 | 15.5 | |
| Germany | 9.94 | 10.15 | 0.02 | 10.5 | |
| Iberia | 10.62 | 11.11 | 0.045 | 11.5 | |
| Italy | 5.22 | 5.22 | 0 | 5.5 | |
| Malaysia | 9.63 | 9.88 | 0.025 | 10 | |
| Mexico | 8.87 | 8.95 | 0.009 | 9.5 | |
| Netherlands | 10.09 | 10.17 | 0.008 | 10.5 | |
| UK | 4.61 | 4.7 | 0.021 | 5 | |
| USA | 9.71 | 9.41 | -0.031 | 10 |
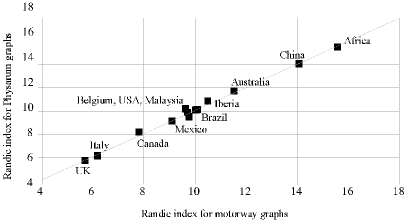
The Randić index shows impeccable match between Physarum and motorway graphs (Fig. 8(d) and Tab. 1). The largest value is for Belgium motorway graph, and corresponding Physarum graph. Star-graph has a minimum the Randić index [19]. For an arbitrary graph the boundaries are . As we can see in Tab. 1, indices for all motorway and Physarum graphs are very close to upper boundary. The highest values for motorways are in Italy and USA, and for Physarum graphs are in Belgium, Malaysia and Canada.
The Randić index (originally called by Milan Randić as molecular branching index) [44] characterises relationships between structure, property and activity of molecular components [31]. The index relates to diameter [25] and is actually the upper boundary of diameter [56]. It also relates to chromatic numbers of graphs and eigenvalues of adjacency matrices [36]. There are proven linear relations between the Randić index and molecular polarisability, cavity surface areas calculated for water solubility of alcohols and hydrocarbons, biological potencies of anaesthetics [34], water solubility and boiling point [26] and even bio-concentration factor of hazardous chemicals [46]. Estrada [32] suggested the following structural interpretation: the Randić index is proportional to an area of molecular accessibility, i.e. area ’exposed’ to outside environment. Or we can say that the index is inversely proportional to areas of overlapping between spheres of specified radius enclosing the nodes. The more overlapping the less is Randić index. In terms of transport networks, we can interpret external accessibility as transport inaccessibility, proportional to areas of country not served by existing motorway links.
Finding 4
Physarum well approximates motorway graphs in terms of transport accessibility.
Along the above discourse we can speculate that UK, Italy and Canada (first three regions with the smallest Randić indices) have better transport coverage of their territories than Africa, China and Australia (top three regions with the highest Randić indices).
3.0.11 Extremal regions
| Measure | ||||
|---|---|---|---|---|
| Average degree | China | Malaysia | China | UK |
| Number of independent cycles | China | Malaysia | China | UK, Mexico |
| Average cohesion | Brazil | Malaysia | Brazil | Malaysia |
| Average edge length | the Netherlands | Malaysia | Italy | China |
| Shortest path, nodes | Malaysia | UK | Malaysia | the Netherlands |
| Shortest path | Malaysia | UK, USA | Africa | China |
| Harary index | China | Italy | China | Italy |
| -index | Africa | UK | Africa | UK |
| Randić index | Africa | UK | Africa | UK |
| Diameter, nodes | Malaysia | Iberia, UK, USA | Malaysia | UK |
| Diameter | Malaysia | USA | Africa | China |
We call a region extremal if it displays minimum or maximum values of at least one measure over its motorway or Physarum graphs. The extremal regions are listed in Tab. LABEL:extremal:
-
•
Africa shows maximum -index and Randić index on both an , and maximum average shortest path and diameter on . This might indicate on critical dependencies between geographically close urban areas, large territorial spread of transport networks and relatively higher density of urban area along coasts (Fig. 5(a)).
-
•
Brazil shows maximum average cohesion on and . This is because Brazil has highest (amongst regions studied) number of locally connected sub-graphs with larges number of dependent cycles (Fig. 5(d)).
-
•
China shows maximum average degree, number of independent cycles and Harary index on and ; minimum average edge length, average shortest path and diameter on . These indicate on high accessibility of major urban area in China, and fault-tolerance of Chinese motorways at a large-scale (Fig. 5(f)). The expressway network in China has been developed much recently, known as the national trunk highway system, and it is a high-standard transport system planned by the central government. The system is designed to be optimal and many factors were properly taken into account including terrains and landscapes.
-
•
Iberia has minimum diameter in nodes on . The man-made transport network structure resembles a wheel with an ’axle’ at Madrid, most major urban areas around coast forming a ’rim’ linked to Madrid by ’spokes’ (Fig. 5(h)).
-
•
Italy shows minimum Harary index on and , and maximum average edge length on . These are due to tree-like structure of the transport networks and constraining of the urban areas in the prolonged shape of the country (Fig. 5(i)).
-
•
Malaysia shows maximum shortest path in nodes and diameter in nodes on and ; minimum average cohesion on and ; maximum average shortest path and diameter on ; minimum average degree, number of independent cycles, average edge length on . This is because Malaysian transport network does not have cycles and consists of a chain connecting urban areas along western coast (Fig. 5(j)).
-
•
Mexico shows minimum number of independent cycles on because the slime mould approximation is a tree, almost a chain with few branches (Fig. 4(k)).
- •
- •
-
•
USA shows minimum average shortest path, diameter in nodes and diameter on . These are because the motorway system in USA was built with optimality yet efficiency in mind.
3.0.12 Bio-rationality of measures
| Av degree | Cycles | Cohesion | Edge length | SP in nodes | SP | Harary-index | Pi-index | the Randic index | Diameter, nodes | Diameter | Bio-rationality of motorways | |
|---|---|---|---|---|---|---|---|---|---|---|---|---|
| Africa | 1 | 1 | ||||||||||
| Australia | 1 | 1 | 2 | |||||||||
| Belgium | 1 | 1 | 1 | 1 | 1 | 1 | 1 | 7 | ||||
| Brazil | 1 | 1 | 1 | 3 | ||||||||
| Canada | 1 | 1 | 1 | 1 | 1 | 1 | 1 | 7 | ||||
| China | 1 | 1 | 1 | 1 | 1 | 1 | 6 | |||||
| Germany | 1 | 1 | 1 | 3 | ||||||||
| Iberia | 1 | 1 | 2 | |||||||||
| Italy | 1 | 1 | 1 | 1 | 1 | 5 | ||||||
| Malaysia | 1 | 1 | 1 | 1 | 1 | 5 | ||||||
| Mexico | 1 | 1 | 1 | 3 | ||||||||
| The Netherlands | 1 | 1 | 1 | 1 | 4 | |||||||
| UK | 1 | 1 | 1 | 3 | ||||||||
| USA | 1 | 1 | ||||||||||
| Bio-rationality of measures | 4 | 4 | 2 | 6 | 0 | 3 | 6 | 9 | 14 | 1 | 3 |
In Tab. 3 we provide binary evaluation of matching between Physarum and motorway graphs calculated for each country and measure as follows: if and 0, otherwise. A bio-rationality of a measure is a number of regions for which (Tab. 3, bottom row).
Finding 5
Hierarchy of bio-rationality of measures: Randić index Average edge length, Harary index Average degree, Number of independent cycles shortest path, diameter average cohesion diameter in nodes shortest path in nodes.
Matching between motorway graphs and Physarum graphs is most strongly expressed in the Randić index; further measures amongst the top ones are -index, Harary index, and edge length. Thus we can enhance the Finding 3 as follows.
Finding 6
The Randić index is the most bio-compatible measure of transport networks.
The Randić index is used to characterise relations between structure, property and activity of chemical molecules [31], thus we can speculate that in terms of structure-property-activity Physarum almost perfectly approximates motorway networks in all regions!
3.0.13 Bio-rationality of motorways
We calculate a bio-rationality of a motorway graph as follows , if predicate is true, and 0 otherwise. We chose . Values of bio-rationality of motorways are shown in last column in Tab. 3.
Finding 7
Hierarchy of bio-rationality of regions is as follows:
{Belgium, Canada} China { Italy, Malaysia } the Netherlands
{ Brazil, Germany, Mexico, UK } { Africa, USA }
Comparing hierarchies of absolute matching, see Finding 1, with the above hierarchy of bio-rationality we find Belgium, Canada, China and Italy are at the intersection of first three levels of the hierarchies. We omit Italy because its shape is intrinsically restrictive and invokes rather trivial architectures of protoplasmic networks.
Finding 8
Motorway networks in Belgium, Canada and China are most affine to protoplasmic networks of slime mould P. polycephalum.
4 Discussion
Based on the results of our previous laboratory experiments with slime mould imitating the development of transport networks in fourteen regions [2]–[14],[51] we undertook a comparative analysis of the motorway and protoplasmic networks. We found that in terms of absolute matching between slime mould networks and motorway networks the regions studied can be arranged in the following order of decreasing matching: Malaysia, Italy, Canada, Belgium, China, Africa, the Netherlands, Germany, UK, Australia, Iberia, Mexico, Brazil, USA. We compared the Physarum and the motorway graphs using such measures as average and longest shortest paths, average degrees, number of independent cycles, the Harary index, the -index and the Randić index. We found that in terms of these measures motorway networks in Belgium, Canada and China are most affine to protoplasmic networks of slime mould P. polycephalum. With regards to measures and topological indices we demonstrated that the Randić index could be considered as most bio-compatible measure of transport networks, because it matches incredibly well the slime mould and man-made transport networks, yet efficiently discriminates between transport networks of different regions.
References
- [1] Adamatzky A. Developing proximity graphs by Physarum Polycephalum: Does the plasmodium follow Toussaint hierarchy? Parallel Processing Letters 19 (2008) 105–127.
- [2] Adamatzky A. and Alonso-Sanz R. Rebuilding Iberian motorways with slime mould. Biosystems 105 (2011) 89–100.
- [3] Adamatzky A. and Akl S.G. Trans-Canada Slimeways: Slime mould imitates the Canadian transport network. Int. J. Natural Computing Research (2012), accepted.
- [4] Adamatzky A., De Baets B., Van Dessel W. Slime mould imitation of Belgian transport networks: redundancy, bio-essential motorways, and dissolution. arXiv:1112.4507v1 [nlin.AO].
- [5] Adamatzky A., Ibrahim Z., and Abidin A. F. Z., Muhammad B. Slime mould approximates Malaysian expressways: is there a bio-logic behind the transport network? Submitted (2012).
- [6] Adamatzky A. and Ilachinski A. Slimy interstates: Slime mould imitates the USA interstates system. Complex Systems (2012), accepted.
- [7] Adamatzky A. and Jones J. Road planning with slime mould: If Physarum built motorways it would route M6/M74 through newcastle. Int. Jl Bifurcation Chaos 20 (2010) 3065–3084.
- [8] Adamatzky A. and Prokopenko M. Slime mould evaluation of Australian motorways. Int. J. Parallel, Emergent and Distributed Systems (2011).
- [9] Adamatzky A., Martínez G., Chapa-Vergara S., Asomoza-Palacio R., Stephens C. Approximating Mexican highways with slime mould Natural Computing 10 (2011) 1195–1214.
- [10] Adamatzky A. and de Oliveira P.P.B. Brazilian highways from slime mold’s point of view. Kybernetes 40 (2011) 1373–1394.
- [11] Adamatkzy A. and Kayem A. V. D. M. Biological evaluation of Trans-African highways. Europ. J. Physics ST (2012), accepted.
- [12] Adamatzky A., Lees M., Sloot P. M.A. Bio-development of motorway networks in the Netherlands: A slime mould approach. Adv. Complex Systems (2012), accepted.
- [13] Adamatzky A. and Schubert T. Schlauschleimer in Reichsautobahnen: Slime mould imitates motorway network in Germany. Submitted (2012).
- [14] Adamatzky A., Yang X.-S., Zhao Y.-X. Slime mould imitates transport networks in China. Submitted (2011).
- [15] Barrat A., Barthelemy M., Vespignani A. Dynamical processes in complex networks. Cambridge University Press (2008)
- [16] Belloc H. The Road (Fisher Unwin, London, 1924). Cited by [18].
- [17] Beuthe M., Himanen V., Reggiani A., Zamparini L. (Eds.) Transport Developments and Innovations in an Evolving World Springer, 2004.
- [18] Bogart D. Neighbors, Networks, and the Development of Transport Systems: Explaining the Diffusion of Turnpike Trusts in Eighteenth Century England. J Urban Economics 61 (2007) 238–262.
- [19] B. Bollobás and P. Erdös Graphs of extremal weights, Ars Combin. 50 (1998), 225–233.
- [20] Borgatti S. P., Everett M. G. A graph-theoretic perspective on centrality. Social Networks 28 (2006) 466–484.
- [21] Davies H. From Trackways to Motorways. 5000 Years of Highway History. Tempus, 2006.
- [22] Dobrynin A.A., Entringer R., Gutman I. Wiener index of trees: theory and applications. Acta Appl. Math. 66 (2001) 211–249.
- [23] Dorigo M. and Statzle T. Ant Colony Optimization. Bradford Books, 2004.
- [24] Ducruet C. and Rodrigue J.-P. Graph Theory: Measures and Indices (2012) http://people.hofstra.edu/geotrans/eng/ch1en/meth1en/ch1m3en.html
- [25] Dvořák Z., Lidický B. , Škrekovski R. Randić index and the diameter of a graph. European Journal of Combinatorics 32 (2011) 434–442.
- [26] Hall L.H., Kier L.B. , Murray W.J. Molecular connectivity. II. Relationship to water solubility and boiling point. J. Pharm. Sci. 64 (1975) 1974–1977.
- [27] I. Gutman, N. Trinajstić, Graph theory and molecular orbitals, Total-electron energy of alternant hydrocarbons, Chem. Phys. Lett. 17 (1972) 535–538.
- [28] Egghe L., Rousseau R. BRS-compactness in networks: Theoretical considerations related to cohesion in citation graphs, collaboration networks and the internet. Mathematical and Computer Modelling 37 (2003) 879–899.
- [29] Estrada E.; Rodríguez L. Matrix algebraic manipulations of molecular graphs. 2. Harary- and MTI-like molecular descriptors. Comm. Math. Chem. 35 (1997) 157–167.
- [30] Estrada E.; Rodríguez L. Gutiérrez A. Matrix algebraic manipulations of molecular graphs. 1. Graph theoretical invariants based on distances and adjacency matrices. Comm. Math. Chem. 35 (1997) 145–156.
- [31] Estrada E. Generalization of topological indices. Chem. Phys. Lett. 336 (2001) 248–252.
- [32] Estrada E. The structural interpretation of the Randić index. Internet Electronic Journal of Molecular Design 1 (2002) 360–366.
- [33] Ilić A., D. Stevanović, On comparing Zagreb indices, Commun. Math. Comput. Chem. 62 (2009) 681–687.
- [34] Kier L.B., Hall L.H., Murray W.J., Randić M., Molecular connectivity. I. Relationship to nonspecific local anesthesia, J. Pharm. Sci. 64 (1975) 1971–1974.
- [35] Larsen J., Urry J., Axhausen K. Mobilities, Networks, Geographies. Ashgate Publishing, 2006.
- [36] Li X., Shi Y., Wang L., An updated survey on the Randić index. Math. Chem. Monogr. (6) (2008) 9–47
- [37] Lučić B., Miličević A., Nikolić S., Trinajstić N. Harary index — Twelve years later. Croatica Chemica Acta 75 (2002) 847–868.
- [38] Nakagaki T., Smart behavior of true slime mold in a labyrinth. Research in Microbiology 152 (2001) 767- 770.
- [39] Nakagaki T., Yamada H., and Toth A., Path finding by tube morphogenesis in an amoeboid organism. Biophysical Chemistry 92 (2001) 47 -52.
- [40] Nakagaki T., Iima M., Ueda T., Nishiura y., Saigusa T., Tero A., Kobayashi R., Showalter K. Minimum-risk path finding by an adaptive amoeba network. Physical Review Letters 99 (2007) 068104.
- [41] Nicolić S., Kovačević G., Miličević A., Tinajstić N. The Zagreb indices 30 years after. Croatia Chemica Acta 76 (2003) 113–124.
- [42] Plavsić D., Nikolić S., Trinajstić N. and Mihalić Z. On the Harary index for the characterization of chemical graphs. J. Math. Chem. 12 (1993) 235–250.
- [43] Olariu S., Weigle M.C. Vehicular Networks: From Theory to Practice. Chapman and Hall/CRC, 2009.
- [44] Randić, M. Characterization of molecular branching, Journal of the American Chemical Society 97 (1975) 6609–6615.
- [45] Ringelsen R.D., Lipman M.J. Cohesion and stability in graphs Original Research Article Discrete Mathematics 46 (1983) 191–198.
- [46] Sabljić A. and Protić M. Molecular connectivity: A novel method for prediction of bioconcentration factor of hazardous chemicals. Chemico-Biological Interactions 42 (1982) 301–310.
- [47] Seidman S. B. Internal cohesion of ls sets in graphs. Social Networks 5 (1983) 97- 107.
- [48] Shirakawa T., Adamatzky A., Gunji Y.-P., Miyake Y. On simultaneous construction of Voronoi diagram and Delaunay triangulation by Physarum polycephalum Int. J. Bifurcation Chaos 19 (2009) 3109-3117.
- [49] Solnon C. Ant Colony Optimization and Constraint Programming. Wiley-ISTE, 2010.
- [50] Stephenson S. L. and Stempen H. Myxomycetes: A Handbook of Slime Molds. (Timber Press, 2000).
- [51] Strano E., Adamatzky A., Jones J. Vie Physarale: Evaluation of Roman roads with slime mould. Int. J. Nanotechnology and Molecular Computation (2011), in press.
- [52] Tainiter M. Statistical theory of connectivity I: basic definitions and properties. Discrete Mathematics 113 (1975) 391–398.
- [53] Taplin J. H. E. Qiu M., Han R. Cost-Benefit Analysis And Evolutionary Computing: Optimal Scheduling of Interactive Road Projects Edward Elgar Publishing, 2005.
- [54] Taylor C. Roads and Tracks of Britain (Dent, London, 1979). Cited by [18].
- [55] Tibély S. Criterions for locally dense subgraphs. Physica A 391 (2012) 1831–1847.
- [56] Yang Y., Lu L. The Randić index and the diameter of graphs Discrete Mathematics 311 (2011) 1333 1343