Dynamical approach to heavy-ion induced fission using actinide target nuclei at energies around the Coulomb barrier∗
Abstract
In order to describe heavy-ion fusion reactions around the Coulomb barrier with an actinide target nucleus, we propose a model which combines the coupled-channels approach and a fluctuation-dissipation model for dynamical calculations. This model takes into account couplings to the collective states of the interacting nuclei in the penetration of the Coulomb barrier and the subsequent dynamical evolution of a nuclear shape from the contact configuration. In the fluctuation-dissipation model with a Langevin equation, the effect of nuclear orientation at the initial impact on the prolately deformed target nucleus is considered. Fusion-fission, quasi-fission and deep quasi-fission are separated as different Langevin trajectories on the potential energy surface. Using this model, we analyze the experimental data for the mass distribution of fission fragments (MDFF) in the reactions of 34,36S+238U and 30Si+238U at several incident energies around the Coulomb barrier. We find that the time scale in the quasi-fission as well as the deformation of fission fragments at the scission point are different between the 30Si+238U and 36S+238U systems, causing different mass asymmetries of the quasi-fission.
∗ This is the simplified version excluded figures with large file size, which could not be uploaded here. To obtain the complete version (included 21 figures), please contact to aritomo24@muj.biglobe.ne.jp.
pacs:
25.70.Jj, 24.60.Ky, 25.60.Pj, 27.90.+b, 24.10.EqI Introduction
The prediction of the existence of the “Island of Stability” in the nuclear chart has encouraged searches of new elements myer66 . The synthesis of these superheavy elements has been carried out using heavy-ion fusion reactions between stable nuclei, in which two different types of reaction have been employed. In the cold fusion reactions, lead and bismuth targets are used ogan75 ; hofm00 . The element with reported by RIKEN used this type of reaction mori03 . The superheavy nuclei (SHN) synthesized in the cold fusion reaction produce nuclei with relatively small number of neutrons. The other type of reaction, called the hot fusion reaction, on the other hand, uses actinide nuclei as targets. With this type of reaction, production of elements with and 118 were reported by the Flerov Laboratory of Nuclear Reactions (FLNR) ogan01 . These nuclei as well as those produced as descendants in the -decay chain have relatively larger number of neutrons. Recently, other laboratories than FLNR also performed experiments of hot fusion reactions and obtained results that are consistent with the data by FLNR hofm07 ; stav09 ; elli10 ; dull10 . At present, attempts to produce elements 119 and 120 are made or planed in several facilities using actinide targets. In order to produce new nuclei or elements not discovered so far, an accurate prediction of the production cross sections is an important issues in the SHN research.
An important quantity for a prediction of the cross section is the probability of fusion after the interacting nuclei have the initial contact. Due to the complexity of the process, however, a good method to predict the fusion probability has not been established well. Furthermore, actinide nuclei are prolately deformed, so that one needs to introduce nuclear orientation as an additional degree of freedom. The effect of nuclear orientation on fusion probability has been evident already in the reactions using rare-earth nuclei with a prolate shape mits00 ; nish00 . This makes the hot fusion in contrast to the cold fusion reactions, which use spherical nuclei.
Our strategy to calculate the fusion probability is to use the unified model zagr05 , which has been developed by the FLNR theory group zagr05 ; zagr07a ; zagrt . The model can describe every entrance and exit channels in heavy-ion collisions, and can calculate also the time evolution of the nuclear shape, where the binary decay of the composite system (fission) can be treated. In this model, a system first feels a diabatic potential in the early stage of the initial collision. The potential is then gradually shifted to an adiabatic potential in a time-dependent manner. A trajectory calculation is performed on the time-dependent unified potential energy surface by using the Langevin equation. In the trajectory analysis, different types of fission can be separated, that is, fusion-fission (FF) and quasi-fission process (QF). The fusion-fission is a fission of a compound nucleus, and is defined as the case when the trajectory enters the region of compound-nucleus, followed by fission. The quasi-fission, on the other hand, is the fission event whose trajectory does not enter the region of compound nucleus. The fusion probability is defined as the FF events normalized to all the fission events (that is, FF+QF). The model should be constrained or checked by experiments by investigating whether the calculation can reproduce the measured fission spectra such as mass and total kinetic energy distributions.
Recently, the mass distributions of fission fragments (MDFF) for the reactions 36,34S+238U and 30Si+238U at several incident energies around the Coulomb barrier were measured by the Japan Atomic Energy Agency (JAEA) nish08 ; nish08a ; nish10a ; nish10b . One of the findings in the experiment is that the mass asymmetry in QF is different between the 30Si+238U and 36,34S+238U systems at low incident energies. In this work, we attempt to analyze these data in order to understand the reaction mechanism.
In the previous paper arit09 , to estimate the capture and fusion cross sections, we only considered the spherical-spherical configuration as the first approximation, limiting to the energy region above the Bass barrier. In order to extend the calculation down to energies below the barrier, the effect of nuclear orientation has to be taken into account. Such effect has been well established in the approaching phase of the reaction using the coupled-channels approach NBT86 ; RHT01 ; HR04 . However, it is still difficult to calculate the adiabatic potential energy to be used in the unified model with the two-center parametrization for subsequent shapes of the nuclear system, starting from the configuration of arbitrarily oriented two deformed nuclei touching each other to the spherical compound nuclei. In this paper, we propose a new model which can avoid this difficulty. In the new model, all the orientation angles are effectively taken into account by introducing the effective charge-center distance at the contact point as a variable. With this prescription, a dynamical calculation for superheavy elements is possible for the first time at energies below the Coulomb barrier.
The paper is organized as follows. In Sec. II, we detail the framework of the new model, which combines the coupled-channels method and the dynamical Langevin calculation. In Sec. III, we show the results for the cross sections and MDFF at several incident energies for the reactions of 36,34S + 236U and 30Si + 236U. In Sec. IV, we discuss the reasoning of the different shapes of MDFF observed in these reactions. In Sec. V, we present a summary of this study and further discussion.
II Model
II.1 Coupled-channels method
Excitations of the rotational states in a deformed nucleus in the approaching phase of heavy-ion collisions considerably modify the fusion barrier and increase the capture cross sections at the sub-barrier energies. For a heavy deformed nucleus considered in this paper, it is reasonable to introduce the sudden approximation to the coupled-channels (CC) equations. In this approximation, the capture cross section is given as NBT86 ; RHT01 ; HR04 ,
| (1) |
where is the angle of the incident projectile nucleus with respect to the symmetry axis of the deformed target, and denotes the incident energy in the center-of-mass frame. Here, we have assumed that the target nucleus has an axially symmetric shape. is the capture cross section for a given value of , calculated with an angle dependent internucleus potential ,
| (2) | |||||
| (3) | |||||
| (4) |
Here, is the equivalent sharp surface radius of the target nucleus, and and stand for the quadrupole and hexadecapole deformation parameters of the target nucleus, respectively. We have assumed the Woods-Saxon function for the nuclear potential, . Using the penetration probability for the -th partial wave, , the capture cross sections are given by
| (5) |
where is the wave number of the incident flux. The vibrational excitations in the projectile nucleus are also taken into account for each in the same way as in the computer code CCFULL ccfull .
The fusion cross section is calculated by multiplying the probability to form a compound nucleus, , to the capture probability, , at each incident angle and integrating it over the solid angle as
| (6) |
with
| (7) |
As we explain in the next subsection, the formation probability is estimated with the dynamical calculation using the Langevin equation. In order to introduce the orientation angle dependence to , we make the following approximation. We first notice that the charge-center distance at the touching point is strongly correlated with the incident angle . In our model, the touching distance is assumed to be
| (8) |
where is the radius parameter in the Woods-Saxon potential, Eq. (3). In the dynamical calculation, we use an angle independent potential energy surface, but starting from the angle dependent initial touching distance given by Eq. (8). With this prescription, we can for the first time extend the dynamical Langevin calculation down to the subbarrier region.
II.2 Dynamical calculation
After the projectile enters with an arbitrary orientation relative to the symmetry axis of the deformed target nucleus, the collision is replaced by the one from the polar-side of the target nucleus and the trajectory calculation starts from the configuration corresponding to the touching distance . That is, we consider only the nose-to-nose configuration. In this stage, we assume that the potential has been shifted to the adiabatic potential from the diabatic one. In the reactions of 238U, the static deformation of () moll95 is used.
The nuclear shape is defined by the two-center parametrization maru72 ; sato78 , which has three deformation parameters, , and . is the distance between two potential centers, while is the mass asymmetry of the colliding nuclei, where and denote the mass numbers of heavy and light nuclei, respectively arit04 . denotes the deformation of the fragments, and is defined by , where and are the half length of the axes of an ellipse in the and directions of the cylindrical coordinate, respectively, as shown in Fig. 1 in Ref. maru72 . We assume that each fragment has the same deformation. The deformation parameters and are related to each other as
| (9) |
Notice , because and . In order to reduce the computational time, we employ the coordinate defined as , where denotes the radius of a spherical compound nucleus and is defined as .
The neck parameter entering in the two-center parametrization has been adjusted in Ref. zagr07 to reproduce the available data, assuming different values between the entrance and the exit channels of the reactions. In our study, we use for the entrance channel and for the exit channel. We assume the following time dependence for the adiabatic potential karp07 , expressed in terms of the relaxation time for :
| (10) |
with
| (11) |
Here, is the deformation coordinate. We use sec., as it gives a reasonable account for the available data of mass, angular, and kinetic energy distributions of outgoing fragments produced in heavy-ion collisions (that is, deep-inelastic reaction, nuclear transfer reactions, fusion-fission) arit09 ; zagr05 ; zagr07a ; zagrt .
For a given value of and a temperature of a system, , the adiabatic potential energy is defined as
| (12) |
| (13) |
| (14) |
| (15) |
Here, is the potential energy calculated with the finite-range liquid drop model, given as a sum of of the surface energy krap79 and the Coulomb energy . is the shell correction energy evaluated for each temperature using the factor , in which is the shell damping energy chosen to be 20 MeV igna75 and is the level density parameter. At the zero temperature (), the shell correction energy reduces to . The second term on the right hand side of Eq. (12) is the rotational energy for an angular momentum arit04 , with a moment of inertia, .
Since we employ the CC model for the approaching phase to describe the penetration of the Coulomb barrier, the two-body part of the unified mode is omitted zagr05 ; zagr07a ; zagrt ; arit09 in our calculations. The multidimensional Langevin equations arit04 ; zagr05 are thus simplified as
where with . The summation is performed over repeated indices. In the Lengevin equation, and are the shape-dependent collective inertia parameter and the friction tensor, respectively. The wall-and-window one-body dissipation bloc78 ; nix84 ; feld87 is adopted for the friction tensor. A hydrodynamical inertia tensor is adopted with the Werner-Wheeler approximation for the velocity field davi76 . The normalized random force is assumed to be white noise, i.e., =0 and . The strength of the random force is given by .
The temperature is calculated from the intrinsic energy of the composite system as , where is calculated at each step of a trajectory calculation as
| (16) |
The excitation energy of the compound nucleus is given by , where denotes the -value of the reaction.
The fusion probability in Eq. (7) is determined in our model calculation by identifying the different trajectories on the deformation space. It is equivalent to the number of trajectories of compound-nucleus fission normalized to all the fission events. Formation of the compound nucleus is defined as the case that a trajectory enters in a compact-shape region in the adiabatic potential energy surface. We define the compound nucleus region (that is, the fusion box) by referring to the ridge of the fission barrier in the coordinate space arit04 .
III Mass distribution of fission fragments and cross sections
III.1 Reaction of 36,34S+238U

Recently MDFF and the fission cross sections () for the the 36,34S + 238U reactions were measured by the JAEA group nish08 ; nish10a . In the experiment, fission events were selected in which the momentum of projectile is fully transferred to the composite system. For these systems, the fission cross sections are almost equal to those of the projectiles captured inside the Coulomb barrier, .
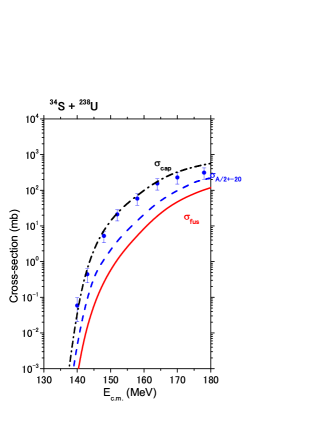
We first analyze these systems with the new model proposed in the previous section. The dashed-dot curve in Fig. 1 shows the calculated capture cross sections based on the coupled-channels model for the the reaction 36S + 238U as a function of the incident energy. The experimental data are taken from Ref. nish08 . As in Refs. nish06 ; nish04 ; hind95 ; nish08 , we use the computer code CCDEGEN hagi99 by taking into account the static deformation for 238U with (, )= (0.275,0.05). Couplings to the vibrational state at 3.29 MeV in 36S (with 0.61 rama87 ) and the state at 0.73 MeV in 238U (with spea89 ) are also considered. We use =105.0 MeV, =10.92 fm, =7.44 fm, and 0.75 fm for the Woods-Saxon potential, , given by Eq. (3). One can see that this calculation reproduces the measured cross sections down to the lowest incident energy below the Bass barrier ( MeV) bass74 .
The solid curve in Fig. 1 shows the fusion cross section obtained by the new model with CC and the Langevin equation. At the Bass barrier, we obtain for and . The dashed line shown in Fig. 1 denotes the cross section , which is derived from the yield of the fission fragments whose mass number is located within 20 around the symmetric fission . Notice that the fusion cross sections are significantly smaller than . This indicates that the mass symmetric fission does not necessarily originate from the compound-nucleus state.
In the previous study arit09 , we started the dynamical calculation with the spherical-spherical configuration in order to estimate the fission cross sections of the various kinds. Because the calculation using the Langevin equation is a classical one, this did not allow us to calculate the cross sections below the barrier. With the new approach, by considering the nuclear shapes at the contact configuration for each orientation, we can now obtain the cross sections also below the Bass barrier region.
Above the Bass barrier region, the calculated with the present model is about 7 times larger than that in the previous study arit09 . In the present model, the Langevin calculation is started at the touching point assuming all the kinetic energy has direction, while in the previous study, we started the Langevin calculation from a sufficiently large distance between the target and projectile and the orientation dependence was not considered. The previous results of smaller fusion probabilities are due to the loss of the kinetic energy in the approaching process by the friction.
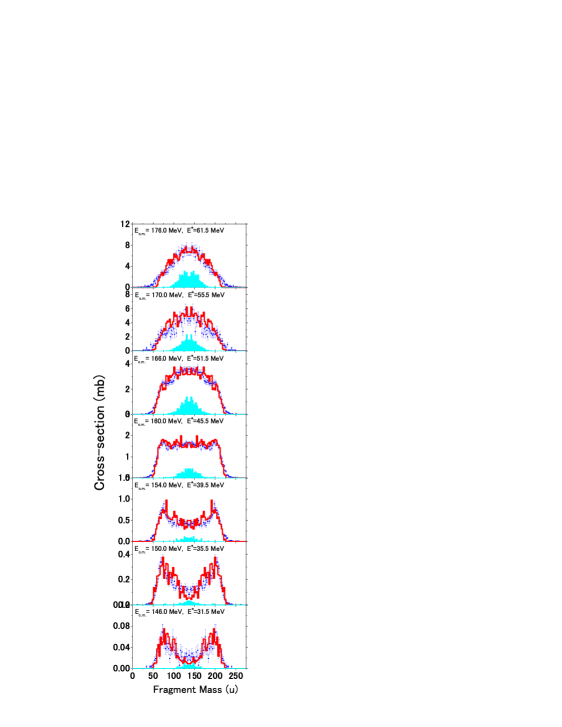
The results for the MDFF for the reaction of 36S + 238U are compared with the experimental data nish08 in Fig. 2 at seven incident energies from =148.0 (=31.5) MeV to =176.0 (=61.5) MeV (see the histograms). At high incident energies, the mass distribution has a Gaussian-like shape centered at the symmetric mass division, whereas the mass-asymmetric fission fragments dominate at low incident energies. The mass-asymmetric fission produces nuclei in the vicinity of the doubly-closed shell nuclei, 208Pb and 78Ni. The trend of the experimental data, i.e., the incident energy dependence of MDFF, is well reproduced by the calculation. The mass-asymmetry with 200 at sub-barrier energies is also well reproduced.
In Fig. 2 we also plot the fusion-fission events by the filled histograms. Apparently, the compound-nucleus fission has a mass-symmetric shape, and the observed mass-asymmetric fission dominated at the low incident energies is classified as QF. The strong energy dependence of the MDFF can be understood in terms of the orientation effect on the fusion and QF. The collision on the polar side have a large probability to disintegrate as QF, whereas the collision on the equatorial side have a larger fusion probability. The standard deviation of the spectrum for FF is =37.2 u at =176.0 MeV. This value is far smaller than that of the experimental spectrum, which also shows the Gaussian-like shape, indicating that there is a significant contribution of QF even at this low energy. The calculation also suggests that the measured mass-symmetric fission fragment has another origin than the compound nucleus fission. Such an event is defined as a deep quasi-fission process (DQF) as discussed in Ref. arit04 .
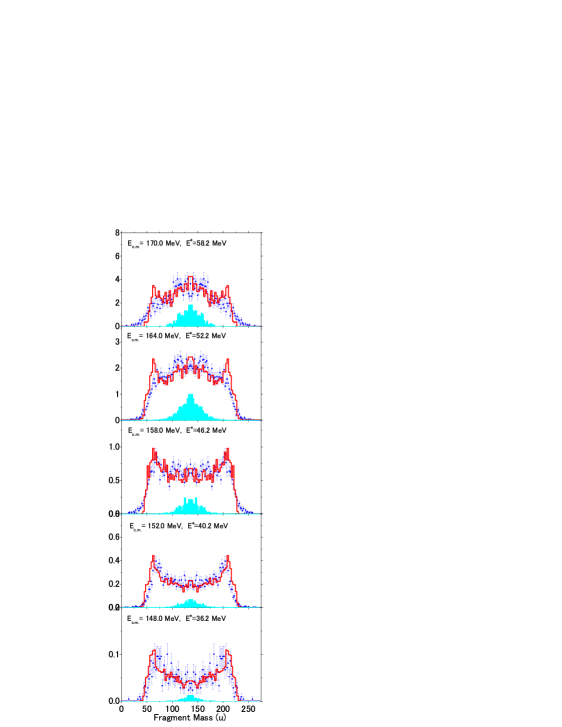
The results for the 34S + 238U reaction are shown in Figs. 3 and 4. In addition to the effects of the static deformation of 238U and the couplings to the 3- state in 238U, we also take into account the state at 2.13 MeV in 34S fire98 in the CC calculation. Figure 4 shows the MDFF for five incident energies between =148.0 (=36.2) MeV and =170.0 (=58.2) MeV. The Bass barrier for this reaction is MeV. The meaning of each curve in Figs. 3 and 4 is the same as in Figs. 1 and 2. The energy dependence of MDFF is qualitatively the same as in the 36S + 238U reaction, and the calculations again reproduce well the experimental data.
III.2 Reaction of 30Si+238U
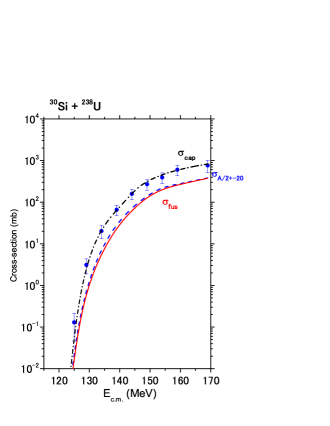
We next analyze the 30Si+238U reaction, for which the MDFF and the fission cross sections have been measured by the JAEA group nish10b . The present calculation for the capture cross section , fusion cross section and the mass-symmetric fission cross section are shown in Fig. 5 by the dashed-dot, solid and dashed curves, respectively. For the capture cross sections, similar parameters for CC are used as in the 34,36S + 238U reactions, except that the couplings to the vibrational state in 30Si are not taken into account. The present calculation for the capture cross sections reproduces quite well the fission cross sections down to the sub-barrier region below the Bass barrier, 141.1 MeV, better than the previous model calculation arit09 . The predicted fusion cross sections are about 5 to 7 times larger than the previous model arit09 due to the same reason as in the 34,36S+238U reactions discussed in the previous subsection.
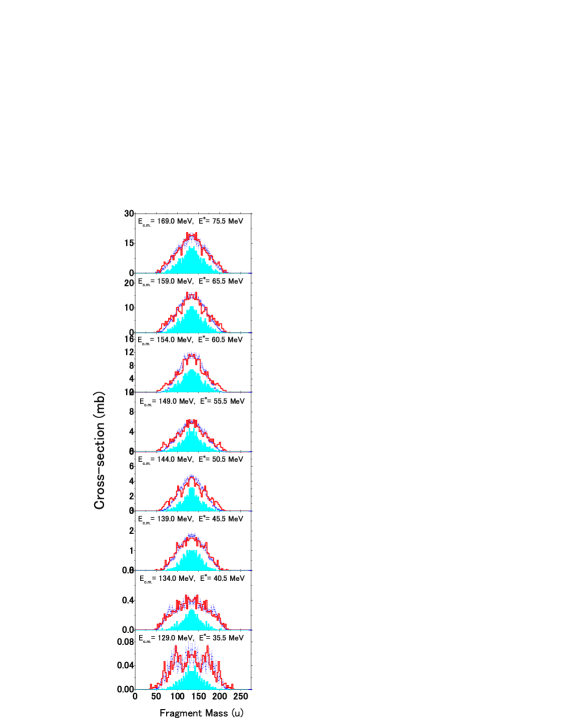
The calculated results for MDFF are shown in Fig. 6 by the histograms for eight incident energies () between 129.0 (35.5) MeV and 169.0 (75.5) MeV. We use the same parameters for the trajectory calculation as those for the 36,34S + 238U reactions. A significant difference in the measured MDFF between the 30Si + 238U and the 34,36S + 238U reactions is the mass-asymmetry in QF at subbarrier energies. The mass-asymmetry for the 30Si + 238U system is as shown in Fig. 6, whereas is and for the 34S + 238U and the 36S + 238U reactions, respectively (see Figs. 2 and 4). The QF fragments = 178/90 do not fit any shell closure of neutron rich nuclei. A production of these nuclei is therefore not associated with the local minimum of the potential energy attained by a larger binding energy of the nascent fission fragments at the scission point, but should originate from dynamical aspects in heavy-ion induced fission. This feature is well reproduced by the present calculation, in the entire energy range from above-barrier to sub-barrier. The standard deviation of the measured MDFF decreases from the highest incident energy down to the low energy of 139.4 MeV, then the value suddenly increases at the sub-barrier energies of 134.0 and 129.0 MeV. These trends are also reproduced by the calculation.
The calculated FF events are shown by the filled histograms in Fig. 5. It has a mass-symmetric distribution, and the standard deviation does not change through all the energy points. Therefore, the sudden broadening of the measured MDFF at sub-barrier energies can be attributed to the enhancement of the mass-asymmetric QF at = 178/90.
IV Analysis of the structure in the mass distribution of fission fragments
In the previous section, we have shown that the new model nicely reproduces the energy as well as the system dependence of MDFF. In this section, we discuss the origin for the difference in the mass-asymmetry in QF between the 30Si + 238U and 36S + 238U systems based on our model.
IV.1 Potential energy surface along the scission line
Let us first consider the potential energy surface for the two systems. Generally, the shape of MDFF from a compound nucleus is affected by the landscape of the potential energy surface, especially near the fission saddle point and the scission point wilk76 ; moll74 . On the other hand, for QF, the saddle point of the composite system is not passed by the system during the evolution of nuclear shape. A plausible explanation for the mass-asymmetry in QF may have something to do with the potential energy at the scission point as the exit point of the reaction process. Therefore, we focus on the landscape of the potential energy surface near the scission line.
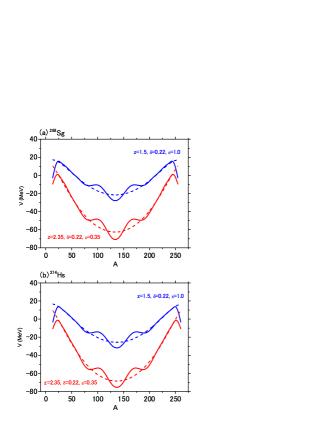
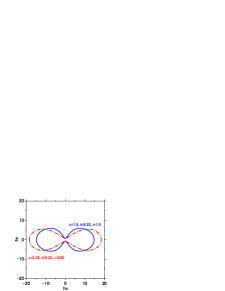
Figures 7(a) and (b) show the adiabatic potential energy surface near the scission point for the nuclei 268Sg (30Si + 238U) and 274Hs (36S + 238U), respectively. The dashed and solid curves correspond to the potential and with deformation of , respectively. This value of the deformation parameter is chosen since it reproduces well the available fission data as discussed in Refs. arit052 ; arit06 . As we mentioned in Sec. II B, the value of evolves from towards as a system approaches the compound-nucleus shape and fissions. The blue and the red lines show the potential surfaces for the configurations corresponding to these values of (=1 and 0.35), that is, (, )=(1.5, 0.22) and (, )=(2.35, 0.22), respectively. The solid and dashed-dot curves in Fig. 8 represent the corresponding nuclear shapes with a mass symmetry 0. Notice that for a faster process like QF, the system does not have enough time to reach and is maintained about 1.0 still at the scission point.
Even though the shell energy has a strong local minimum at (which corresponds to 208Pb) owing to the strong shell structure, the local minimum of appears at due to the parabolic shape of around for both 268Sg and 274Hs. One also finds another minimum at for both the nuclei. If the mass division were determined at the scission point, the mass-asymmetric QF should thus have appeared at and 188 for the reaction 36S + 238U and at and 184 for the reaction 30Si + 238U. These are not realized in the measured MDFF, however. The two peaks observed in the experiment are located at approximately and 200 in the reaction of 36S + 238U. Evidently, a prediction based only on the potential energy surface at the scission line is insufficient to explain the mass asymmetry in QF, indicating that the dynamical process plays an essential role to describe QF.
IV.2 Analysis of the reaction dynamics using probability distribution
We next discuss the probability distribution of the system in the deformation space. To this end, we segment the coordinate space with and . We define the distribution as an ensemble of Langevin trajectories. That is, we follow a trajectory as a function of time, and we increase the event number at each segment when the trajectory passes through that segment. By generating many trajectories, we construct a distribution of events on the deformation space.
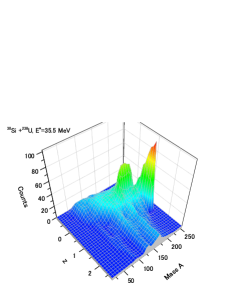
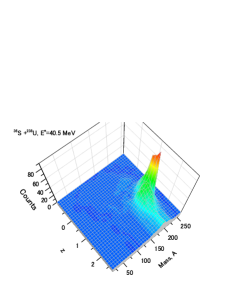
Figure 9 shows the distribution so constructed on the plane for the reaction 30Si + 238U at MeV with and . We consider the time evolution of the nuclear shapes as well as the mass number only for one of the fragments, that is, the one corresponding to the target-like nucleus. Even though this distribution is not a probability distribution, because it is not normalized in the whole space, we call the distribution “probability distribution”. From such probability distribution shown in Fig. 9, we can understand the overall trend of the dynamical evolution of nuclear shape, where the vertical axis of the figure means the number of events entering in the plane.
Two remarkable peaks are visible in Fig. 9. The peak located around corresponds to the touching point. All the trajectories start at this point, so that the number of events at this segment is large. The broadly distributed events in the smaller- region correspond to the trajectories trapped in the large- region as seen in Figs.LABEL:fig_2dim106aa (a) and (c). They are the trajectories that enter into a compact region defined by and , which correspond to in Fig. 5. We also see the yields which leads to scission at and 135 at , which correspond to the peaks of MDFF shown in Fig. 6. The peak at originates from QF, while the peak at originates largely from the FF, but also involves the component from DQF.
The probability distribution for the 36S + 238U reaction at MeV is shown in Fig.10. The spectrum is dominated by the mass-asymmetric QF. Similarly to the 30Si+238U reaction, the large peak corresponds to the touching point. Almost all the trajectories move quickly to the direction of binary decay as QF, and those which approach the compact nuclear shape with small value, corresponding to in Fig. 1, are significantly diminished. QF generates fragments around (at ) in this calculation, explaining the observed mass asymmetry of MDFF in Fig 2 at the lowest incident energy.
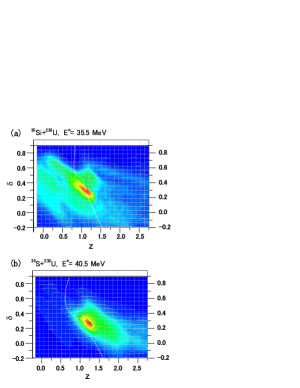
The probability distributions projected onto the plane are shown in Fig. 11(a) and (b) for the reactions of 30Si + 238U and 36S + 238U, respectively. The dashed curves denote the ridge lines. The positions at the strongest yield correspond to the touching points. In Fig. 11(a), the distribution crosses the ridge line and moves to the large- region. It spreads in the small- region and value distribute widely from 0.1 to 0.7. After surmounting the ridge line and entering in the compact nuclear shape region, a mono-nucleus with small -shape is formed, but its deformation fluctuates significantly due to the thermal fluctuation. The distribution for and corresponds to the formation of the compound nucleus. The 36S + 238U reaction shown in Fig. 11(b) has a much smaller chance to form the mono-nucleus as compared to the reaction 30Si + 238U, because of the smaller probability to overcome the the ridge line. Instead, the system quickly disintegrates as QF by forming fission fragments.
We can clearly observe that the fission fragments for the reaction 30Si + 238U are deformed with , because they include various events originating from QF, DQF and FF. On the other hand, for the 36S + 238U reaction, the value of the deformation parameter of the fission fragments are restricted mainly to , primarily because QF is the dominant channel.
From the analysis of the probability distribution, it is clear that the 30Si + 238U and 36S + 238U reactions at low incident energies are governed by significantly different reaction processes, that are reflected in the peaks of MDFF. For the former reaction, the peak at (the asymmetric peak) originates from QF, while the peak at (the symmetric peak) originates both from DQF and FF. On the other hand, the mass-asymmetric peak for the latter reaction is located at , originating predominantly from QF.
V Summary
We developed a new dynamical model to describe heavy-ion induced fission, in which the effects of static nuclear deformation of a target nucleus are taken into account by considering all the orientation angles of the symmetry axis of the target nucleus. The orientation effects are included both in the barrier penetration process and in the evolution of the nuclear shape. The former process is described with the coupled-channels model. After the nuclear contact point, we switch to the dynamical calculation starting at the touching point assuming a nose-to-nose configuration. The angle dependent touching distance is introduced in order to effectively simulate the orientation effects in the evolution phase of the nuclear shape. With this model, the calculation could be extended to energies below the Coulomb barrier for the first time.
In spite of the simplified assumptions, the calculation reproduced the measured MDFF for the reactions of 36,34S+238U and 30Si+238U, where a large variation of the distribution with respect to the incident beam energy are experimentally observed. By analyzing the Langevin trajectories, we could distinguish three different fission processes, QF, DQF and FF. The mass-asymmetric fission in 36S+238U at 74/200 observed at low incident energies are from QF. The mass-asymmetric fission with 90/178 in 30Si+238U observed at sub-barrier energy is also from QF, whereas the peak at the symmetric fission of =135 indicates that the fission occurs with some time delay and originates from FF and DQF. The calculation suggests the formation of a mono-nucleus with a small value but with a large collective fluctuation on the deformation axis of . A relatively long-life mono-nucleus is formed by the potential pocket appearing inside the ridge line. During the process of surmounting the ridge line, the mass asymmetry () of the system moves to the symmetric region. This can be an account for the measured mass asymmetry in QF in 30Si+238U. The trajectories for 36S+238U can not cross the ridge line and are directed to QF without forming the mono-nucleus, thus the mass-asymmetry is close to that of the entrance channel.
In this model, one can determine the fusion probability by selecting trajectories which enter the fusion box. The reproduction of the experimental MDFF in this model can be the ground to support the calculated fusion probability. Furthermore, the generalized formula proposed in this model has a potential to simulate any kind of heavy-ion induced reactions in the approaching phase, such as a nucleon-transfer reaction, and to predict cross sections for the production of new nuclei.
Acknowledgments
The authors are grateful to Prof. V.I. Zagrevaev, Prof. W. Greiner, Dr. A.V. Karpov, Dr. F.A. Ivanyuk, and Prof. F. Hanappe for their helpful suggestions and valuable discussions. Special thanks are due to Dr. A.K. Nasirov and Dr. A.S. Denikin for their helpful comments, and to the JAEA experimental group for providing us with the experimental data and for their helpful discussion. The diabatic and adiabatic potentials were calculated using the NRV code zagr07 . The numerical calculations were carried out on SX8 at YITP at Kyoto University. This work was supported by the Japanese Ministry of Education, Culture, Sports, Science and Technology by Grant-in-Aid for Scientific Research under the program number (C) 22540262.
References
- (1) W.D. Myers and W.J. Swiatecki, Nucl. Phys. 81, 1 (1966); A. Sobiczewski, F.A. Gareev, and B.N. Kalinkin, Phys. Lett. 22, 500 (1966).
- (2) Yu.Ts. Oganessian, Lecture Notes in Physcs (Springer Heidelberg) 33, 221 (1975).
- (3) S. Hofmann and G. Münzenberg, Rev. Mod. Phys. 72, 733 (2000); S. Hofmann et al., Eur. Phys. J. A 14, 147 (2002).
- (4) K. Morita et al., J. Phys. Soc. Jpn. 73, 2593 (2004).
- (5) Yu.Ts. Oganessian et al., Nature 400, 242 (1999); Phys. Rev. Lett. 83, 3154 (1999); Phys. Rev. C 62, 041604 (2000); Phys. Rev. C 63, 011301 (2000); Phys. Rev. C 69, 021601 (2004); Phys. Rev. C 72, 034611 (2005); Phys. Rev. C 74, 044602 (2006); Phys. Rev. C 76, 011601 (2007); Phys. Rev. Lett. 104, 142502 (2010).
- (6) S. Hofmann, D. Ackermann, S. Antalic, H.G. Burkhard, V.F. Gomas, R. Dressler, Z. Gan, S. Heinz, J.A. Heredia, F.P. Heßberger, J. Khuyagbaatar, B. Kindle, I. Kojouharov, P. Kuusiniemi, M. Leino, B. Lommel, R. Mann, G. Münzenberg, K. Nishio, A.G. Popeko, S. Saro, H.J. Schött, B. Streicher, B. Sulignano, J. Uusitalo, M. Venhart, and A.V. Yeremin, Eur. Phys. J. A 31, 251 (2007).
- (7) L. Stavsetra, K.E. Gregorich, J. Dvorak, P.A. Ellison, I. Dragojević, M.A. Garcia, and H. Nitsche, Phys. Rev. Lett. 103, 132502 (2009).
- (8) P.A. Ellison, K.E. Gregorich, J.S. Berryman, D.L. Bleuel, R.M. Clark, I. Dragojević, J. Dvorak, P. Fallon, C. Fineman-Sotomayorm J.M. Gates, O.R. Gothe, I.Y. Lee, W.D. Loveland, J.P. McLaughlin, S. Paschalis, M. Petri, J. Qian, L. Stavsetra, M. Wiedeking, and H. Nitsche, Phys. Rev. Lett. 105, 182701 (2010).
- (9) Ch.E. Düllmann, M. Schädel, A. Yakushev, A. Türler, E. Eberhardt, J.V. Kratz, D. Ackermann, L.-L. Andersson, M. Block, W. Brüchle, J. Dvorak, H.G. Essel, P.A. Ellison, J. Even, J.M. Gates, A. Gorshkov, R. Grager, K.E. Gregorich, W. Hartmann, R.-D. Herzberg, F.P. Heßberger, D. Hild, A. Hübner, E. Jäger, J. Khuyagbaatar, B. Kindler, J. Krier, N. Kurz, S. Lahiri, D. Liebe, B. Lommel, M. Maiti, H. Nitsche, J.P. Omtvedt, E. Parr, D. Rudolph, J. Runke, B. Schausten, E. Schimpf, A. Semchenkov, J. Steiner, P.Thörle-Pospiech, J. Uusitalo, M. Wegrezecki, and N. Wiehl, Phys. Rev. Lett. 104, 252710 (2010).
- (10) S. Mitsuoka, H. Ikezoe, K. Nishio, and J. Lu, Phys. Rev. C 62, 054603 (2000).
- (11) K. Nishio, H. Ikezoe, S. Mitsuoka, and J. Lu, Phys. Rev. C 62, 014602 (2000) ; K. Nishio, H. Ikezoe, S. Mitsuoka, K. Satou, and J. Lu, Phys. Rev. C 63, 044610 (2001).
- (12) V. Zagrebaev and W. Greiner, J. Phys. G 31, 825 (2005).
- (13) V. Zagrebaev and W. Greiner, J. Phys. G 34, 1 (2007); V. Zagrebaev and W. Greiner, J. Phys. G 34, 2265 (2007).
- (14) V. Zagrebaev and W. Greiner, Phys. Rev. Lett. 101, 122701 (2008); V. Zagrebaev and W. Greiner, Phys. Rev. C 78, 034610 (2008); V. Zagrebaev and W. Greiner, J. Phys. G 35, 125103 (2008).
- (15) K. Nishio, H. Ikezoe, S. Mitsuoka, I. Nishinaka, Y. Nagame, Y. Watanabe, T. Ohtsuki, K. Hirose, and S. Hofmann, Phys. Rev. C 77, 064607 (2008).
- (16) K. Nishio, H. Ikezoe, S. Mitsuoka, I, Nishinaka, Y. Watanabe, Y. Nagame, T. Ohtsuki, K. Hirose and S. Hofmann ,Proceeding of 6th Japan-Italy Symposium on Heavy Ion Physics, Tokai, Japan, 11-15 Nov. 2008, (AIP Conference Proceedings Vol. 1120) pp. 275-279.
- (17) K. Nishio, S. Hofmann, F.P. Heßberger, D. Ackermann, S. Antalic, Y. Aritomo, V.F. Comas, Ch.E. Düllmann, A. Gorshkov, R. Graeger, K. Hagino, S. Heinz, J.A. Heredia, K. Hirose, H. Ikezoe, J. Khuyagbaatar, B. Kindler, I. Kojouharov, B. Lommel, R. Mann, S. Mitsuoka, Y. Nagame, I. Nishinaka, T. Ohtsuki, A.G. Popeko, S. Saro, M. Schädel, A. Türler, Y. Watanabe, A. Yakushev, and A.V. Yeremin, Phys. Rev. C 82, 024611 (2010).
- (18) K. Nishio, H. Ikezoe, I. Nishinaka, S. Mitsuoka, K. Hirose, T. Ohtsuki, Y. Watanabe, Y. Aritomo, S. Hofmann, Phys. Rev. C 82, 044604 (2010).
- (19) Y. Aritomo, Phys. Rev. C 80, 064604 (2009).
- (20) M.A. Nagarajan, A.B. Balantekin, and N. Takigawa, Phys. Rev. C34, 894 (1986).
- (21) T. Rumin, K. Hagino, and N. Takigawa, Phys. Rev. C63, 044603 (2001).
- (22) K. Hagino and N. Rowley, Phys. Rev. C69, 054610 (2004).
- (23) K. Hagino, N. Rowley, and A.T. Kruppa, Comput. Phys. Comm. 123, 143 (1999).
- (24) P. Möller, J.R. Nix, W.D. Myers, and W.J. Swiatecki, Atomic Data and Nuclear Data Tables 59, 185 (1995).
- (25) J. Maruhn and W. Greiner, Z. Phys. 251, 431 (1972).
- (26) K. Sato, A. Iwamoto, K. Harada, S. Yamaji, and S. Yoshida, Z. Phys. A 288, 383 (1978).
- (27) Y. Aritomo and M. Ohta, Nucl. Phys. A 744, 3 (2004).
- (28) V.I. Zagrebaev, A.V. Karpov, Y. Aritomo, M.A. Naumenko, and W. Greiner, Physics of Particles and Nuclei 38, 469 (2007); NRV codes for driving potential, http://nrv.jinr.ru/nrv/.
- (29) A. Karpov, private communication.
- (30) H.J. Krappe, J.R. Nix, and A.J. Sierk, Phys. Rev. C 20, 992 (1979).
- (31) A.N. Ignatyuk, G.N. Smirenkin, and A.S. Tishin, Sov. J. Nucl. Phys. 21, 255 (1975).
- (32) J. Blocki, Y. Boneh, J.R. Nix, J. Randrup, M. Robel, A.J. Sierk, and W.J. Swiatecki, Ann. Phys. 113, 330 (1978).
- (33) J.R. Nix and A.J. Sierk, Nucl. Phys. A 428, 161c (1984).
- (34) H. Feldmeier, Rep. Prog. Phys. 50, 915 (1987).
- (35) K.T.R. Davies,A.J. Sierk, and J.R. Nix, Phys. Rev. C 13, 2385 (1976).
- (36) K. Nishio, S. Hofmann, F.P. Heßberger, D. Ackermann, S. Antalic, V.F. Comas, Z. Gan, S. Heinz, J.A. Heredia, H. Ikezoe, J. Khuyagbaatar, B. Kindler, I. Kojouharov, P. Kuusiniemi, B. Lommel, R. Mann, M. Mazzocco, S. Mitsuoka, Y. Nagame, T. Ohtsuki, A.G. Popeko, S. Saro, H.J. Schött, B. Sulignano, A. Svirikhin, K. Tsukada, K. Tsuruta, and A.V. Yeremin, Eur. Phys. J. A 29, 281 (2006).
- (37) K. Nishio, H. Ikezoe, Y. Nagame, M. Asai, K. Tsukada, S. Mitsuoka, K. Tsuruta, K. Satou, C.J. Lin, and T. Ohsawa, Phys. Rev. Lett. 93, 162701 (2004).
- (38) D.J. Hinde, M. Dasgupta, J.R. Leigh, J.P. Lestone, J.C. Mein, C.R. Morton, J.O. Newton, and H. Timmers, Phys. Rev. Lett. 74, 1295 (1995).
- (39) Modified version of the CCFUL code, K. Hagino et al., Comput. Phys. Commun 123, 143 (1999).
- (40) S. Raman, C.H. Malarkey, W.T. Milner, C.W. Nestor Jr., P.H. Stelson, At. Data Nucl. Data Tables 36, 1 (1987).
- (41) R.H. Spear, At. Data Nucl. Data Tables 42, 55 (1989).
- (42) R. Bass, Nucl. Phys. A 231, 45 (1974); Nuclear Reactions with Heavy Ions (Springer, 1980).
- (43) R.B. Firestone et al.,, Table of Isotopes (John Wiley & Sons, New York, 1998), 8th ed.
- (44) B.D. Wilkins, E.P. Steinberg, R.R Chasmann, Phys. Rev. C 14, 1832 (1976)
- (45) P. Möller, J.R. Nix, Proceedings of the Conference in Physics and Chemistry, Rochester, Vol.1, IAEA, 103 (1974). 37, 941 (2000).
- (46) Y. Aritomo, Nucl. Phys. A 780, 222 (2006).
- (47) Y. Aritomo and M. Ohta, Nucl. Phys. A 753, 152 (2005).