Local Tadpole Galaxies
Abstract
Tadpole galaxies have a giant star-forming region at the end of an elongated intensity distribution. Here we use SDSS data to determine the ages, masses, and surface densities of the heads and tails in 14 local tadpoles selected from the Kiso and Michigan surveys of UV-bright galaxies, and we compare them to tadpoles previously studied in the Hubble Ultra Deep Field. The young stellar mass in the head scales linearly with restframe galaxy luminosity, ranging from at galaxy absolute magnitude mag to at mag. The corresponding head surface density increases from several pc-2 locally to pc-2 at high redshift, and the star formation rate per unit area in the head increases from yr-1 kpc-2 locally to yr-1 kpc-2 at high . These local values are normal for star-forming regions, and the increases with redshift are consistent with other cosmological star formation rates, most likely reflecting an increase in gas abundance. The tails in the local sample look like bulge-free galaxy disks. Their photometric ages decrease from several Gyr to several hundred Myr with increasing , and their surface densities are more constant than the surface densities of the heads. The far outer intensity profiles in the local sample are symmetric and exponential. We suggest that most local tadpoles are bulge-free galaxy disks with lopsided star formation, perhaps from environmental effects such as ram pressure or disk impacts, or from a Jeans length comparable to half the disk size.
1 Introduction
Deep studies of galaxies over the past decade have revealed a variety of peculiar morphologies at high redshift (Abraham et al., 1996; Elmegreen et al., 2005; Conselice & Arnold, 2009). One type common in the early universe but rare today is the tadpole, first identified in the Hubble Deep Field by van den Bergh et al. (1996). Tadpoles consist of a massive star-forming clump at one end (the “head”) and a long diffuse region to one side (the “tail”). In the Hubble Ultra Deep Field (UDF), tadpoles constitute 10% (97 galaxies) of all the galaxies larger than 10 pixels in diameter (Elmegreen et al., 2007). They represent 6% of UDF galaxies identified by Straughn et al. (2006) and Windhorst et al. (2006) with an automated search algorithm. In the UDF tadpoles we studied, the heads have stellar masses of to and ages of yrs at redshift (Elmegreen & Elmegreen, 2010).
There are also tadpoles in the local universe. Blue compact dwarf (BCD) galaxies with tadpole shapes, sometimes called cometary (Markarian, 1969; Loose & Thuan, 1985; Cairós et al., 2001a, b), were designated sub-class iI,c by Noeske et al. (2000). Several examples are shown in the BCD study by Gil de Paz, Madore, & Pevunova (2003), and two more by Kniazev et al. (2001). A large fraction of extremely metal-poor BCDs (XBCDs) studied by Papaderos et al. (2008) and Morales-Luis et al. (2011) resemble tadpoles. The Kiso survey of UV bright galaxies (Miyauchi-Isobe, Maehara, & Nakajima, 2010) also contains tadpoles among those classified as irregular with blue clumps (Ic) or irregular with a single giant clump (Ig). Most of the present paper concerns the Kiso tadpoles, which amount to less than 0.2% of the Kiso sample (as discussed in Section 2.1).
Tadpole structure could have a variety of origins. Some tadpoles could be edge-on disks with a single massive star-forming region at one end. Elmegreen & Elmegreen (2010) showed lopsided ring-like galaxies that would look like tadpoles if viewed edge-on. Tadpoles could also result from mergers (Straughn et al., 2006; Windhorst et al., 2006) like the famous case of UGC 10214, which is called the Tadpole Galaxy. Another example is II Zw 40 (Baldwin, Spinrad, & Terlevich, 1982; Brinks & Klein, 1988). However, Campos-Aguilar et al. (1993) suggest that blue compact dwarf galaxies tend to be relatively isolated, so the tadpole shapes among these may not generally be mergers. Papaderos et al. (2008) also suggested that XBCD tadpoles are not mergers, because of the lack of tidal features.
Another possibility is that the lopsided starburst results from ram compression by motion through an intergalactic medium. There are two possibilities. First, tadpoles could be gas-poor disks with star formation triggered on the leading side and the rest of the disk visible as a red tail of older stars. Then the center of mass would be near the center of the underlying red disk, which is somewhere between the head and the tail. Alternatively, they could be heavily stripped galaxies with star formation and old stars at the leading edge, perhaps still centered on a dark matter core, and a tail made mostly from star formation in the stripped gas. Then the tail would be blue. Both cases are interesting because then tadpoles could be used as tracers of intergalactic gas. In this interpretation, tadpoles are more common at high redshift because the intergalactic medium is denser there (Elmegreen & Elmegreen, 2010). For example, the scenario in which dwarf Irregular galaxies are converted into dwarf spheroidal galaxies in the gaseous halos of larger galaxies (Lin & Faber, 1983; van den Bergh, 1994; Grebel et al., 2003; Mayer et al., 2006; Weisz, et al., 2011), or in the hot intergalactic gas of galaxy clusters (Boselli et al., 2008; van Zee et al., 2004), could involve a tadpole phase for the dwarf as the gas and young stars are pulled behind. IC 3418 in the Virgo cluster may be an example of this (Chung et al., 2009; Hester, 2010; Fumagalli, et al., 2011).
A third possibility is that some tadpoles are normal galaxies with a large turbulent Jeans length for gravitational collapse of the interstellar medium. The ratio of the Jeans length to the galaxy size is approximately the square of the ratio of the gas velocity dispersion to the rotation speed. Galaxies with relatively large Jeans lengths have big star formation clumps, and there is only room for a few of these clumps in the disk. Local dwarf Irregulars and BCDs are like this because of their low rotation speeds, while young massive galaxies are like this because of their high velocity dispersions (Förster-Schreiber et al., 2006; Elmegreen et al., 2009). If there is only one clump at any particular time, then the resulting star formation will appear lopsided. From the right perspective, such a galaxy may look like a tadpole.
In this paper, we examine tadpole galaxies in the local universe for comparison with high redshift tadpoles. We determine star formation rates and surface densities in the heads and tails as a function of galaxy mass and luminosity to see whether the star formation is bursting now or relatively quiescent, and to see whether the tails are redder and older in the local galaxies than at high redshift. If tadpole structure is a phase of galaxy evolution and local tadpoles are caused by the same events or processes as high redshift tadpoles, then detailed studies of the local tadpoles may help illuminate these processes at high redshift.
2 The Sample and Analysis
2.1 Sample selection
The Kiso Survey for Ultraviolet-Excess Galaxies (Miyauchi-Isobe, Maehara, & Nakajima, 2010) detected several thousand UV-bright galaxies from ultraviolet and red images taken with the Kiso Schmidt telescope. The survey categorized galaxy morphologies into several types using the Palomar Observatory Sky Survey and the Sloan Digital Sky Survey (SDSS; Stoughton et al. 2002). The Kiso survey has 176 Ic galaxies and 83 Ig galaxies, amounting to 2.6% of the total 9908 Kiso galaxies. Of the 259 Ic and Ig types, 158 are in SDSS: these include 111 out of the 176 Ic types, and 47 out of the 83 Ig types. We examined these 158 galaxies on the SDSS images. Many of the galaxies in these Ic and Ig categories are spiral galaxies with one or more bright star-forming regions. Others are irregulars with bright star formation, or likely interactions and mergers. A small number are lopsided with a bulge and inner disk that is offset from the outer disk (e.g., KUG0226+251B, KUG1129+144), or with bright star formation only on one side (KUG2306+227). We chose galaxies for the present study that are so lopsided that their brightest clump is far to one end and the rest of the galaxy is mostly featureless, meaning that it has no bulge or other significant star formation elsewhere. We consider these galaxies to be local tadpoles. We are interested in measuring their properties and comparing them to high redshift tadpoles.
Among the 158 Ic and Ig galaxies in SDSS, 95 have SDSS-DR7 spectra (Abazajian et al., 2009), and of these, 13 are good cases of tadpoles: 4 of type Ic and 9 of type Ig. Of the remaining 63 without spectra, we identify one more tadpole (KUG0010+371). If we consider this fraction of 14 tadpoles out of 158 Ic and Ig galaxies in SDSS to be representative, and extrapolate to the 259 Ic and Ig galaxies in Kiso, then the percentage of tadpoles among the 9908 galaxies in Kiso is %. This is much smaller than the 10% tadpoles in the UDF.
Each of the 13 tadpoles in our Kiso sample with SDSS spectra shows emission lines. The Kiso survey divides galaxies into bins of H (high), M (medium), and L (Low) for the emission line strengths; 12 of our 13 tadpoles with spectra have high emission and one (Kiso 6610) has medium emission. For reference, 82 of the 211 Ic and Ig galaxies fall into the H category. We also viewed all BCD types iI,c (Noeske et al., 2000) listed in NED111NASA/IPAC Extragalactic Database, http://ned.ipac.caltech.edu/ that were also in SDSS. One more tadpole with a known distance was selected, UM 417, which is from the University of Michigan IV survey of emission line objects (McAlpine & Lewis, 1978). In the rest of this paper, we measure the properties of these 14 galaxies with known distances (i.e., 13 Kiso galaxies + 1 UM galaxy).
Archival images and spectra of these local tadpole galaxies were downloaded from the SDSS survey. The images include 5 passbands (Gunn filters ) taken with the 2.5m telescope at Apache Point, NM. Photometric measurements on sky-subtracted images were done with IRAF (Image Reduction and Analysis Facility) to determine the masses and ages of the clumps and tails, as described in 2.4. The spectra have resolution 2000 and cover an area 3′′ in diameter in the galaxies. Given the distances of our targets (Table LABEL:tab1), 3′′ represents a linear scale between 0.1 and 2.5 kpc, with a typical value of around 0.5 kpc. These spectra were used to estimate H star formation rates, as described in Section 3.2. The SDSS spectral resolution corresponds to a velocity dispersion on the order of 70 km s-1. The H fluxes are independent of this dispersion, because they are based on an integral over the emission line.
2.2 Galaxy Morphology
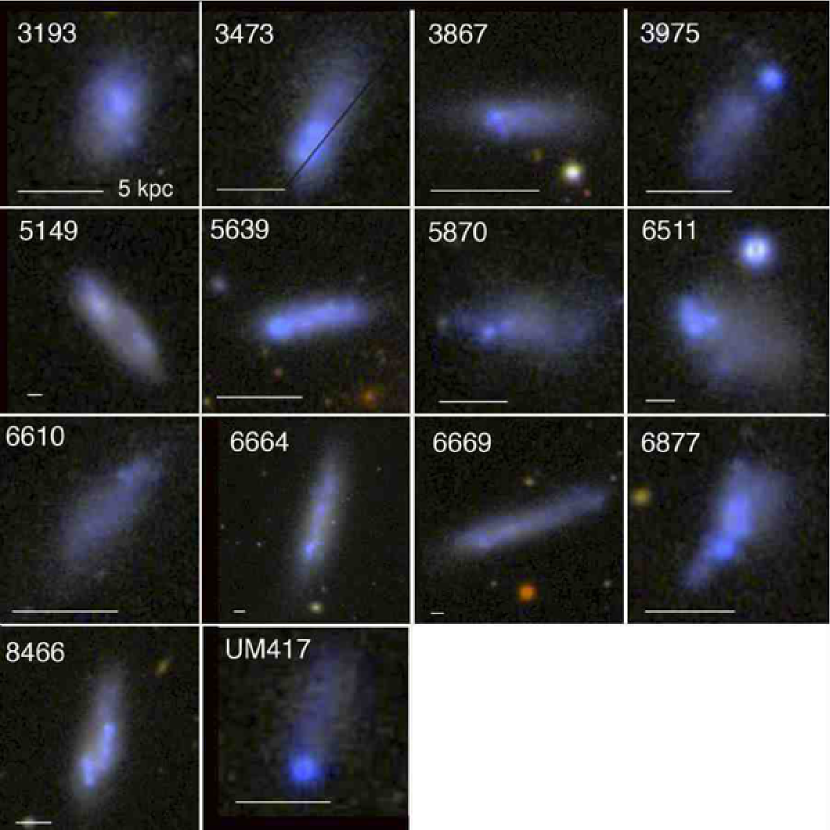
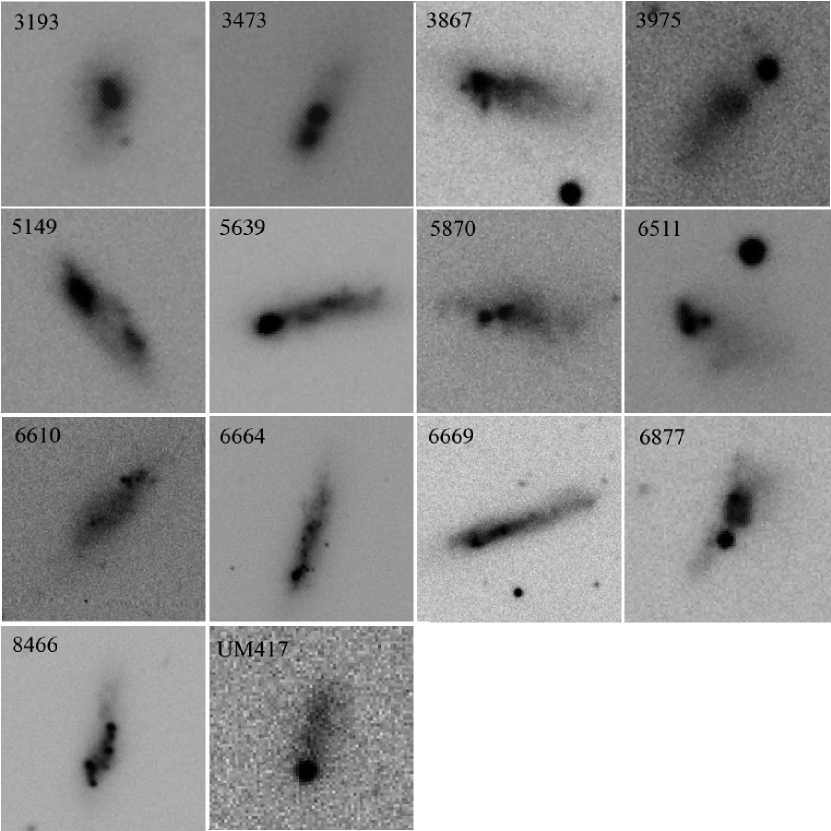
The fourteen local tadpole galaxies in this study are shown in color in Figure 1 and in grayscale in Figure 2, and listed in Table LABEL:tab1. The KUG numbers come from the Kiso2000 catalog Nakajima et al. (2010). For convenience we also give a Kiso number, which is the catalog entry number minus 1.
The tadpoles in Figure 1 are dominated by a large star-forming region on one side, sometimes with sub-clumps, and by a diffuse tail, which might also contain a few clumps. Some of the underlying galaxies are elongated, such as Kiso 3473, 3867, 3975, 6664, 6669, and UM 417. Others are rounder, such as Kiso 3193 and 6511. Galaxies 5149, 6664, and 6669 differ from the others in being larger and more elongated, suggesting a highly inclined disk. Others could be disks too, although some look too irregular in the tails to be disks.
The smaller star-forming clumps are more easily seen in the grayscale images than in the color images. Galaxies Kiso 3975 and UM 417 (Cairós et al., 2001a, b) contain only one large round clump in the head that is not obviously subdivided. Galaxies Kiso 3473 and 6877 have large head regions with two sub-clumps in each. Kiso 5870 has a small star-forming region in the head and other clumps elsewhere, including the tail. Kiso 6610, 6664, 6669, and 8466 have many small clumps over fairly large regions, while Kiso 3867 and 6511 have many small clumps in their heads.
Five of these galaxies have been imaged in H in previous studies: Kiso 3473 and UM 417 (Gil de Paz, Madore, & Pevunova, 2003), Kiso 6511 and 6664 (Heller, Almoznino, & Brosch, 1999), and Kiso 8466 (Gavazzi et al., 1998), which are all BCD galaxies. Their H emission stands out in the images just in the bright head regions and not in the tails. Heller et al. (2000) studied lopsidedness in local dwarf Irregular galaxies and found that random star formation could account for the asymmetry distributions they observe in low surface brightness galaxies, but not in BCDs, which have more centrally concentrated star-forming regions. Their BCDs include three tadpoles, Kiso 6664 in our sample plus Mrk 5 and UM 133.
Although many star-forming galaxies at high redshift are large, the UDF tadpole galaxies tend to be the smallest of the clumpy types, with diameters ranging from 1 to 10 kpc and averaging about 4 kpc (Elmegreen & Elmegreen, 2010). The local tadpoles selected for the present paper have larger average sizes than the UDF tadpoles, with diameters ranging from 3 to 45 kpc based on their isophotes, as described in Section 2.3. Still, most of the tadpoles are fairly small. Table LABEL:tab1 indicates an average kpc and a median kpc, where is the radius out to a surface brightness in of 25 mag arcsec-2. Excluding the four largest tadpoles in our sample (radii greater than 10 kpc), the remaining ten tadpoles have average and median radii of 2.7 kpc, so their corresponding average diameters of 5.4 kpc are only slightly larger than the UDF tadpoles.
2.3 Radial profiles
The radial light distributions are complicated in tadpole galaxies; the galaxies are asymmetric and the profiles do not have a continuous slope, so it is difficult to measure a Sérsic index in a meaningful way. Nevertheless, the Sérsic index for UM 417 was measured by Amorin et al. (2009) to be 0.680.12. For comparison, Sérsic indices of high redshift clump galaxies are typically 1 (e.g., Elmegreen et al. 2007). These rather flat disks are in contrast to the tadpole BCDs Mrk 59 and Mrk 71, which Noeske et al. (2000) found to have symmetric exponential profiles beneath the starbursts.
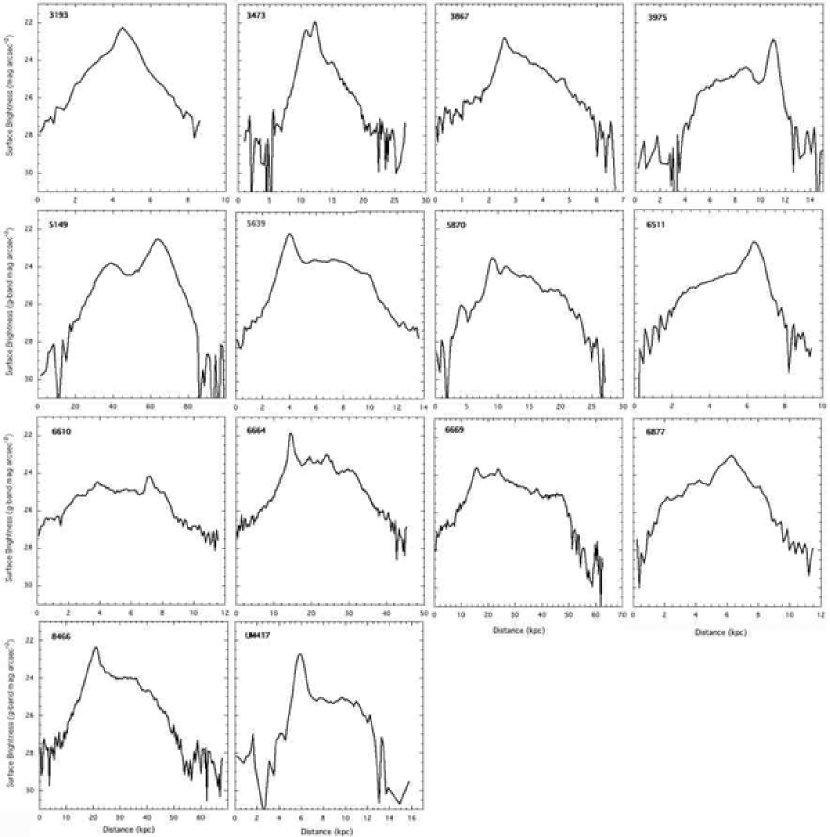
For the local tadpoles in our sample, intensity profiles were made to examine the light distributions in the outer parts of the galaxies. Cuts were taken along the major axis, through the peak intensity of the head. The intensity cuts were five pixels wide, corresponding to 5.75′′, to reduce the noise. The major axes of the galaxies were determined by eye from contour plots and grayscale -band images. The -band surface brightness profiles are shown in Figure 3 (other filters have similar profiles). The head is clearly an excess intensity on one side. For all but Kiso 3193, the galaxy intensity does not decrease exponentially and symmetrically away from a central position defined by the outer isophotal contours. The profiles are usually flat or have a shallow exponential decrease on one side of the head in the central third of the galaxy. They have sharper drop-offs beyond mag arcsec-2 and can be traced to mag arcsec-2 in all SDSS filters. The radii of the galaxies, out to a surface brightness of 25 mag arcsec-2 in band, are listed Table LABEL:tab1. These are determined from the diameter of the galaxy to this limiting surface brightness based on the radial profiles shown in the figure; that is, they are the half-length of the major axis contours out to a surface brightness of 25 mag arcsec-2 in band. The surface brightness of the sky background is typically 28 to 28.5 mag arcsec-2 in band. The sharper drop-offs at the edge are approximately exponential.
We fit piece-wise exponentials to the intensity profiles in Figure 3. Three pieces were considered: the relatively flat inner part of the galaxy outside the head, and the two relatively steep outer parts beyond mag arcsec-2 in the left and right extremes of the radial profiles in Figure 3. Table LABEL:tab2 lists the scale lengths , the scale lengths relative to , and the number of scale lengths in the fitted regions. The inner parts of the disks have large /, reflecting the flatness of the diffuse distributions seen in Figure 3. The extreme cases are represented by Kiso 8466 and UM 417, with length scales in excess of 100 kpc. The inner disk scale length in Kiso 5149 was not measured because there are two bright clumps in the profile there.
Table LABEL:tab2 shows that the left and right outer scale lengths are often similar to each other and much smaller than the inner scale lengths. This similarity between the far-outer scale lengths suggests there is a faint underlying symmetric structure, like a disk. In Kiso 3193 and 3867, the slopes are about the same in the inner and outer parts. The profile of UM 417 was measured by Cairós et al. (2001a) as part of a photometric study of the light distributions in 28 BCDs; its scale length in that paper matches our value for the left side of the galaxy.
2.4 Photometry
Photometric procedures for measuring the local tadpoles were the same as those used in our previous studies of UDF high redshift galaxies. Heads were measured with the task imstat by defining a rectangle around the largest star-forming complex in each galaxy, which generally contained more than one resolved sub-clump. This task gives the average surface brightness in a pixel, which is multiplied by the total number of pixels in a clump to determine the magnitude in a given filter. For comparison we also measured the head magnitudes with circular apertures in the apphot task. These two measurements gave the same results, differing by less than the measuring error of 0.1 mag. The rectangular results are presented in the figures since this is the same method used for high redshift galaxies. Individual sub-clumps in the heads and small clumps in the tails were also measured with imstat. The average intensity of the brightest clump in each galaxy is about 10 times the average intensity of its tail, and about 50 above the tail intensity variation.
Clump emission was determined in two ways. In one method, just the sky was subtracted. In the second method, we assumed the clumps are sitting in disks, and subtracted a smooth component of the galaxy from the clump to obtain the emission from the star-forming part alone. For this subtraction, we used the average tail surface brightness from a section between clumps inside the tail, measured in a rectangular region with imstat. This is appropriate if the head or clump is superposed on a stellar disk which extends into the tail. Subtracting the underlying component usually makes the clumps bluer and therefore younger and less massive than with sky subtraction alone. The quantitative differences are discussed in Section 2.5 below. The clump and tail surface brightnesses were also used to determine surface densities, discussed in Section 3.1.
In addition, the total magnitudes of the tails were determined from a rectangular outline enclosing the whole tail, minus the sky emission. These total magnitudes were used to determine tail ages and masses, as described below.
2.5 Population synthesis fits
Masses, mass surface densities, ages, and extinctions were estimated from our photometry by fitting the data to population synthesis models from Bruzual & Charlot (2003). To determine the model colors, we integrated over the low resolution spectra in Bruzual & Charlot (2003), weighted by the Gunn filter functions, and assumed a constant star formation rate back to some starting time, which is identified with the region age. The Chabrier IMF was also assumed. A range of extinctions was used for the models, following the wavelength dependencies in Calzetti et al. (2000) and Leitherer et al. (2002). We used a metallicity of 0.4 times solar since we expect these small galaxies to have slightly sub-solar metallicity. This metallicity matches what is observed based on emission line flux ratios in the BCD galaxy Mrk 1418 (Cairós et al., 2009). We also ran models with decaying star formation rates and with metallicities of 0.02 solar, 0.2 solar, and solar metallicity for comparison. The final values for mass, age, and extinction were determined as the weighted average of the different models in our standard case (i.e., constant star formation rate and metallicity of 0.4 solar), using a weighting function for equal to the quadratic sum of the differences between the model and observed colors, normalized to the relative dispersions for each color from the tail observations. The weighted averages were done only for the models with the lowest rms deviations from the observations, as determined by binning the rms deviations in intervals of 0.02. The mass follows from the observed magnitude in comparison to the model. The surface densities in the clumps are taken to be the masses divided by the projected areas.
To determine the effects of background subtraction and metallicity on ages and masses, we make the following comparisons. First consider the results for solar metallicity. When only the sky brightness is subtracted, the average (age) of the heads is (for age in yr). When the sky is subtracted along with an underlying component equivalent to the average tail brightness, the heads are younger on average, . (The rms errors are the quadratic sum of the rms errors for each galaxy and the rms of the average of the different galaxies.) For 0.4 solar metallicity, these values of (age) are and , respectively. Lower metallicity increases the calculated age because low metal stars are intrinsically bluer than high metal stars, so their ages have to be larger to get the same observed colors. The head ages with only the sky subtracted are older than the head ages with both the sky and an underlying red emission subtracted, because the head still contains old and red emission when only the sky is subtracted.
The average (mass) of the heads is (for mass in ) when only the sky brightness is subtracted for solar metallicity. The heads are less massive, , when the sky and underlying red component are subtracted. For 0.4 solar metallicity, these log(mass) values are and , respectively. Thus, decreasing metallicity hardly affects the clump masses. Removal of a red underlying component decreases the clump masses by an average factor of .
For whole tails with sky subtracted, the average log(age) is much older than the heads, , , , and for metallicities of , , and solar, respectively, not counting the galaxy UM 417. For UM 417, the tail log(age) is much less than the others, , and it has a much larger uncertainty than the others, , for the highest three metallicities. At 0.02 solar for UM 417, the log(age) is like the others, . Aside from UM 417, the metallicity does not affect the tail age much.
Also for the whole tails with sky subtracted, the average log(mass) among the sample is , , , and for the four metallicities, respectively, whether or not UM 417 is included. Thus, tail masses do not have a strong systematic dependence on metallicity either.
The average equivalent -band extinctions in the heads with the underlying disk subtracted are , , , and for metallicities of , , and solar, respectively. For the tails, the extinctions are , , , and , respectively.
Models with decaying star formation rates have ages that are slightly less than the models with constant rates. This is because a decaying rate has proportionately less star formation today than a constant rate, and therefore needs to start more recently to end up with the same observed colors. For models of the head with both sky and an underlying emission subtracted, and for 0.4 solar metallicity, the log of the age decreases by 0.02, 0.06, and 0.22 as the decay time decreases from infinity (i.e., constant star formation rate) to yr, yr, and yr, respectively. For the whole tails with sky subtracted, the log of the age decreases by 0.20, 0.18, and 0.62, respectively. The masses are relatively unchanged along this sequence, with the log of the mass changing by less than 0.01 for the heads, and by 0.1 to 0.2 for the tails. These examples indicate that the ages and masses we discuss below are not very sensitive to the star formation history.
In general, the age of an extended region is difficult to determine accurately from the small number of broad-band magnitudes used here. The mass estimates are more reliable because extinction and age compensate for each other in the conversion from color to mass. In what follows, we use head and clump values with an underlying sky and disk subtracted because we are interested in the star formation components. We also use 0.4 solar metallicity for the discussion below and for the ages and masses in Table LABEL:tab3, because many of the tadpoles are small galaxies. The star formation rate is assumed to be constant to minimize the number of free parameters.
3 Results
3.1 Head and Tail Masses and Surface Densities
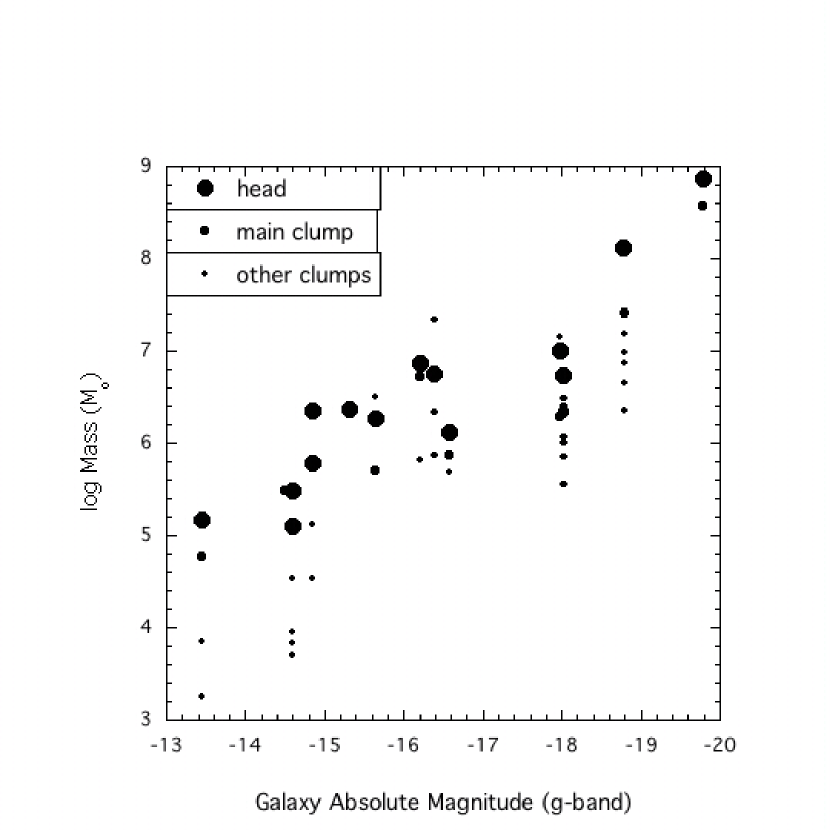
Stellar masses of the tadpole heads are listed in Table LABEL:tab3. They range from a few to a few . Some of the heads resolve into sub-clumps, as in Kiso 6511. Figure 4 shows, as a function of galaxy -band absolute magnitude, the masses of the heads, the masses of the brightest single clumps in the heads, and the masses of all the other clumps. The most massive clumps are larger in more luminous galaxies. This trend is partly a selection effect because the galaxies are chosen to have similar morphologies – all of the features in the morphology are larger for larger galaxies.
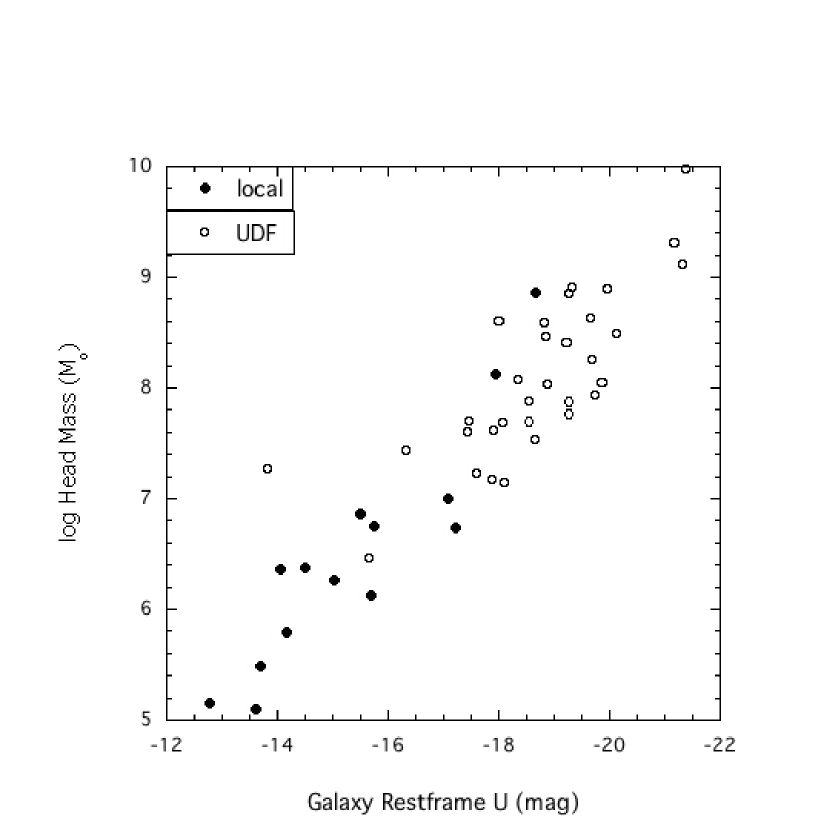
Figure 5 shows the log of the head masses for both local and high redshift tadpoles as a function of the restframe magnitude. The magnitude is determined for the high redshift galaxies from an interpolation of the observed magnitudes in ACS or NICMOS filters, depending on the redshift (which is from Rafelski et al., 2009). The magnitude for a local galaxy is assumed to be the absolute magnitude determined from the image, using the distances listed in Table LABEL:tab1. The heads in the local tadpoles are, in general, less massive than the heads in high redshift tadpoles (Elmegreen & Elmegreen, 2010). In all cases, the head mass is approximately proportional to the galaxy luminosity. The brightest local tadpoles overlap the range for the high redshift tadpoles, and in those cases the head masses are comparable locally and at high . The two brightest local tadpoles are Kiso 5149 and Kiso 8466. Kiso 5149 is one of the largest galaxies in the local sample, with a radius of 22.9 kpc. This galaxy looks different from the others in being redder and older. Kiso 8466 has a massive head with many smaller clumps over a large region, which at high would appear as one or perhaps two large clumps. The scaling in Figure 5 is partly a selection effect based on the similar morphologies of low and high redshift tadpoles.
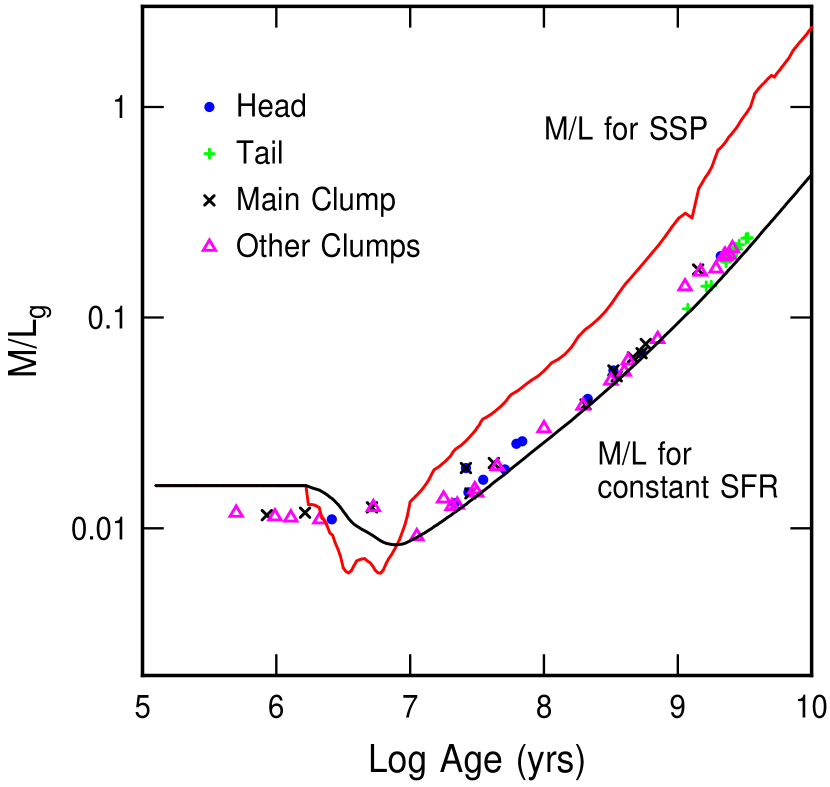
The ratio of mass to -band luminosity, , is shown as a function of fitted age for the heads, tails, main clumps, and other clumps, in Figure 6. The four galaxy components discussed in Figure 4 are shown by different symbols. increases smoothly with age, as expected for population synthesis models. The top curve is the ratio for single stellar population (SSP) models with a single burst of star formation at the time on the abscissa, made using tables in Bruzual & Charlot (2003). The bottom curve is for an integral of the SSP model over time from the present back to the time on the abscissa. from the fits of the model to the observed colors matches the integrated case, as it should, because we assume a constant star formation rate over the age of the region. There is a clear separation between the tails, which have an average log(age) of for ages in years and average , and the heads, which have an average log(age) of and .
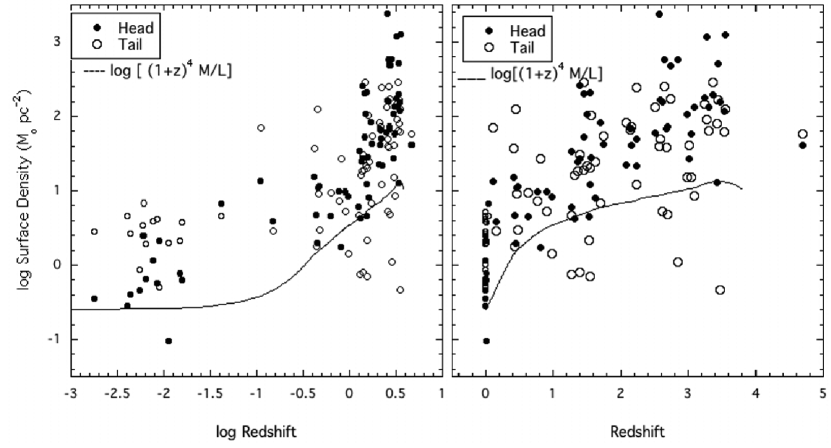
The head surface densities, , in units of pc-2, are listed in Table LABEL:tab3 and shown as filled circles in Figure 7 as a function of redshift. The surface densities range from pc-2 to pc-2 for the local tadpoles, with a mean value of pc-2. The UDF tadpoles are shown as open circles for comparison; their values range from pc-2 to pc-2. Below redshift , the UDF tadpoles have pc-2 to pc-2, only slightly higher than the local tadpoles. The left-hand panel shows log redshift on the abscissa to emphasize the local tadpoles, while the right-hand panel shows linear redshift to emphasize the UDF tadpoles. The average steadily increases with redshift. This increase is consistent with the increasing star formation rate in the universe, which peaks between (Madau, 1998; Bouwens et al., 2011). This suggests that tadpoles are more gas-rich at earlier times, like other galaxies.
The general increase of surface density with redshift is partly a selection effect. Surface density is measured from surface brightness, and higher redshift galaxies need higher intrinsic surface brightnesses in order to be seen. This is primarily because of cosmological surface brightness dimming. Our previous studies (Elmegreen et al., 2009) showed a systematic increase in intrinsic surface brightness as , which is the expected selection effect. Surface mass density does not increase as rapidly because the disks get younger and their ratios decrease with .
The curve in Figure 7 plots log with redshift, obtained from the spectral models in Bruzual & Charlot (2003) with the -band SDSS filter band-shifted into the restframe -band as redshift increases. This bandshifting was done by redshifting the model galaxy spectrum while keeping the wavelength distribution function of the filter constant. Intervening hydrogen absorption is included (Madau, 1995). The plotted function shows the redshift trend for the threshold mass surface density at a fixed limit of observed surface brightness, equal to 1 pc-2. The galaxies tend to lie above this line because their surface brightnesses are larger than this fiducial value. The model assumes that star formation starts at and is continuous until the galaxy is observed at some lower redshift . The initial increase in with increasing is mostly from . There is a slight bump above this trend at because has a peak there, as follows. At lower , increases with increasing because the age of the star-forming region decreases from 4.3 Gyr (at ) to 3.7 Gyr (at ) and drops faster than as the restframe passband moves from green into the aged blue and ultraviolet parts. At higher than , decreases with increasing because the stellar population gets younger and bluer with decreasing age, continues to decrease steadily, and increases as the restframe passband moves into the ultraviolet where the young stars are brightest.
Tail masses and surface densities are listed in Table LABEL:tab3. Tail masses are on average a factor of 12 times larger than head masses because the tails are larger in area and surface density than the heads. The tail stellar surface densities are shown as open circles in Figure 7. The larger tail surface densities follow from the older tail ages and the higher (Fig. 6) for the tail compared to the head. Some of the tails have clumps that are included in the category of “other clumps” in Figure 4.
The tails have a mean mass surface density of pc-2 seen in projection (not corrected for inclination). The mean surface density for the high tails is about the same, pc-2, but there are many with higher surface densities at high . These high- surface densities include corrections for surface brightness dimming and intervening hydrogen absorption.
The ages of the tails differ at low and high redshift. Local tadpole tails have ages of 1-3 Gyr (the of the average age in Table LABEL:tab3, in years, is 9.20.8, or without UM 417), while high redshift tails have ages of Gyr. The high- systems are visible because of their greater luminosity per unit mass.
The heads have about the same ages for local and high redshift tadpoles, Gyr. These ages are reasonable for giant star-forming regions. The head and tail ages are similar at high redshift but different at low redshift because the UDF galaxies are younger overall than the local galaxies.
For high tadpoles, the average of the log of the ratio of tail surface density to head surface density is . For local tadpoles, the average of the log of the ratio is much higher, . The increase in tail-to-head surface density ratio with decreasing redshift indicates that the head star formation rate per unit area gets smaller compared to the tail surface density as the redshift decreases. This is the expected trend if tadpoles are normal galaxies with a gas fraction that decreases and a stellar mass that increases over time. The same is true for star formation in other local galaxies: star complexes today contain only a few hundredths of the surface density of their surrounding disk, whereas high redshift star-forming clumps contain a comparable surface density or more (Elmegreen et al., 2009).
The surface densities of both the star-forming heads and the tails of local tadpole galaxies are much smaller than the stellar surface densities of local spirals, which are pc-2. In the solar neighborhood, it is pc-2 (Freeman, 1987) for the thin disk component. Low surface brightness galaxies and local dwarf irregulars have surface densities as low as those observed for local tadpole tails. Zhang et al. (2012) find pc-2 for 34 dwarf irregulars. This similarity in surface density between local tadpoles and dwarf irregulars is consistent with the small sizes of the local tadpoles, as indicated by in Table LABEL:tab1.
3.2 Star formation rates
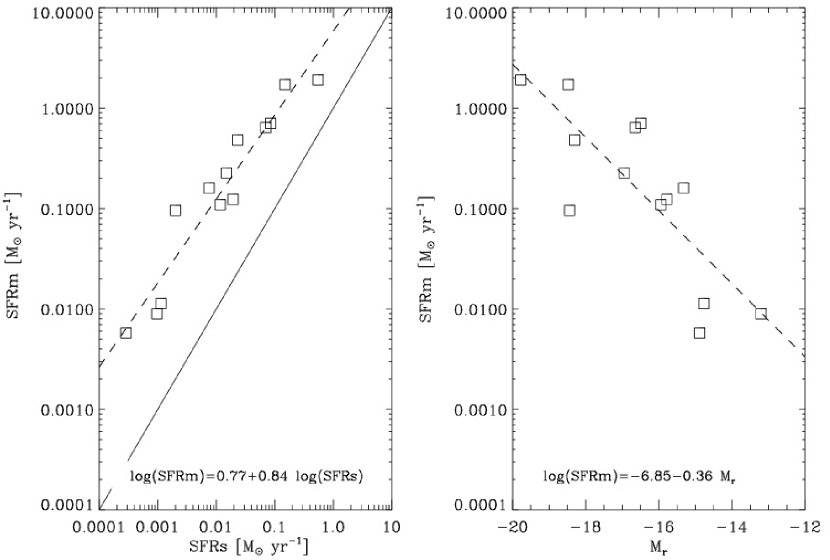
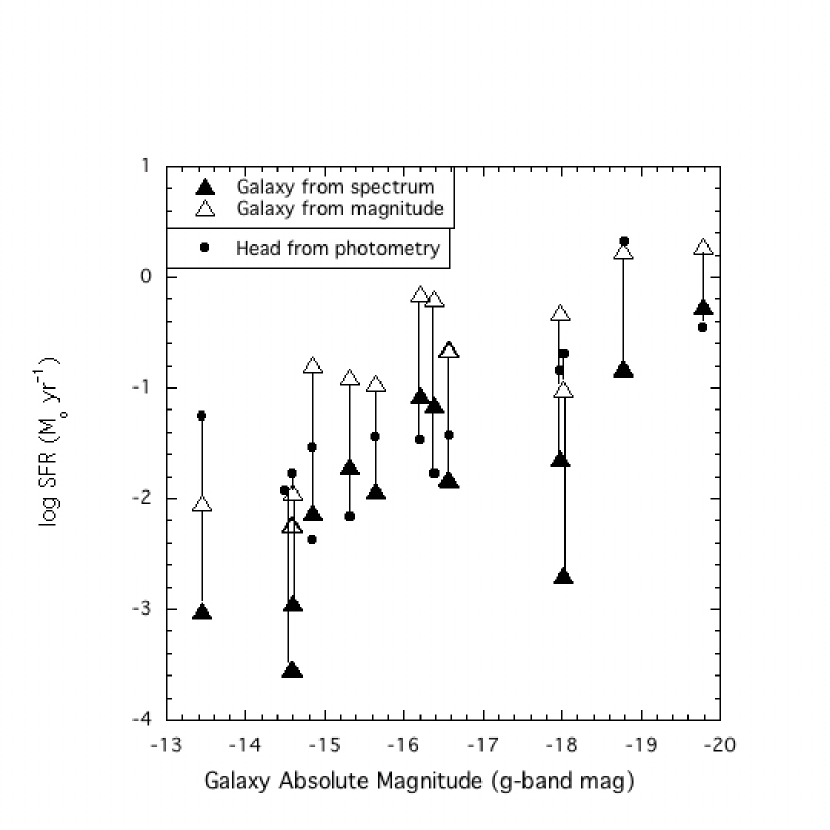
The average head and tail star formation rates (SFR) were calculated from the ratios of the derived masses to the ages, and are listed in Table LABEL:tab4. They represent an average over the lifetime of the dominant stellar population. They differ from the current star formation rates, which were estimated from the H fluxes in the SDSS spectra (available for all but UM 417). Star formation rates were calculated in two ways from the spectrum: one from the -diameter area of the SDSS fiber using the measured H flux in the fiber, which was usually centered on the brightest part of the galaxy, and the other from the product of the H equivalent width in the fiber spectrum (i.e., the ratio of H flux to -band flux) and the integrated -band luminosity of the whole galaxy, using the conversion by Kennicutt (1998). These two rates are also listed in Table LABEL:tab4. The first case corresponds to the SFR in the region covered by the SDSS spectrum, so it usually underestimates the total galactic SFR. The second case assumes all of the galaxy is forming stars at the relative rate of the fiber part, so it represents what is likely an upper limit. Figure 8 shows the two H-based rates. The left side has a comparison of the two values, showing that the value from the extrapolation to the whole galaxy is about ten times larger than the value in the fiber only. The right side shows the star formation rate extrapolated to the whole galaxy versus galaxy -band absolute magnitude Mr. The equations in the figures show the linear fits to the data.
Previous studies determined star formation rates for some of the tadpoles. For one of our galaxies, Kiso 3473 = Mrk 1416, Zhao, Gu, & Gao (2011) found a value of log SFR (SFR in yr-1) using H flux from an SDSS spectrum. This value differs from our value of in Table LABEL:tab4 because we used an SDSS spectrum from a different position in this galaxy. This galaxy has two object identification numbers in SDSS, one for each clump. When we convert the H flux for the Zhao et al. position, we confirm their value. H luminosities were also measured for some of our tadpoles in previous studies. For these, we can derive a SFR for the whole galaxy by using the Kennicutt (1998) conversion and applying the correction for a metallicity of 0.4 solar (i.e., ) as in Hunter, Elmegreen, & Ludka (2010): SFR ( yr-1) = (erg s-1). For Kiso 3473, an observed log H luminosity (units of erg s-1; Gil de Paz, Madore, & Pevunova, 2003) gives log SFR , and for UM 417, log H = 39.70 gives log SFR. For Kiso 8466, log H = 40.64 (Gavazzi et al., 1998) gives log SFR . Heller, Almoznino, & Brosch (1999) give log SFR for Kiso 6511, and for Kiso 6664. These values are in between the SFRs we derive for the heads and those extrapolated for the whole galaxies.
Figure 9 shows the star formation rate for local tadpoles as a function of the galaxy absolute magnitude. The three rates discussed above are plotted: the head region from photometry, the fiber region from H flux in the SDSS spectrum, and an upper limit for the whole galaxy from the H equivalent width and the -band flux. The photometric rate is typically between the other two, and all of them increase approximately linearly with galaxy luminosity. In principle, the past-average SFR inferred from photometry and the current SFR inferred from H may be different, but in fact they are fairly similar. The differences are mostly the result of the different regions viewed. The few galaxies with H-fiber star formation rates that are less than their photometric star formation rates have fiber positions that do not include the bright heads. Generally, the stellar populations that dominate the heads were produced at a rate that is comparable to the current H rate.
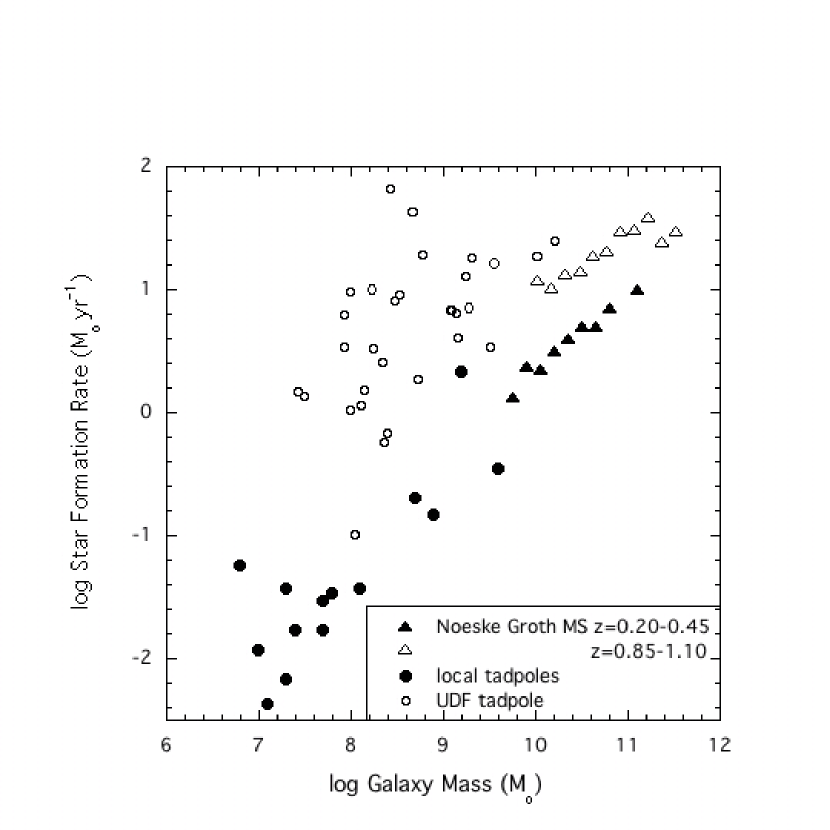
Many recent studies have examined the star formation rate in a large sample of galaxies as a function of redshift. The star formation rate depends on the stellar mass of the galaxy and its redshift. For example, Noeske et al. (2007) compiled star formation rates for 2905 field galaxies in the Groth Strip from GALEX and MIPS data and binned them into 4 redshift bins, from to . They found increasing average rates for a given galaxy mass with increasing redshift. Bauer et al. (2011) examined star formation rates in 1300 GOODS galaxies binned from =1.50 to 3.00 using HST UV and Spitzer IR data, and found approximately constant rates over this redshift range that are about 5 times higher than the star formation rates in the =0.3 bin of Noeske et al. (2007). In Figure 10 we plot as filled circles the log of the star formation rate versus total stellar galaxy mass for our local tadpole sample. The star formation rates shown are those determined for the tadpole heads as listed in Table LABEL:tab4. The galaxy masses are assumed to be the sum of the head masses, the underlying disk masses that were subtracted from the head, and the tail masses, also in Table LABEL:tab4. On the same figure we plot as filled triangles the Noeske et al. (2007) average values in each mass bin. All but two of the local galaxies fit well on this star formation main sequence (Kiso 3867 and 8466 have higher SFRs for their masses), indicating that the local tadpoles have normal star formation rates for their masses.
In Figure 10 we also show as open circles the UDF tadpoles from Elmegreen & Elmegreen (2010). The masses are taken to be the sum of the head and tail masses, and the star formation rates are assumed to be the sum of the head and tail rates. Plotted as open triangles are the average values from Noeske et al. (2007). For both tadpoles and other galaxies, the star formation rates for a given mass are higher at higher redshift. The scatter in the Noeske et al. (2007) sample, as plotted in that paper, corresponds to about a factor of 10 in the star formation rate, the same as the scatter in our tadpole sample. The UDF tadpoles fit on this higher redshift main sequence, as the local tadpoles do for the nearby main sequence.
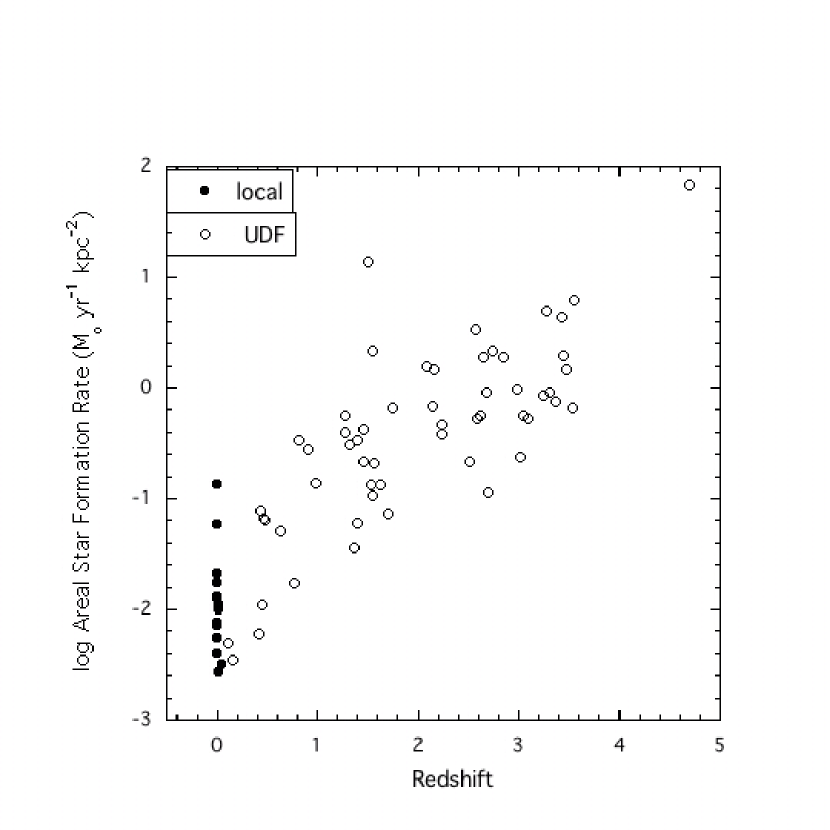
Figure 11 shows the star formation rate per unit area, in yr-1 kpc-2, in the head region from photometry as a function of redshift (also listed in Table LABEL:tab4). The local tadpoles, shown as black dots, have a wide range of with a mean value of . This is comparable to the areal star formation rate of local spiral galaxies (Bigiel et al., 2008). The UDF tadpoles have higher areal rates, increasing by about 2 orders of magnitude out to . This rise is faster than the universal star formation rate per unit volume as a function of redshift shown by Bouwens et al. (2011), which is 1.5 orders of magnitude over the same redshift range. For comparison, the SINS sample of galaxies (Genzel et al., 2011) has seven clumps in five clumpy galaxies with based on H spectra ranging from to . These values are slightly higher than the of the UDF tadpole heads of similar size at the same redshift. Daddi et al. (2010) and Genzel et al. (2010) study the areal star formation rate for different samples of galaxies. Daddi et al. (2010) shows that the starburst galaxies have values greater than about yr-1 kpc-2, whereas normal spirals lie below this value. In our Figure 11, the local tadpoles fall in the normal range while most of the high redshift tadpoles are in the starburst range.
The specific star formation time, , in Gyr, is also given in Table LABEL:tab4. This time equals the ratio of the total stellar mass in the galaxy to the photometric star formation rate in the head. The specific star formation times are a Gyr or more, which suggests that these galaxies are not bursting at an unusually high rate.
4 Conclusions
Tadpole galaxies in the Kiso and Michigan Surveys were studied as local analogs of high redshift tadpoles. Characteristic of our local sample are massive off-center star-forming clumps and diffuse tails, which could be faint galaxy disks. The local tadpoles are extremely rare, amounting to only % of UV-bright galaxies in the Kiso survey, while in the ACS image of the UDF, tadpoles represent 10% of all large galaxies (Elmegreen et al., 2005). Because of selection effects, the local tadpoles are less massive than high redshift tadpoles, but their young-star head masses scale with luminosity in the same way, ranging from to for restframe -band absolute magnitudes of -13 mag to -20 mag. The head masses increase to in the most luminous high redshift tadpoles. The star formation rate per unit area increases with increasing redshift by 2 orders of magnitude from =0 to 3. The star formation rate per unit galaxy mass also increases with increasing redshift for the tadpoles, in agreement with the increase found previously for the Groth strip main sequence galaxies.
There are four indications from the present study that many tadpole galaxies are normal faint disks with most of their star formation on one side. One indication is the similarity of the exponential scale length on each side of the major axis in the far outer part, which suggests the presence of a faint symmetric component. Another is the decrease in relative head mass over time, which is an expected trend for normal galaxies with decreasing relative gas abundance and increasing underlying star mass. A third indication is the large value of the specific star formation time, i.e., a Gyr or more, which implies a steady rate over the life of the galaxy. A fourth indication is the increasing age of the underlying disk relative to the star-forming head with decreasing redshift. All of the tadpoles in this survey are of the type having a blue head and a relatively red tail. The only other Kiso tadpole in SDSS, KUG0010+371 (which has no spectrum or redshift information), may be a counterexample, with a red head and a blue tail.
The origin of the lop-sided star formation is not understood. It could be ram-pressure triggered as a result of galaxy motion though an intergalactic medium, it could be the starburst reaction to an impact or galaxy interaction, or it could be a random collapse of local disk gas with an unstable Jeans length comparable to the galaxy radius. All of these origins are consistent with a lower fraction of tadpoles in the local universe than at high z, because there is less intergalactic gas, fewer collisions, and less galactic gas in today’s universe.
Acknowledgments: We thank the Vassar Undergraduate Research Summer Institute (URSI) for support for JD and the National Science Foundation for support for JP through the Keck Northeast Astronomy Consortium from NSF REU grant AST-1005024. DME thanks Vassar College for page charge support. JSA and CMT has been partly funded by the Spanish MICINN, project ’estallidos’ AYA 2007-67965-C03-01 and AYA 2010-21887-C04-04, and they are members of the Consolider-Ingenio program ’first science with GTC’, grant MICINN CSD2006-00070. Funding for the Sloan Digital Sky Survey (SDSS) has been provided by the Alfred P. Sloan Foundation, the Participating Institutions, the National Aeronautics and Space Administration, the National Science Foundation, the U.S. Department of Energy, the Japanese Monbukagakusho, and the Max Planck Society. We also thank the referee for helpful suggestions and references. The SDSS Web site is http://www.sdss.org/. The SDSS is managed by the Astrophysical Research Consortium (ARC) for the Participating Institutions. The Participating Institutions are The University of Chicago, Fermilab, the Institute for Advanced Study, the Japan Participation Group, The Johns Hopkins University, Los Alamos National Laboratory, the Max-Planck-Institute for Astronomy (MPIA), the Max-Planck-Institute for Astrophysics (MPA), New Mexico State University, University of Pittsburgh, Princeton University, the United States Naval Observatory, and the University of Washington. This research has made use of the NASA/IPAC Extragalactic Database (NED) which is operated by the Jet Propulsion Laboratory, California Institute of Technology, under contract with the National Aeronautics and Space Administration.
References
- Abazajian et al. (2009) Abazajian, K. N., et al. 2009, ApJS, 182, 543
- Abraham et al. (1996) Abraham, R., van den Bergh, S., Glazebrook, K., Ellis, R., Santiago, B., Surma, P., & Griffiths, R. 1996, ApJS, 107, 1
- Amorin et al. (2009) Amorin, R., Aguerri, J., Muñoz-Tuñón, C., & Cairós, L. 2009, A&A, 501, 75
- Baldwin, Spinrad, & Terlevich (1982) Baldwin, J. A., Spinrad, H., & Terlevich, R. 1982, MNRAS, 198, 535
- Bauer et al. (2011) Bauer, A., Conselice, C., Pérez-González, P., Grützbauch, R., Bluck, A., Buitrago, F., & Mortlock, A. 2011, MNRAS, 417, 289
- Bigiel et al. (2008) Bigiel, F., Leroy, A., Walter, F., Brinks, E., de Blok, W. J. G., Madore, B., & Thornley, M. D. 2008, AJ, 136, 2846
- Bouwens et al. (2011) Bouwens, R., Illingworth, G., Oesch, P., Labbe, I., Trenti, M., van Dokkum, P., Stiavelli, M., Carollo, C., Magee, D., & Gonzalez, V. 2011, ApJ, 737, 90
- Boselli et al. (2008) Boselli, A., Boissier, S., Cortese, L., & Gavazzi, G. 2008, ApJ, 674, 742
- Brinks & Klein (1988) Brinks, E., & Klein, U. 1988, MNRAS, 231, 63
- Bruzual & Charlot (2003) Bruzual, G., & Charlot, S. 2003, MNRAS, 344, 1000
- Cairós et al. (2009) Cairós, L., Caon, N., Zurita, C., Kehrig, C., Weilbacher, P., & Roth, M. 2009, A&A, 507, 1291
- Cairós et al. (2001a) Cairós, L., et al. 2001a, ApJS, 133, 321
- Cairós et al. (2001b) Cairós, L., et al. 2001b, ApJS, 136, 393
- Calzetti et al. (2000) Calzetti, D., Armus, L., Bohlin, R.C., Kinney, A.L., Koornneef, J., & Storchi-Bergmann, T. 2000, ApJ, 533, 682
- Campos-Aguilar et al. (1993) Campos-Aguilar, A., Moles, M., & Masegosa, J. 1993, AJ, 106, 1784
- Chung et al. (2009) Chung, A., van Gorkom, J.H., Kenney, J.D.P., Crowl, H., & Vollmer, B. 2009, AJ, 138, 1741
- Conselice & Arnold (2009) Conselice, C., & Arnold, J. 2009, MNRAS, 397, 208
- Daddi et al. (2010) Daddi, E., Elbaz, D., Wlater, F., Bournaud, F., Salmi, F., Carilli, C., Dannerbauer, H., Dickinson, M., Monaco, P., & Riechers, D. 2010, ApJL, 714, L118
- Elmegreen & Elmegreen (2010) Elmegreen, B. G., & Elmegreen, D. M. 2010, ApJ, 722, 1895
- Elmegreen et al. (2007) Elmegreen, D. M., Elmegreen, B. G., Ravindranath, S., & Coe, D. A. 2007, ApJ, 658, 763
- Elmegreen et al. (2005) Elmegreen, D. M., Elmegreen, B. G., Rubin, D. S., & Schaffer, M. A. 2005, ApJ, 631, 85
- Elmegreen et al. (2009) Elmegreen, D.M., Elmegreen, B.G., Marcus, M., Shahinyan, K., Yau, M., & Petersen, M. 2009, ApJ, 701, 306
- Förster-Schreiber et al. (2006) Förster-Schreiber, N. M., et al. 2006, ApJ, 645, 1062
- Freeman (1987) Freeman, K.C. 1987, ARAA, 25, 603
- Fumagalli, et al. (2011) Fumagalli, M., Gavazzi, G., Scaramella, R., & Franzetti, P. 2011, A&A, 528, 46
- Gavazzi et al. (1998) Gavazzi, G., Catinella, B., Carrasco, L., Boselli, A., Contursi, A. 1998, AJ, 115, 1745
- Genzel et al. (2010) Genzel, R., et al. 2010, MNRAS, 407, 2091
- Genzel et al. (2011) Genzel, R., Newman, S., Jones, T., et al. 2011, ApJ , 733, 101
- Gil de Paz, Madore, & Pevunova (2003) Gil de Paz, A., Madore, B. F., & Pevunova, O. 2003, ApJS, 147, 29
- Grebel et al. (2003) Grebel, E. K., Gallagher, J. S., III, & Harbeck, D. 2003, AJ, 125, 1926
- Heller, Almoznino, & Brosch (1999) Heller, A., Almoznino, E., & Brosch, N. 1999, MNRAS, 304, 8
- Heller et al. (2000) Heller, A., Brosch, N., Almoznino, E., van Zee, L., & Salzer, J. 2000, MNRAS, 315, 569
- Hester (2010) Hester, J.A., Seibert, M., Neill, J.D., Wyder, T.K., Gil de Paz, A., Madore, B.F., Martin, D.C., Schiminovich, D., & Rich, R.M. 2010, ApJL, 716, 14
- Hunter, Elmegreen, & Ludka (2010) Hunter, D. A., Elmegreen, B.G., & Ludka, B. C. 2010, AJ, 139, 447
- Kennicutt (1998) Kennicutt, R., C. 1998, ARAA, 36, 189
- Kniazev et al. (2001) Kniazev, A. Y., Pustilni, S. A., Ugryumov, A. V., & Pramsky, A. G. 2001, A&A, 371, 404
- Leitherer et al. (2002) Leitherer, C., Li, I.-H., Calzetti, D., Heckman, T.M. 2002, ApJS, 140, 303
- Lin & Faber (1983) Lin, D. N. C., & Faber, S. M. 1983, ApJ, 266, L21
- Loose & Thuan (1985) Loose, H.-H., & Thuan, T. X. 1985, in Star-Forming Dwarf Galaxies and Related Objects, ed. D. Kunth, T. X. Thuan, and J. T. T. Vân (Gif-sur-Yvette: Edition Frontières), 73
- Madau (1998) Madau, P. 1998, ApJ, 498, 106
- Madau (1995) Madau, P. 1995, ApJ, 441, 18
- Markarian (1969) Markarian, B. E. 1969, Astrofizika, 5, 206
- Mayer et al. (2006) Mayer, L., Mastropietro, C., Wadsley, J., Stadel, J., & Moore, B. 2006, MNRAS, 369, 1021
- McAlpine & Lewis (1978) McAlpine, G., & Lewis, D. 1978, ApJS., 36, 587
- Miyauchi-Isobe, Maehara, & Nakajima (2010) Miyauchi-Isobe, N., Maehara, H., & Nakajima, K. 2010, Pub.Nat.Astro.Ob.Japan, 13, 9
- Morales-Luis et al. (2011) Morales-Luis, A. B., Sánchez Almeida, J., Aguerri, J. A. L. & Muñoz-Tuñón, C. 2011, astro-ph arXiv:1109.0235v1
- Nakajima et al. (2010) Nakajima, K. et al. 2010, Comprehensive Catalogue of Kiso UV-X galaxies (KUG2000), http://vizier.cfa.harvard.edu
- Neistein, van den Bosch, & Dekel (2006) Neistein, E., van den Bosch, F., & Dekel, A. 2006, MNRAS, 372, 933
- Noeske et al. (2000) Noeske, K., Guseva, N., Frick, K., Izotov, Y., Papaderos, P., & Thuan, T. 2000, A&A, 361, 33
- Noeske et al. (2007) Noeske, K., et al. 2007, ApJL, 660, L43
- Papaderos et al. (2008) Papaderos, P., Guseva, N. G., Izotov, Y. I., & Fricke, K. J. 2008, A&A, 491, 113
- Rafelski et al. (2009) Rafelski, M., Wolfe, A.M., Cooke, J., Chen, H.-W., Armandroff, T.E., & Wirth, G.D. 2009, ApJ, 703, 2033
- Stoughton et al. (2002) Stoughton, C., et al. 2002, AJ, 123, 485
- Straughn et al. (2006) Straughn, A. N., Cohen, S. H., Ryan, R. E., Hathi, N. P., Windhorst, R. A., & Jansen, R. A. 2006, ApJ, 639, 724
- van den Bergh (1994) van den Bergh, S. 1994, ApJ, 428, 617
- van den Bergh et al. (1996) van den Bergh, S., Abraham, R. G., Ellis, R. S., Tanvir, N. R., Santiago, B. X., & Glazebrook, K. G. 1996, AJ, 112, 359
- van Zee et al. (2004) van Zee, L., Skillman, E., & Haynes, M. 2004, AJ, 128, 121
- Weisz, et al. (2011) Weisz, D. R., Dalcanton, J. J., Williams, B. F., et al. 2011, ApJ, 739, 5
- Windhorst et al. (2006) Windhorst, R. A. et al. 2006, New Astron. Rev., 50, 821
- Zhang et al. (2012) Zhang, H.-X., Hunter, D. A., Elmegreen, B. G., Gau, Y., & Schruba, A. 2012, AJ, 143, 47
- Zhao, Gu, & Gao (2011) Zhao, Y., Gu, Q., & Gao, Y. 2011, AJ, 141, 68
| GalaxyaaKiso catalog number except last entry, which is a University of Michigan number | KUG no., | DistancebbFrom SDSS-DR7 redshift using Ho=73 except for Kiso 3975, 6511, and UM 417, whose distances are from NASA/IPAC Extragalactic Database, http://ned.ipac.caltech.edu | R25ccFrom photometric measurements of SDSS images and radial profiles along the major axis | Mg,totccFrom photometric measurements of SDSS images and radial profiles along the major axis |
|---|---|---|---|---|
| other | (Mpc) | (kpc) | (mag) | |
| 3193 | 0852+400A | 25.5 | 1.76 | -15.32 |
| 3473 | 0917+527,Mrk1416 | 32.9 | 3.93 | -16.2 |
| 3867 | 0937+298 | 7.4 | 1.38 | -13.45 |
| 3975 | 0940+544 | 22.8 | 2.81 | -14.6 |
| 5149 | 1113+237 | 172 | 22.9 | -19.78 |
| 5639 | 1138+327 | 24.5 | 3.35 | -16.4 |
| 5870 | 1149+224 | 46.9 | 4.34 | -16.57 |
| 6511 | 1220+124,IC3224 | 16.8 | 1.78 | -14.85 |
| 6610 | 1225+253,IC3384 | 18.1 | 2.46 | -14.59 |
| 6664 | 1229+151,IC3453,Mrk1328 | 34.9 | 12.2 | -18.02 |
| 6669 | 1229+276,IC3460 | 61.6 | 18.0 | -17.97 |
| 6877 | 1243+265 | 26.3 | 2.51 | -15.65 |
| 8466 | 1601+192,Mrk296 | 64.5 | 13.5 | -18.78 |
| UM 417 | - | 37.3 | 2.97 | -14.85 |
| Galaxy | aaScale length measured from the relatively flat part of the surface brightness profile | No.bbNumber of scale lengths that fit in linear part of profile where measured | left ccScale length measured from outer eastern surface brightness profile | No.bbNumber of scale lengths that fit in linear part of profile where measured | right ddScale length measured from outer western surface brightness profile | No.bbNumber of scale lengths that fit in linear part of profile where measured | |
|---|---|---|---|---|---|---|---|
| (kpc) | (kpc) | (kpc) | |||||
| 3193 | 0.89 0.036 | 0.51 | 3.4 | 0.88 0.05 | 2.5 | 1.04 0.21 | 1.4 |
| 3473 | 2.14 0.011 | 0.55 | 2.1 | 0.80 0.02 | 4.9 | 0.7 0.29 | 1 |
| 3867 | 0.98 0.018 | 0.71 | 2.8 | 1.06 0.08 | 1.9 | 0.95 0.02 | 3.3 |
| 3975 | 3.18 0.076 | 0.81 | 1.3 | 0.64 0.06 | 2.2 | 0.28 1.71 | 5.4 |
| 5149 | - | - | - | 5.67 0.26 | 2.5 | 4.05 0.11 | 3.6 |
| 5639 | 5.71 21 | 1.70 | 0.9 | 0.44 0.52 | 2.1 | 0.88 0.84 | 2.5 |
| 5870 | 4.94 0.22 | 1.14 | 2.6 | 3.1 0.61 | 1.4 | 1.6 0.14 | 2.4 |
| 6511 | 3.00 0.88 | 1.68 | 0.5 | 0.82 0.07 | 2.9 | 0.45 0.03 | 2.9 |
| 6610 | 11.8 3.43 | 4.81 | 0.4 | 1.00 0.09 | 1.3 | 0.63 0.03 | 1.6 |
| 6664 | 22.4 2.62 | 1.84 | 0.7 | 4.74 0.19 | 1.5 | 3.87 0.14 | 1.5 |
| 6669 | 18.3 0.88 | 1.02 | 0.8 | 6.09 1.2 | 1.9 | 2.31 1.8 | 2.8 |
| 6877 | 2.16 0.15 | 0.86 | 1.2 | 0.44 0.04 | 3.6 | 0.71 0.06 | 2.7 |
| 8466 | 264.8 62 | 89.2 | 0.03 | 2.87 0.12 | 2.6 | 4.1 0.18 | 2.5 |
| UM 417 | 101 1899 | 34 | 0.04 | 0.45 0.04 | 5.1 | 0.77 0.18 | 3.2 |
| GalaxyaaKiso catalog number except last entry, which is a University of Michigan number | log bbFrom fits of photometric measurements to evolutionary models, as described in text. An underlying disk component was subtracted from the heads, and a metallicity of 0.4 solar was assumed. | log MHeadbbFrom fits of photometric measurements to evolutionary models, as described in text. An underlying disk component was subtracted from the heads, and a metallicity of 0.4 solar was assumed. | log MTailbbFrom fits of photometric measurements to evolutionary models, as described in text. An underlying disk component was subtracted from the heads, and a metallicity of 0.4 solar was assumed. | log AgeHeadbbFrom fits of photometric measurements to evolutionary models, as described in text. An underlying disk component was subtracted from the heads, and a metallicity of 0.4 solar was assumed. | log AgeTailbbFrom fits of photometric measurements to evolutionary models, as described in text. An underlying disk component was subtracted from the heads, and a metallicity of 0.4 solar was assumed. | ccSurface density, from mass and area, as described in text | ccSurface density, from mass and area, as described in text |
|---|---|---|---|---|---|---|---|
| () | () | () | (yr) | (yr) | ( pc-2) | ( pc-2) | |
| 3193 | 7.3 0.4 | 6.4 0.1 | 7.1 0.1 | 8.5 0.2 | 9.4 0.4 | 2.4 | 5.1 |
| 3473 | 7.8 0.4 | 6.9 0.1 | 7.5 0.1 | 8.3 0.3 | 9.4 0.3 | 1.2 | 3.9 |
| 3867 | 6.8 0.4 | 5.2 0.3 | 6.7 0.1 | 6.4 0.7 | 9.4 0.3 | 0.35 | 2.8 |
| 3975 | 7.0 0.4 | 5.5 0.3 | 7.0 0.1 | 7.4 0.6 | 9.2 0.3 | 0.45 | 0.85 |
| 5149 | 9.6 0.4 | 8.9 0.1 | 9.5 0.1 | 9.3 0.4 | 9.4 0.3 | 6.6 | 4.5 |
| 5639 | 7.7 0.4 | 6.7 0.2 | 7.6 0.1 | 8.5 0.4 | 9.1 0.2 | 2.5 | 3.4 |
| 5870 | 8.1 0.4 | 6.1 0.2 | 8.0 0.2 | 7.5 0.4 | 9.4 0.4 | 0.09 | 1.9 |
| 6511 | 7.7 0.4 | 5.8 0.1 | 7.6 0.1 | 7.3 0.3 | 9.5 0.3 | 0.28 | 4.6 |
| 6610 | 7.4 0.7 | 5.1 0.7 | 7.4 0.1 | 6.8 1.3 | 9.5 0.3 | 0.40 | 2.6 |
| 6664 | 8.7 0.4 | 6.7 0.1 | 8.7 0.1 | 7.4 0.4 | 9.3 0.4 | 0.57 | 4.1 |
| 6669 | 8.9 0.4 | 7.0 0.1 | 8.8 0.1 | 7.8 0.5 | 9.3 0.4 | 0.77 | 2.1 |
| 6877 | 7.3 0.4 | 6.3 0.1 | 6.7 0.1 | 7.7 0.2 | 9.4 0.3 | 0.65 | 1.9 |
| 8466 | 9.2 0.3 | 8.1 0.1 | 8.9 0.1 | 7.8 0.6 | 9.4 0.3 | 0.62 | 3.8 |
| UM 417 | 7.1 0.4 | 6.4 0.1 | 7.0 0.2 | 8.7 0.2 | 7.1 1.5ddFor 0.02 times solar metallicity, the age of the tail is more like the other ages, 9.30.4 in the log | 2.1 | 0.5 |
| Galaxy | log SFRHeadaaMean star formation rate for head based on mass and age from model fits to photometry | log SFRTailbbMean star formation rate for tail based on mass and age from model fits to photometry | log area SFRHeadccMean star formation rate per unit area for head | log SFR specddCurrent star formation rate for whole galaxy based on central 3” SDSS H spectrum | log SFR mageeCurrent star formation rate for whole galaxy based H flux estimated from galaxy -band magnitude | ffSpecific star formation time, determined from galaxy mass divided by head star formation rate, where galaxy mass is the sum of the head and tail masses plus the tail surface density times the head area (that is, the mass presumed to be underlying the head). |
|---|---|---|---|---|---|---|
| ( yr-1) | ( yr-1) | ( yr-1 kpc-2) | ( yr-1) | ( yr-1) | Gyr | |
| 3193 | -2.17 | -2.25 | -2.16 | -1.71 | -0.91 | 3.07 |
| 3473 | -1.47 | -1.95 | -2.26 | -1.07 | -0.15 | 1.82 |
| 3867 | -1.25 | -2.70 | -0.87 | -3.01 | -2.05 | 0.11 |
| 3975 | -1.93 | -2.24 | -1.76 | -2.94 | -1.94 | 0.89 |
| 5149 | -0.46 | 0.02 | -2.50 | -0.26 | 0.28 | 12.2 |
| 5639 | -1.77 | -1.50 | -2.12 | -1.15 | -0.19 | 2.99 |
| 5870 | -1.43 | -1.44 | -2.57 | -1.83 | -0.65 | 3.16 |
| 6511 | -1.54 | -1.88 | -1.89 | -2.12 | -0.80 | 1.88 |
| 6610ggBrightest two sub-clumps used for head mass | -1.77 | -2.13 | -1.23 | -3.54 | -2.24 | 1.53 |
| 6664 | -0.70 | -0.63 | -1.68 | -2.70 | -1.02 | 2.77 |
| 6669 | -0.84 | -0.60 | -1.95 | -1.64 | -0.32 | 4.91 |
| 6877 | -1.44 | -2.71 | -1.90 | -1.93 | -0.96 | 0.51 |
| 8466 | 0.33 | -0.52 | -2.00 | -0.83 | 0.23 | 0.83 |
| UM 417hhNo SDSS spectrum | -2.37 | -0.16 | -2.41 | - | - | 2.82 |