Light hadron, Charmonium(-like) and Bottomonium(-like) states
Abstract
Hadron physics represents the study of strongly interacting matter in all its manifestations and the understanding of its properties and interactions. The interest on this field has been revitalized by the discovery of new light hadrons, charmonium- and bottomonium-like states. In this talk I review the most recent experimental results from different experiments.
keywords:
Light hadron, charmonium, bottomonium, spectroscopypacs:
13.20.Gd, 13.25.Gv, 14.40.Pq, 14.40.Rt1 Introduction
The modern theory of the strong force, which binds quarks inside hadron matter, is quantum chromodynamics (QCD) [1, 2]. In the QCD framework only color-singlet states can exist due to confinement, and only some combinations of color states produce an attractive potential, leading to a bound state. Therefore, the field of hadronic physics is the study of strong interaction in all visible matters and understanding of fundamental questions in terms of QCD. Recently the experimental situation in this field appeared quite exciting. Especially, the situation changed dramatically in the last ten years. After the Belle Collaboration claimed the observation of a new and narrow resonance around 3.872 GeV/, decaying into , named [3], many similar charmonium and bottomonium states was found. Most of these states do not fit in the standard charmonium/bottomonium model.
This review talk is devoted to the experimental signatures of these hadron spectroscopy, in particular, these exotic states. These results are from experiments at both and hadron colliders. Most of the new charmonium states observed in the last few years are from factory experiments BABAR and Belle. Many new observations of hadron spectroscopy also come from the charm factory experiments BESIII and CLEO-c, and from hadron colliders including experiments at Tevatron and LHC, as well as fixed target experiments, such as COMPASS. The analysis techniques adopted in the search for hadron spectroscopy depend on the production mechanisms at different experiments. In the factories at machine, the hadron can be produced in a meson decay, e.g. , and in the -channel direct production, or with an initial state radiation (ISR) for hadron state carrying , and in the two photon fusion production, as well as double quarkonium production, e.g. . At hadron collider, prompt productions coexist with the production in meson decays. At a fixed-target experiment like COMPASS, the production mechanisms are mainly from three mechanisms: central production, diffractive dissociation and photoproduction. In this paper, for the reported experimental results, the first error and second error will be statistical and systematic, respectively, if they are not specified.
2 Light meson decay and spectroscopy
2.1 and mesons and their excitation states
The and mesons play an important role in understanding the low energy QCD. They are isoscalar members of the nonet of the lightest pseudoscalar mesons. Precision measurements on and would be very helpful and provide useful information in our understanding of low energy QCD.
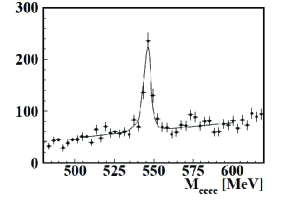
The conversion decay of is important for the understanding of the coupling to the virtual photons and the calculation of the anomalous magnetic moment of the muon [4]. The KLOE Collaboration performed analysis based on data sample of 1.7 fb-1 collected at GeV in the meson mass region. By using the radiative decay , the decay rate for the has been firstly obtained to be [5]. As a result, the measured branching ratio is fully radiation inclusive. The measurement is in agreement with theoretical predictions, which are in the range [6, 7, 8]. Figure 1 shows the mass distribution of four electrons.
Precise measurements of the and decay rates provide important information to test the Chiral Perturbation Theory (ChPT) [9]. The decays are expected to get contributions from the box anomalies which proceed through a vector meson resonance, described by the Vector Meson Dominance (VDM) [10]. According to the effective theory the processes are supposed to proceed both via a resonant contribution, mediated by the meson, and a non-resonant direct term, connected to the box anomaly. Using a data sample corresponding to an integrated luminosity of fb-1 at peak, the KLOE measured the ratio of and using the decay [11]. The preliminary result is
| (1) |
The result is the most precision measurement and in agreement with the recent results from CLEO [12], which differs by more than 3 from the average of the previous results [13].
With new data sample of 225 million decay collected at the BESIII detector, the and decays can be studied via the charmonium decays into final states involving meson. The rare and forbidden decays of and could be reached at the BESIII experiment [14]. The BESIII Collaboration made a precision measurement of s via the decays and [15]. The branching fractions are determined to be and . For the decay , the branching ratio is consistent with the CLEO-c measurement [16], and the precision is improved by a factor of four. For the decay , it is two times larger than the world average value [13].
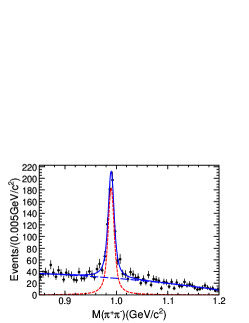
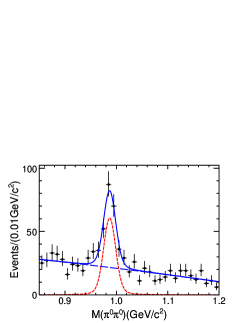
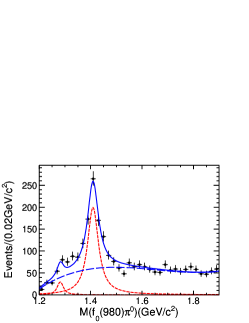
The spectrum of radial excitation states of isoscalar and is still not well known. An important issue is about the nature of and states, which are not well established. By using the decays of and in BESIII, clear signals are observed on both and spectra as shown in Fig. 2, the width of the observed is much narrower (less than 10 MeV) than that in other processes [13]. By taking events in the window of on the () mass spectrum, evidence of is observed in the low mass region of as shown in Fig. 3 [15]. It is interesting that a clear peak around 1400 MeV is also observed on the mass of (see Fig. 3). Angular analysis indicates that the peak on 1400 MeV is from decay. The BESIII Collaboration measured the product branching fraction of production to be and [15], respectively. According to PDG values [13], one obtains the ratio . It is the first time that we observe anomalously large isospin violation in the strong decay of (for example, the ratio of the isospin violating to the isospin covering is about 0.8%). Following BESIII measurement, in reference [17], the authors interpret this puzzle as an intermediate on-shell rescattering to the isospin violating by exchanging on-shell kaon. Further experimental study on the parameters and identification of quantum number are needed at BESIII.
2.2 Spin exotic light states
COMPASS is a multi-purpose fixed-target experiment at the CERN Super Proton Synchrotron (SPS) aimed at studying the structure and spectrum of hadrons. One primary goal is the search for the spin-exotic mesons and glueballs. In a partial-wave analysis (PWA) of the pilot run data taken in 2004, a significant spin-exotic resonance was found at around 1660 MeV/ in final states produced in diffraction on a target [18]. Its mass-dependent phase differences to the and waves are consistent with the highly debated meson claimed in this channel by E852 and VES experiments [19, 20]. From a mass-dependent fit a resonance mass of MeV/ and a width of MeV/ are deduced.
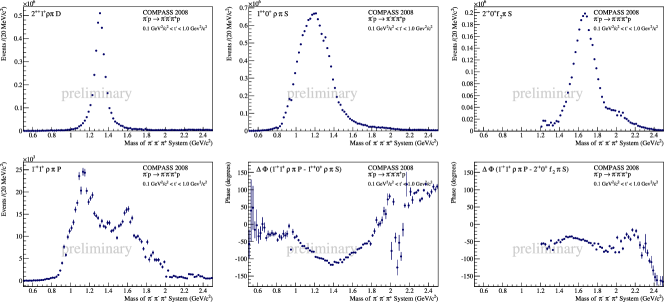
In 2008 COMPASS has acquired large data sets of diffractive dissociation of 190 GeV/c on a H2 target. In a partial-wave analysis (PWA) the isobar model [21] is used to decompose the decay into a chain of successive two-body decays. The spin-density matrix is determined by extended maximum likelihood fits performed in 20 MeV/ wide bins of the three-pion invariant mass. The intensity of the three dominant waves in the final state, , , and , are shown in Fig. 4, top row. They contain resonant structures that correspond to the , , and , respectively [22]. Of peculiar interest are the fit results for the spin-exotic wave in Fig. 4 bottom, left plot. The plot nicely illustrates the unprecedented statistical accuracy due to the large data set. The intensity features a broad bump, centered at 1.6 GeV/. In this mass region a rising phase with respect to the tail of the in the wave is seen (Fig. 4 bottom, center). As in Fig. 1 (bottom, right shows), the structure is phase locked with the in the wave. This is consistent with the results obtained from a PWA of the pilot-run data taken with a target [18].
The CLEO-c Collaboration presents an analysis of decays in which they study the production of various intermediate states [23]. They find evidence for an exotic -wave scattering amplitude at the level of 4 standard deviations under a wide variety of model variations. The best fit to the data is obtained when the amplitude is included. The mass is described by a Breit-Wigner lineshape with a mass and width of MeV/ and MeV/, respectively, which is the first evidence of exotic state in charmonium decays. The result is consistent with that from other experiments [19, 20]. Now BESIII had collected 4 times of CLEO-c’s sample at peak [24], we expect to confirm CLEO-c measurement soon.
2.3 New light mesons observed by BESIII
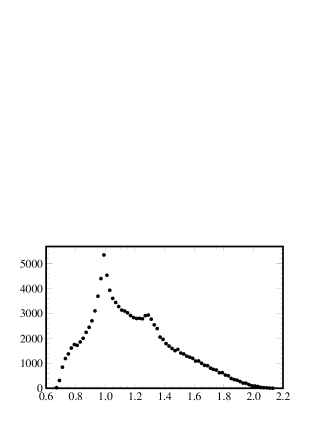
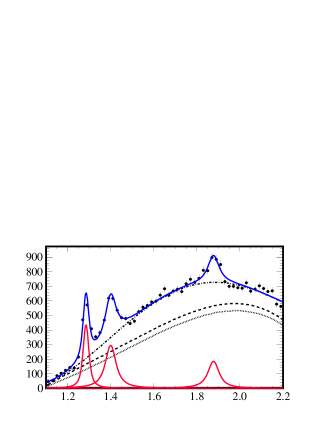
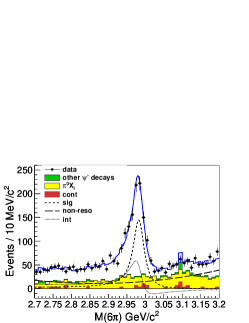
In 2005, BESII observed a resonance, , in the radiative decay with a statistical significance of 7.7 [25]. A fit to a Breit-Wigner function yielded a mass MeV/, a width MeV/. The study was stimulated by searching for glueball candidates which was predicted by the Lattice QCD [26]. With 225 million decay events collected by the BESIII detector, the state has been confirmed with a statistical significance larger than 20 in the same analysis [27]. The mass and width are measured to be MeV/ and MeV/ as shown in shown in Fig. 5. The mass of the is consistent with the BESII result, but the width is significantly larger. A simple angular analysis indicates that quantum number of is consistent with a pseudoscalar assignment, but the others are not excluded.
Meanwhile, two resonances, the and the are observed with statistical significances larger than 7.2 and , respectively, as shown in Fig. 5. The masses and widths are measured to be:
-
•
(2) -
•
(3)
In the mass spectrum fitting in Fig. 5(b), possible interferences among different resonances and the non- resonant process are not taken into account. To determine the spin and parity of the , and , and to measure their masses and widths more precisely, a PWA must be performed, which will be possible with the much higher statistics data samples planned for future runs of the BESIII experiment.
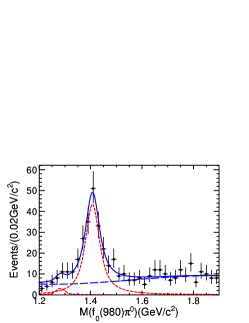
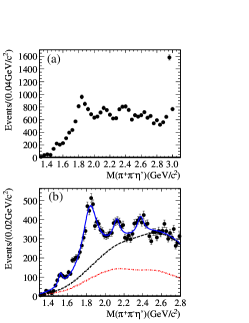
The BESIII experiment also reports an analysis of . A structure around 1.8-1.9 GeV/ in the mass spectrum is observed [28]. In the analysis, a clear signal is seen in the mass spectrum as shown in Fig. 6 (left). The mass spectrum for events where either or is in a MeV/ mass window centered on the mass is shown in Fig. 6 (right). Three peaks are observed on the mass spectrum, two of them in the low mass side are and . The structure near 1.8 GeV/ is the first observation. A fit to the three signal peaks leads to MeV/ and MeV/ for the structure with the statistical significance of 7.2. Here the three signal peaks are parametrized by Breit-Wigner functions convolved with a Gaussian resolution function and multiplied by an efficiency curve, which are both determined from signal MC samples and fixed in the fit. Whether the resonant structure of is due to the , the , an interference of both, or a new resonance still needs further study such as a PWA that will be possible with the larger data sample.
2.4 Proton-anti-proton mass threshold enhancement
An strong mass threshold enhancement was first observed by the BESII experiment in the decay process [29] and was confirmed by the CLEO-c experiment [30]. With the BESIII data, a PWA analysis is performed to determine the parameters of the mass threshold structure, which we denote as [31]. Only events of GeV/ are considered in the PWA. Four components, the , , and phase space (PS) are included in the PWA fit. The intermediate resonances are described by Breit-Wigner propagators, and the parameters of the and are fixed at PDG values. In the fit, the final state interaction (FSI) effect is also considered by using the Julich formulation [32]. Figure 7 shows comparisons of the mass and angular distributions between the data and the PWA fit projections. In the optimal PWA fit, the is assigned to be a state, which is 6.8 better than other assignment. In the fit, a Breit-Wigner and S-wave final state interaction (I=0) factor can well describe the mass threshold structure. The PWA fits are also performed without the correction for FSI effect. The corresponding log-likelihood value worsen by 25.6 than those with FSI effect included.
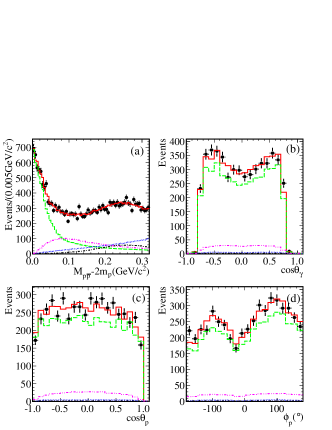
With the inclusion of Julich-FSI effects, the mass, width and product BR for the are measured to be: MeV/, MeV/ ( a total width of MeV/ at 90% C.L.) and , respectively, where the third error are uncertainty due to choosing different model of FSI effect [32, 33, 34].
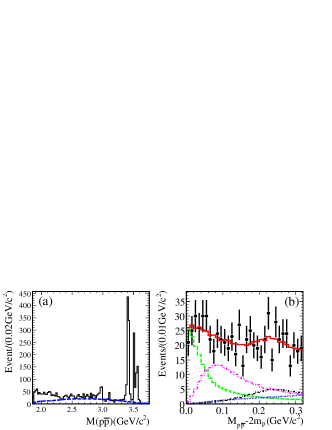
The decay is also studied by using 106 million decay events collected by the BESIII detector [31]. The mass spectrum of the surviving events is shown in Fig. 8(a). Besides the well known and peaks, there is also a mass threshold excess relative to phase space. However, here the line shape of the mass spectrum in the threshold region appears to be less pronounced than that in decays. A PWA on the selected which is similar to that applied for decay was performed to check the contribution of in decays and to measure the production ratio between and radiative decays, . Due to limited statistics of events, in the PWA, the mass and width of as well as its were fixed to the results obtained from decays. Figure 8 (b) shows comparisons between data and MC projections for the mass spectrum. The determined product and value are and , respectively. It is suppressed compared with the so called 12% rule .
3 Charmonium spectroscopy and decays
3.1 and
3.1.1 resonance via decay
Precise measurement of M1 transition of is important for us to understand the QCD in the relativistic and nonperturbative regimes. The transition is also a source of information on the mass and width. There is currently a 3.3 inconsistency in previous mass measurements from and (averaging MeV/) compared to or production (averaging 2982.6 1.0 MeV/)[13]. The width measurements also spread from 15 to 30 MeV, it is around 10 MeV in the earlier days of experiments using radiative transition [35, 36], while the recent experiments, including photon-photon fusion and meson decays, gave higher mass and much wider width [37, 38, 39, 40]. The recent study by the CLEO-c experiment [41], using both and decays, and pointed out there was a distortion of the line shape. The CLEO-c attributed the line-shape distortion to the energy-dependence of the M1 transition matrix element. In the from CLEO-c, the distorted lineshape can be described by the relativistic Breit-Wigner (BW) distribution modified by a factor of E together with a dumping factor to suppress the tail on the higher photon energies. The KEDR Collaboration did the same thing but tried different dumping factor [42].
Based on the data sample of 106 M events collected with the BESIII detector, the mass and width are measured from the radiative transition [43]. The candidates are reconstructed from six exclusive decay modes: , ,, , , and 3, where is reconstructed in mode, and from final states. For a hindered M1 transition the matrix element acquires terms proportional to , which, when combined with the usual term accounting for the wave function mismatch between the radial excited and the ground-state transitions, lead to contributions in the radiative width proportional to . Thus, the lineshape is described by a BW modified by convoluted with a resolution function. It is important to point out that the interference between and non-resonance in the signal region is also considered. The statistical significance of the interference is 15. This affects the resonant parameters significantly. By assuming all non-resonant events interfere with the , the BESIII analysis obtains mass and width, MeV/ and MeV, respectively. Two solutions of relative phase are found for each decay mode, one represents constructive interference, the other for destructive. Regardless which solution one takes, the mass, width of the and the overall fit are always unchanged. The relative phases for constructive interference or destructive interference from each mode are consistent with each other within 3, which may suggest a common phase in all the modes under study. The fit with common phase for each mode shows the relative phase rad (constructive) or rad (destructive). The physics that the interference phase is the same for the six channels is yet to be understood. Figure 9 shows the fit results in the six decay modes.
With precise measurement of the mass, one can obtain the hyperfine splitting, MeV, which agrees with the quark model prediction [44], and will be helpful for understanding the spin-dependent interactions in hidden charmonium states.
3.1.2 Observation of
The first radially excited S-wave spin singlet state in the charmonium system, , was observed by the Belle experiment in the decay process , [45]. It was confirmed by the CLEO [46] and BABAR [47] experiments in the two-photon fusion process and by the BABAR experiment in the double-charmonium production process [48]. The only evidence for in the decay was from Crystal Ball Collaboration [49] by looking at the radiative photon spectrum. Recently, the CLEO-c experiment searched for the signal with exclusive decay into 11 modes by using 25.9 M events, and no evidence found. Product branching fraction upper limits are determined as a function of for the 11 individual modes [50].
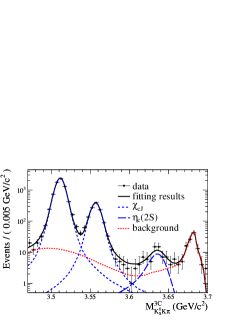
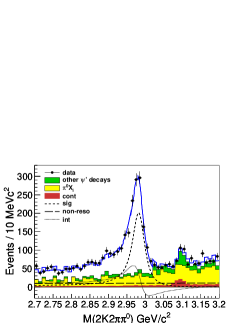
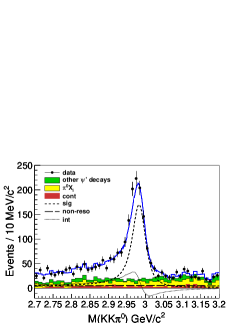
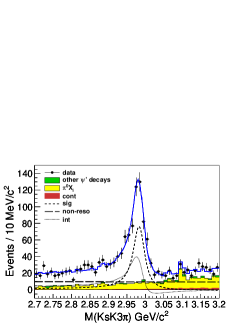
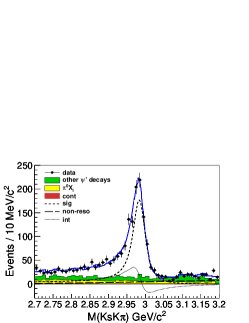
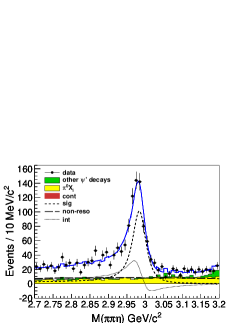
The BESIII experiment searched for the M1 transition through the hadronic final states . A bump is observed around 3635 MeV/ on the mass spectrum as shown in Fig. 10. In order to determine the background and mass resolution using data, the mass spectrum range is enlarged (3.47 3.72 GeV/c2) to include and events. The resonances and are described by the corresponding Monte Carlo (MC) shape convolved a Gaussian which takes account the small difference on the mass shift and resolution between data and MC. So the mass resolution for the in the fitting is fixed to the linear extrapolation of the mass resolutions from the and signals in data. The lineshape for produced by such the M1 transition is described by where is the invariant mass of , is the energy of the transition photon in the rest frame of , is the function to damp the diverging tail raised by and is the Gaussian function describing the detector resolution. The possible form of the damping function is somewhat arbitrary, and one suitable function used by KEDR for a similar process is [42]
where is the peaking energy of the transition photon. In the fit, the width of is fixed to PDG value. From the fit to the data, a signal with a statistical significance of 6.5 standard deviation is observed which is the first observation of the M1 transition . The measured mass for is MeV/. The measured branching ratio is . Together with the BABAR result [51], the M1 transition rate for is derived as , which is in agreement with the prediction of potential model calculations [52].
Recently, the Belle experiment measured and resonant parameters in the decay of by considering the interference between / decay and non-resonant in the decay [53]. Meanwhile, the BABAR experiment also updated the analysis of and modes [54]. Table 1 shows the summary of the typical production processes ( radiative decays, fusion and decays) for and corresponding resonant parameter measurements. These results indicate that the parameters agree well from different production processes.
| BESIII | Belle [53] | BABAR [54] | PDG 2010 [13] | |
|---|---|---|---|---|
| decays | fusion | |||
| MeV/ | ||||
| MeV | ||||
| MeV/ | ||||
| MeV | (fixed) |
3.2 New results on from BESIII
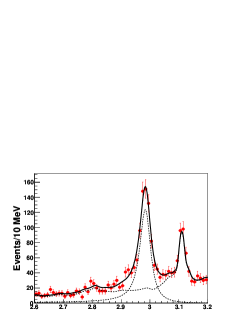
The BESIII Collaboration reported the results on the production and decay of the using 106M of decay events in 2010 [55], where they studied the distributions of mass recoiling against a detected to measure both inclusively (E1-untagged) and in events tagged as (E1-tagged) by detection of the E1 transition photon. In 2011, 16 specific decay modes of are used to reconstruct candidates in the decay mode of . Figure 11 (left) shows the recoiling mass for the sum of the 16 decay modes. Fits to the 16 recoil-mass spectra are performed simultaneously that yields MeV/ and MeV/, respectively. These preliminary results are consistent with the previous BESIII inclusive results and CLEO-c exclusive results.
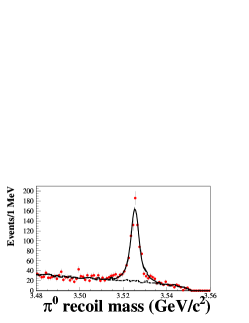
The centroid of the states (,,) is known to be MeV [13]. If the states centroid mass is identified as the mass of , then BESIII observes the hyperfine splitting as MeV which agrees with zero.
The BESIII Collaboration also looked at the mass distributions in the exclusive decay modes. Figure 11 (right) shows the distribution of invariant mass distribution from exclusive hadronic decays of , the shape of the is symmetric in radiative transition and no distortion observed as in / radiative decays [41, 43]. A maximum likelihood fit is perform to extract the parameters. In the fit the signal shape is described by a BW (corrected by ) convoluted with a Gaussian resolution function. The preliminary results for the parameters are MeV/ and MeV/, where the errors are statistical error only. The results are in agreement with those from analysis.
3.3 Determination of parameters at KEDR
A measurement of the meson parameters has been reported by the KEDR experiment based on data samples during the scans of the center-of-mass energy range from 3.67 to 3.92 GeV at the VEPP-4M collider in 2004 and 2006 [56]. The observed multihadron cross sections were fitted as a function of the center-of-mass energy using some assumptions about the behaviour of then non-resonant form factor. The data points corrected for the detector efficiency together with several fitting curves are shown in Fig. [fig:kedr] (left). Unlike Ref. [57], KEDR experiment did not observe any shape anomaly. The interference of resonant and nonresonant production essential in the near-threshold region has been taken into account as suggested in Ref. [58]. The analysis assumes the domination of in the non- part of the -meson form factor. It is also worth noting that correct accounting of the resonance-continuum interference can help in solving the non- puzzle [59].
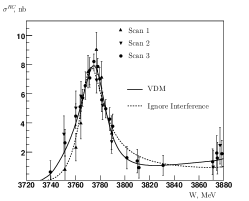
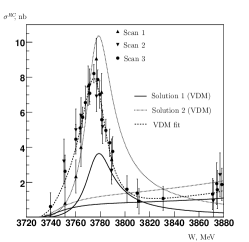
It is known that for two interfering resonances the ambiguity can appear in the resonance amplitudes and the interference phase [60]. Figure 12 (right) shows the results of the two solutions corresponding to vector dominance models (VDM). The KEDR experiment presented the results on the mass ad width of are MeV/ and MeV, where average values of the mass and total width of the two VDM solutions are used and the third error arises from the model dependence. The results agree with those from BABAR [61] also taking into account interference and disagree with all results obtained ignoring this effect including that by BESII [62]. The KEDR also obtained two possible solutions for the electron partial width
-
1.
eV,
-
2.
eV.
Most of the potential models strongly support the first solution and can barely tolerate the second one [63, 64, 65].
3.4 News on charmonium-like states
3.4.1
The resonance is the forerunner of the new charmonium family. It was discovered by Belle [3] in the decay, with , and confirmed by BABAR [66, 67], CDF [68] and D0 [69], and now by CMS [70, 71] and LHCb [72]. The quantum number of the state is not yet fully established. A study of the angular decay distributions performed by the CDF experiment gave nonnegligible probabilities only for and [68], where is also confirmed by the observation of the decay [73]. Table 2 summarizes the measurements of the mass. The new world average is . The close proximity of the world-averaged mass to the ( MeV/) mass threshold has engendered speculation that the might be a loosely bound molecule or a tetraquark state [74]. Despite a large experimental effort, the nature of this new state is still uncertain and several models have been proposed to describe it.
| Experiment | mass MeV/ |
|---|---|
| CDF | |
| BABAR () | |
| BABAR () | |
| D0 | |
| Belle (full dataset) | |
| LHCb | |
| World Average |
With full dataset (711 fb-1) collected by the Belle detector, the difference in masses of the states produced in and decays is determined to be [75]: MeV/, which is consistent with zero and disagrees with theoretical predictions based on a diquark model for the [76]. We conclude from this that the same particle is produced in the two processes and use a fit to the combined neutral and charged meson data samples to determine: MeV/. This result agrees with the current world-average value of MeV/ as listed in Table 2. The width of the signal peak is consistent with the experimental mass resolution and we set a 90% CL limit on its natural width of MeV, improving on the previous limit of 2.3 MeV. The details of the analysis can be found in [75]. The production ratio of in the and meson decays are measured to be :
| (4) |
This value is above the range preferred by some molecular models for the : [77]. The BaBar result for this ratio is [67]. Both BABAR [78] and Belle [75] experiments had searched the charged partner of the decaying into by using decay, and shows no evidence for a charged partner to the decaying as . The current data favor isospin . However, the close proximity of the threshold may induce large isospin violations, as pointed out by N. A. Tornqvist [79]. Unfortunately, in Belle experiment, an attempt to discriminate between and with an angular analysis of didn’t brought to any conclusion, due to the lack of statistics [75].
Radiative decays of the are important in understanding its nature. The decay of established its charge parity to be +1. Both BaBar [80] and Belle [73] searched for the the and decays, that are predicted to dominate for a molecule. The BABAR Collaboration [80] show that is almost three times that of , while, the Belle Collaboration find no evidence for , and determine the ratio to be : (at 90% C.L.) [73]. The possibility of a dominance seems to be excluded. The state may not have a large admixture with a molecular component as was expected on the basis of the BABAR result [80].
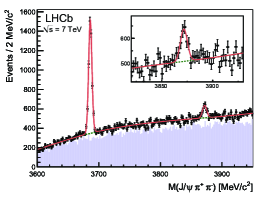
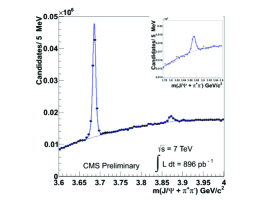
First observation of the state at the LHC were reported by both CMS [70, 71] and LHCb [72] experiments in the decay of , using data collected in 2010. With an integrated luminosity of 34.7 pb-1 collected by the LHCb experiment, the production of the particle is observed in pp collisions at TeV. Figure 13 (left) shows the results. The masses of both the and are measured to be : MeV/ and MeV/. The CMS Collaboration performed a measurement of the with data set collected in 2010 and 2011, and found about 5 3000 candidates in 896 pb-1, as shown in Fig. 13 (right).
3.4.2 family
In the family of the charmonium-like states, the states are among the most easiest to be found at collider, since they can be produced through the ISR mechanism. The is the first one found by BABAR Collaboration [81]. Now four states were discovered at the -factories [81, 82, 83, 84]: the and the decaying to , the and the decaying to . The has been also confirmed by the CLEO-c experiment [85, 86] that could extensively produce it by running at open charm energy region. This allowed to observe also the and the modes. The Belle experiment performs an analysis to compare the and the rates. According to the isospin symmetry, the second one should be half of the rate of the first one. The cross-sections of as function of mass have been measured, and by fitting to the cross-sections data, they obtain eV, which is consistent with the isospin expectation by comparing to the measured [13].
3.4.3 at LHCb
The CDF experiment reported a 3.8 evidence for the state in the decay using data collected at the Tevatron ( TeV) [87]. A preliminary update of the CDF analysis with 6.0 fb-1 leads to observation of with with a statistical significance of more than 5 [88]. The mass and width were measured to be MeV and MeV/. The relative decay rate was determined to be . However, the LHCb Collaboration perfrom the most sensitive search for the narrow state in decays by using 0.37 fb-1 data. They did not confirm the existence of such a state. An upper limit on the at 90% C.L. is set [89]. The result disagrees at the 2.4 level with the CDF measurement.
4 Bottomonium-like states
The Belle experiment has collected a large sample of collision at the center-of-mass energy near the resonance, which lies above the production threshold. Many unexpected non- decays of have been observed. In particular, anomalously large rates for dipion transitions (, 2,3) have been observed [90]. Assuming these signals are attributed entirely to the decays, the measured partial decay widths MeV are about two order of magnitude larger than typical widths for dipion transitions of , and .
Recently the CLEO-c experiment observed the process at a rate comparable to the process by using data sample taken near MeV and found evidence of an even high transition rate at the energy [91]. This implies that the production might be enhanced in the region of the , which may exist an exotic resonance analogue of the .
Using the full data sample with the integrated luminosity of 121.1 fb-1 collected near the peak of with the Belle detector, they observe the and in the missing mass spectrum of pairs. The missing mass is defined as where is the center-of-mass (c.m.) energy, and are the energy and momentum measured in c.m. frame. The details of the analysis can be found in [92, 93]. The spectrum with the combinatorial background and contributions subtracted, and the signal function resulting from the fit overlaid, are shown in Fig. 14.
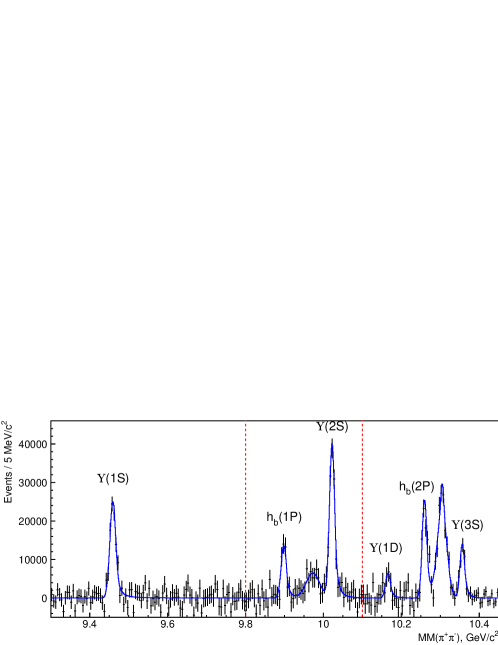
The significance of the and signals which includes the systematic uncertainty is and , respectively. This is the first observation of the and spin-singlet bottomonium states in the process at the energy. The measured masses and cross-sections relative to the cross-section are MeV/, for the and MeV/, for the . The mass of the spin-singlet state is consistent with the center-of-gravity of the corresponding states. The hyperfine splitting is MeV/ ( MeV/).
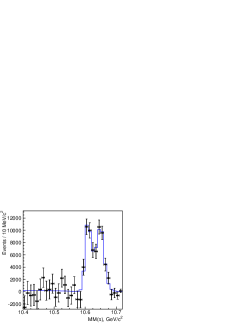
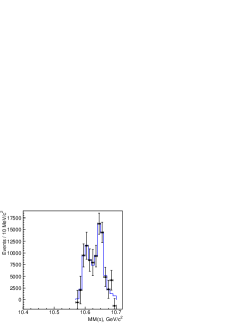
The large values indicate that an exotic state, , may be around energy, and the exotic decay violates the suppression of heavy quark spin-flip. Belle experiment studied the resonant substructure of decays [92]. Since the low statistics and high background, a Dalitz plot analysis is impossible. Belle studied performed the one-dimensional distribution of , where () is defined as a missing mass of the opposite-sign pion, (). The signal yields are measured as a function of the by fitting the spectra in the bins of . Figure 15 (a) and (b) show results of the fits for the and yields as a function of . A clear two-peak structure is seen without any significant non-resonant contribution. By assuming that the spin-parity for both structures is , a fit to the distributions is performed. In the fit, two -wave BW amplitudes and a non-resonant contribution is used. The results of the fit are shown in Fig. 15 and are summarized in Table 3. The non-resonant amplitude is found to be consistent with zero. In the fit, the hypothesis of two resonances is favored over the hypothesis of a single resonance (no resonances) at the () level. Therefore, the two charged structures are named as and , respectively. The parameters of the and obtained in the fit of and are consistent with each other.
| Final state | ||
|---|---|---|
| Rel. amplitude | ||
| Rel. phase, |
| Final state | |||
|---|---|---|---|
| Rel. amplitude | |||
| Rel. phase, |
For the analysis of the , in addition of the the missing mass associated with the system, the events are further identified by the pair with an invariant mass in the range of . Figure 16 shows Dalitz plots of the events in the signal regions for the three decay channels under study. In all cases, two horizontal bands are evident in the system near ( GeV) and ( GeV). The amplitude analyses of the three-body decays that are reported here are performed by means of unbinned maximum likelihood fits to two-dimensional Dalitz distributions.


The details of the description of the Dalitz plot analysis can be found in [93, 94]. Results of the fits to signal events are shown in Fig. 17, where one-dimensional projections of the data and fits are compared. To combine and events we plot mass distributions in terms of and ; fits are performed in terms of and . Results of the fits are summarized in Table 4. The combined statistical significance of the two peaks exceeds 10 for all tested models and for all decay modes.


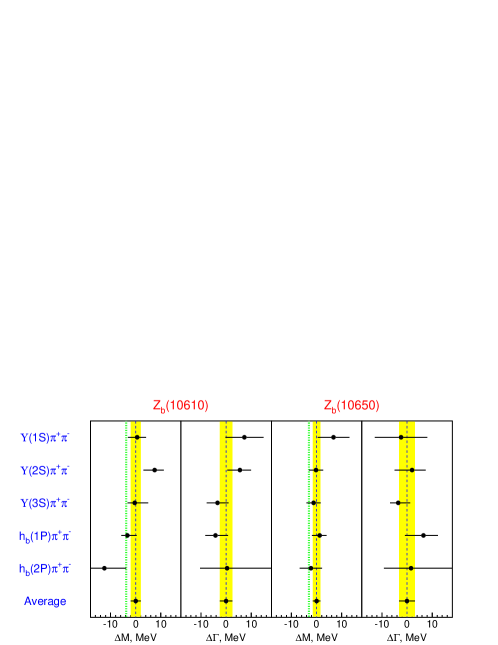
The Belle experiment observed two charged bottomonium-like resonances, the and , with signals in five different decay channels, () and (). All channels yield consistent results as can be seen in Fig. 18. A simple weighted averages over all five channels give , and , , where statistical and systematic errors are added in quadrature. The measured masses of these states exceed by only a few MeV/ the thresholds for the open beauty channels ( MeV) and ( MeV). This “coincidence” can be explained by a molecular-like type of new states, i.e., their structure is determined by the strong interaction dynamics of the and meson pairs [95]. The decays seem to be saturated by the and intermediate states; this decay mechanism may be responsible for the high rate of the process measured recently by the Belle Collaboration [90].
5 Summary
In this paper, I review the most recent experimental results on the light hadron, charmonium and bottomonium states. Especially, I gave a review of the exotic candidates observed so far. Although a lot of great progresses have been made in the last few years, the situation is far from being completely clarified. In most case, new data and high statistics are needed, and they are expected to come from the LHC and the future flavor factories. At the same time, the analysis effort of the B-Factory experiments is still on going and new results are expected to come in the near future. Finally, we need more theoretical efforts to make further investigations, for example, in the case of and interpretation and their connections with the cross sections. In conclusion, hadron spectroscopy is still an intriguing field, new or more precise measurements will continue to provide, in the near future, important information to better understand QCD and its effective treatments, with a broad impact on many other fields.
Acknowledgements.
The author would like to thank experimental colleagues from BESIII, BABAR, Belle, CLEO, CDF, LHCb, CMS, KLEO and KEDR Collaborations. Especially, thanks to Hesheng Chen, Yifang Wang, Steve Olsen, X.Y.Shen, C.Z.Yuan, Torsten Schroer, Karim Trabelsi, A. E. Bondar, S.-K.Choi, Roy A. Briere, K. Seth, M. Kornicer, Diego Tonelli, Giovanni Punzi, Robert Harr, Y.N. Gao, Hal Evans, Simon I. Eidelman, Evgeny Baldin, Simona Giovannella and Paolo Gauzzi. I am grateful for support from my institute and from National Natural Science Foundation of China under contract No. 11125525.References
- [1] D. J. Gross and F. Wilczek, 1973 Phys. Rev. Lett. 30, 1343, (1973).
- [2] H. D. Politzer, Phys. Rev. Lett. 30, 1346, (1973).
- [3] S.K. Choi et al. (Belle Collaboration), Phys. Rev. Lett. 91, 262001 (2003).
- [4] L. G. Landsberg, Phys. Rept. 128, 301, (1985).
- [5] F. Ambrosino et al. (The KLOE Collaboration), Phys. Lett. B 702, 324, (2011).
- [6] C. Jarlskog and H. Pilkuhn, Nucl. Phys. B 1, 264, (1967).
- [7] T. Miyazaki and E. Takasugi, Phys. Rev. D 8, 2051, (1973).
- [8] T. Petri, PhD thesis, arXiv:1010.2378 [nucl-th].
- [9] J. Gasser, H. Leutwyler, Nucl. Phys. B 250, 465, (1985).
- [10] M. Benayoun et al., Eur. Phys. J. C 31, 525, (2003).
- [11] F. Ambrosino et al. (The KLOE Collaboration), arXiv:1107.5733 [hep-ex].
- [12] A. Lopez et al., Phys. Rev. Lett. 99, 122001,(2007).
- [13] K. Nakamura et al. (Particle Data Group), Review of Particle Physics, J. Phys. G 37, 075021, (2010).
- [14] H. B. Li, J. Phys. G: Nucl. Part. Phys. 36, 085009, (2009).
- [15] M. Ablikim et al. (BESIII Collaboration), arXiv:1201.2737[hep-ex], submitted to Phys. Rev. lett.
- [16] P. Naik et al. (CLEO Collaboration), Phys. Rev. Lett. 102, 061801, (2009).
- [17] J. J. Wu et al., Phys. Rev. Lett. 108,081803, (2012).
- [18] A. Alekseev et al. (COMPASS Collaboration), Phys. Rev. Lett. 104, 241803, (2010).
- [19] S. U. Chung et al., Phys. Rev. D 65, 072001, (2002); M. Lu et al., Phys. Rev. Lett. 94, 032002, (2005).
- [20] G. S. Adams et al., Phys. Rev. Lett. 81, 5760 (1998); Y. Khokhlov, Nucl. Phys. A 663, 596 (2000); E. I. Ivanov et al., Phys. Rev. Lett. 86, 3977 (2001).
- [21] J. D. Hansen et al., Nucl. Phys. B 81, 403, (1974).
- [22] B. Grube, arXiv:1108.5709[hep-ex], to appear in the proceedings of 19th International Conference on Particles and Nuclei (PANIC 11), Cambridge, Massachusetts, USA, 24-29 Jul 2011.
- [23] G. S. Adams et al. (CLEO Collaboration), Phys. Rev. D 84, 112009 (2011).
- [24] H.-B. Li (BESIII Collaboration), arXiv:1108.5789 [hep-ex]; Plenary talk at XIV International Conference on Hadron Spectroscopy (Hadron-2011), June 13-17, 2011, Munchen, Germany.
- [25] M. Ablikim et al. (BES Collaboration), Phys. Rev. Lett. 95, 262001 (2005).
- [26] C. Amsler and N. A. Tornqvist, Phys. Rev. 389, 61 (2004); E. Klempt and A. Zaitsev, Phys. Rep. 454, 1 (2007); Y. Chen et al., Phys. Rev. D 73, 014516 (2006).
- [27] M. Ablikim et al. (BES Collaboration), Phys.Rev.Lett. 106, 072002,(2011).
- [28] M. Ablikim et al. (BES Collaboration), Phys. Rev. Lett. 107, 182001 (2011)
- [29] J. Z. Bai et al. (BES Collaboration), Phys. Rev. Lett. 91, 022001 (2003).
- [30] J. P. Alexander et al. (CLEO Collaboration), Phys. Rev. D 82, 092002, (2010).
- [31] M. Ablikim et al. (BES Collaboration), arXiv: 1112.0942 [hep-ex], submitted to Phys. Rev. lett..
- [32] A. Sirbirtsen et al., Phys. Rev. D 71, 054010 (2005).
- [33] G. Y. Chen et al., Phys. Lett. B 692, 136 (2010).
- [34] B. S. Zou and H. C. Chiang, Phys. Rev. D 69, 034004 (2003).
- [35] R. M. Baltrusaitis et al. (Mark-III Collaboration), Phys. Rev. D 33, 629 (1986).
- [36] J. Z. Bai et al. (BES Collaboration), Phys. Lett. B 555, 174 (2003).
- [37] D. M. Asner et al. (CLEO Collaboration), Phys. Rev. Lett. 92, 142001 (2004).
- [38] B. Aubert et al. (BABAR Collaboration), Phys. Rev. Lett. 92, 142002 (2004).
- [39] S. Uehara et al. (Belle Collaboration), Eur. Phys. J. C 53, 1 (2008).
- [40] A. Vinokurova et al. (Belle Collaboration), arXiv:1105.0978 [hep-ex].
- [41] R. E. Mitchell et al. (CLEO Collaboration), Phys. Rev. Lett. 102, 011801 (2009).
- [42] V. V. Anashin et al. (KEDR Collaboration), arXiv:1012.1694.
- [43] M. Ablikim et al. (BESIII Collaboration), arXiv:1111.0398v1, submitted to Phys. Rev. Lett..
- [44] E. Eichten, K. Gottfried, T. Kinoshita, K. D. Lane and T.-M. Yan, Phys. Rev. D17, 3090 (1978).
- [45] S.-K. Choi et al. (Belle Collaboration), Phys. Rev. Lett. 89, 102001 (2002).
- [46] D. M. Asner et al. (CLEO Collaboration), Phys. Rev. Lett. 92, 142001 (2004).
- [47] B. Aubert et al. (BABAR Collaboration), Phys. Rev. Lett. 92, 142002 (2004).
- [48] B. Aubert et al. (BABAR Collaboration), Phys. Rev. D 72, 031101 (2005).
- [49] C. Edwards et al. (Crystal Ball Collaboration), Phys. Rev. Lett. 48, 70 (1982).
- [50] D. Cronin-Hennessy et al. (CLEO Collaboration), Phys. Rev. D 81, 052002 (2010).
- [51] B. Aubert et al. (Babar Collaboration), Phys. Rev. D 78, 012006 (2008).
- [52] E. J. Eichten, K. Lane and C. Quigg, Phys. Rev. Lett. 89, 162002 (2002).
- [53] A. Vinokurova et al. (Belle Collaboration), arXiv:1105.0978.
- [54] P. del Amo Sanchez et al. (BABAR Collaboration), Phys. Rev. D 84, 012004 (2011).
- [55] M. Ablikim et al. (BESIII Collaboration), Phys. Rev. Lett. 104, 132002 (2010).
- [56] V. V. Anashin et al. (KEDR Collaboration), arXiv:1109.4205[hep-ex].
- [57] M. Ablikim et al., Phys. Rev. Lett. 101, 102004, (2008).
- [58] M. Z. Yang, Mod. Phys. Lett. A 23, 3113, (2008).
- [59] H. B. Li, X. S. Qin and M. Z. Yang, Phys. Rev. D 81,011501, (2010).
- [60] A. D. Bukin, arXiv:0710.5627 [physics.data-an].
- [61] B. Aubert et al. (BABAR Collaboration), Phys.Rev. D 76,111105(R) (2007).
- [62] M. Ablikim et al. (BES Collaboration), Phys. Lett. B 660, 315, (2008).
- [63] S. F. Radford and W. W. Repko, Phys. Rev. D 75,074031, (2007).
- [64] J. M. Richard, Z. Phys. C 4, 211 (1980).
- [65] N. Brambilla et al., Eur. Phys. J. C 71, 1534,(2011).
- [66] B. Aubert et al. (BABAR Collaboration), Phys. Rev. D 71, 071103, (2005).
- [67] B. Aubert et al. (BaBar Collaboration), Phys. Rev. D 77, 111101(R),(2008).
- [68] A. Abulencia et al. (CDF Collaboration), Phys. Rev. Lett. 98, 132002,(2007).
- [69] V. M. Abazov et al. (D0 Collaboration), Phys. Rev. Lett. 93, 162001 (2004).
- [70] V. Khachatryan et al. (CMS Collaboration), CMSPAS-BPH-10-018.
- [71] V. Khachatryan et al. (CMS Collaboration), CMS-DPS-2011/009.
- [72] R. Aaij et al. (LHCb Collaboration), arXiv:1112.5310 [hep-ex].
- [73] V. Bhardwaj et al. (Belle Collaboration), Phys. Rev. Lett. 107,091803, (2011).
- [74] F. E. Close and P. R. Page, Phys. Lett. B 578, 119 (2003); C.-Y. Wong, Phys. Rev. C 69, 055202 (2004); S. Pakvasa and M. Suzuki, Phys. Lett. B 579, 67 (2004); E. Braaten and M. Kusunoki, Phys. Rev. D 69, 114012 (2004); E. S. Swanson, Phys. Lett. B 588, 189 (2004); D. Gamermann and E. Oset, Phys. Rev. D 80, 014003 (2009)& Phys. Rev. D 81, 014029 (2010).
- [75] S.-K. Choi et al. (Belle Collaboration), Phys. Rev.D 84, 052004, (2011).
- [76] L. Maiani et al., Phys. Rev. D 71, 014028 (2005). See also M. Karliner and H. J. Lipkin, arXiv:1008.0203[hep-ph].
- [77] E.S. Swanson, Phys. Rep. 429, 243 (2006).
- [78] B. Aubert et al. (BaBar Collaboration), Phys. Rev. D 71, 031501 (2005).
- [79] N. A. Tornqvist, Phys. Lett. B 590, 209 (2004).
- [80] B. Aubert et al. (BaBar Collaboration), Phys. Rev. Lett. 102, 132001 (2009).
- [81] B. Aubert et al. (BABAR Collaboration), Phys. Rev. Lett. 95, 142001 (2005).
- [82] C. Z. Yuan et al. (BELLE Collaboration), Phys. Rev. Lett. 99, 182004 (2007).
- [83] B. Aubert et al. (BABAR Collaboration), Phys. Rev. Lett. 98, 212001 (2007).
- [84] X. L. Wang et al. (BELLE Collaboration), Phys. Rev. Lett. 99, 142002 (2007).
- [85] Q. He et al. (CLEO Collaboration), Phys. Rev. D 74, 091104 (2006).
- [86] T. E. Coan et al. (CLEO Collaboration), Phys. Rev. Lett. 96, 162003 (2006).
- [87] T. Aaltonen et al. (CDF Collaboration), Phys. Rev. Lett. 102, 242002,(2009).
- [88] T. Aaltonen et al. (CDF Collaboration), arXiv:1101.6058[hep-ex].
- [89] R. Aaij et al. (LHCb Collaboration), arXiv:1202.5087[hep-ex].
- [90] K.-F. Chen et al. (Belle Collaboration), Phys. Rev. Lett. 100, 112001 (2008).
- [91] T. K. Pedlar et al. (CLEO Collaboration), Phys. Rev. Lett. 107, :041803, (2011).
- [92] I. Adachi et al. (Belle Collaboration), Phys. Rev. Lett. 108, 032001,(2012); arXiv:1105.4583[hep-ex].
- [93] A. E. Bondar, talk at FPCP2011, arXiv:1109.4476[hep-ex].
- [94] A. E. Bondar et al. (Belle Collaboration), arXiv:1110.2251 [hep-ex]
- [95] A.E.Bondar et al., Phys. Rev. D 84, 054010 (2011); M. B. Voloshin arXiv:1105.5829[hep-ph].