Interface-driven phase separation in multifunctional materials: the case of GeMn ferromagnetic semiconductor
Abstract
We use extensive first principle simulations to show the major role played by interfaces in the mechanism of phase separation observed in semiconductor multifunctional materials. We make an analogy with the precipitation sequence observed in over-saturated AlCu alloys, and replace the Guinier-Preston zones in this new context. A new class of materials, the phases, is proposed to understand the formation of the coherent precipitates observed in the GeMn system. The interplay between formation and interface energies is analyzed for these phases and for the structures usually considered in the literature. The existence of the phases is assessed with both theoretical and experimental arguments.
pacs:
71.15.Nc, 75.50.Pp, 61.46.-wIntroduction
Multifunctional materials have drawn a lot of attention in recent years because of their intrinsic scientific interest and for the huge technological possibilities they offer. Indeed these materials simultaneously exhibit two or more characteristics that are usually incompatible: ferroelectricity and ferromagnetism for multiferroics, uncorrelated thermal and electrical conductivity for thermoelectrics, or semiconductor (SC) character and ferromagnetism. Some homogeneous materials are available, however they usually exhibit weak properties or are limited to very low temperatures Sato et al. (2010). In order to open a broader range of opportunities, heterogeneous materials have been proposed as an efficient way to couple strong responses at room temperature Nan et al. (2008). Among the multifunctional materials, those based on semiconductors yield great promises, and similar enhancements are expected in nanostructured media for thermoelectricity Mingo et al. (2009) and magnetic semiconductivity Ohno (1998). Regarding this last issue, it has been shown that depending on the solubility limit and the growth temperature, magnetic impurities tend to make a solid solution and form dilute magnetic semiconductor (DMS), or gather in solute-rich precipitates via a phase separation process Sato et al. (2010). The formation of elongated nano-clusters observed in several systems such as Al(Cr)N (Ref. Gu et al., 2005) or (Ge,Mn)-nanocolumns Jamet et al. (2006) is a way of getting the attractive heterogeneous materials discussed above. Controlling the growth thanks to a detailed understanding of the phase separation mechanism, is a prerequisite for their efficient use to design new multifunctional materials.
As a new perspective, it is well known from physical metallurgy that phase separation into an over-saturated solid solution can occur via a three-step mechanism, for example in the AlCu system Murray (1985): i) the solute atoms diffuse in the host matrix to form Guinier-Preston (GP) zones, which are solute-rich zones (also referred to as ) that keep the host matrix atomic structure; ii) these zones transform to a secondary metastable phase (, isostructural to CaF2) that is fully coherent with the host matrix, thus minimizing interface energy ; iii) a last transformation occurs with the formation of the stable Al2Cu phase which is structurally incompatible with the host matrix. It is clear in this sequence that interfaces play a major role, especially in the stabilization of the metastable phase.
In this article, we show that this interface-driven mechanism is also relevant in the case of magnetic semiconductors, but with specificities not taken into account up to now. In order to get a deeper insight into the problem, we consider the GeMn system as a prototype, in which either dilute Mn atoms Zeng et al. (2008); Yada et al. (2010), Mn-rich nanocolumns Jamet et al. (2006); Bougeard et al. (2006); Li et al. (2007) (NC), or precipitates of the stable phase Sato et al. (2010); Wang et al. (2008) are observed depending on the growth conditions.
The AlCu precipitation sequence can be applied in the case of the GeMn system with the phase being the compound while the and phases as revealed in the nanocolumns remain unknown. This analysis is more complete than the simple spinodal decomposition scheme Sato et al. (2010) that only focuses on the first stage of the former sequence leading to a coherent solute-rich solid solution (i.e. DMS ). Still, the precipitation sequence needs to be slightly adapted. On one hand, in the case of AlCu, one deals with compact metallic phases with atomic structures and chemical behaviors basically all compatible in essence, leading to easy mixing, formation of solid solutions and natural interfaces. On the other hand, in the case of dilute semiconductors, the involved phases display non compact structures (diamond or wurtzite) for the host, and much more compact phases for precipitates, with very little structural and chemical compatibility to one anotherArras et al. (2011), leading to strong chemical segregation and incoherent interfaces.
The thorough study of two types of GeMn materials in bulk conditions, followed by the introduction of their interfaces with the semiconductor matrix, allows us to unravel not only the mechanisms behind this variety of precipitates, but also the atomic structure of the GeMn nanocolumns. This yields a new understanding and potential control over these complex and very promising heterogeneous systems.
I Method
We use the density functional theory (DFT) framework, within the projector augmented-wave approach (PAW) and the generalized gradient approximation (GGA) for the exchange-correlation energy, as implemented in the abinit code Gonze et al. (2005); Torrent et al. (2008). The details are those used in Ref. Arras et al., 2011. In particular, the pseudopotentials have been generated with the atompaw codeHolzwarth et al. (2001). They correspond to valence electron states 4 and 4 for Ge and 3 and 4 for Mn. The -point meshes and the cutoff energy ensure an error on the total DFT energy lower than 0.1 eV/atom.
Since we want to compare the stability of phases with different values of the Mn concentration, , we calculate their formation energies per atom:
| (1) |
where is the energy per atom found with our first-principle calculations, and are the chemical potential of Mn and Ge, respectively. When manganese atoms are introduced in a germanium matrix, the ultimate system obtained after annealing is composed of Mn11Ge8 grains embedded in the diamond lattice of germanium. Therefore, these crystals, Mn11Ge8 and Ge, are the two reference systems we have considered to determine and . When two phases and , with different compositions, are coexisting, the chemical potentials can be derived by considering the thermodynamic semi-grand canonical potential as described in Ref. Arras et al., 2011:
| (2a) | |||||
| (2b) | |||||
When is the Ge diamond lattice and is the Mn11Ge8 compounds, we get:
| (3a) | |||||
| (3b) | |||||
It can be checked that the formation energies [Eq. (1)] of the Ge lattice and the Mn11Ge8 compound (or a mixture of them) are zero, since they are the chosen reservoirs of atoms in the semi-grand canonical ensemble. Note that a less natural, but reasonable, choice would have been to choose the compound Mn5Ge3 as a reference, since it has a composition close to that of Mn11Ge8 and has a simpler unit cell. The difference on the formation energies of the compounds studied here would only have been of the order of 10 meV.
This methodology has proven to well reproduce both the properties and the stability of all known (Ge, Mn) compounds Arras et al. (2011), despite the necessary and usual approximations used.
II The solid-solution hypothesis
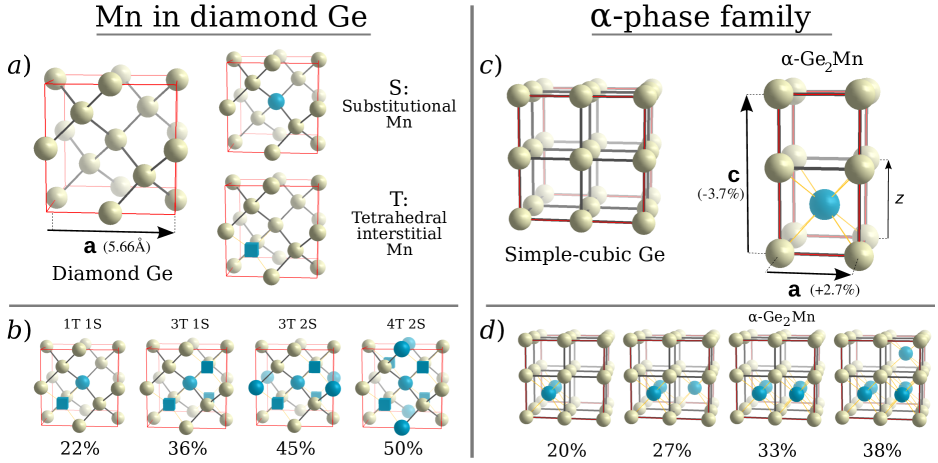
We start with the assumption accepted so far Jamet et al. (2006); Devillers et al. (2007); Bougeard et al. (2006); Li et al. (2007) that the binding energy between magnetic impurities in the diamond structure drives the formation of a solid solution inside the nanocolumns Fukushima et al. (2006). Those are thus supposed to be domains where the concentration of Mn impurities is locally increased, yet with little effect on the diamond structure. Since the Mn atoms could incorporate substitutionally or interstitially into the diamond Ge crystal lattice, we test the solid-solution assumption by considering a class of materials based on both Mn defects (see Fig. 1a). More specifically, we use cubic cells of 5.658 Å of side (8 atoms of Ge), and consider all the possible combinations of substitutional and tetrahedral interstitial Mn atoms up to a concentration of 60%. In the following, we name TS a solid solution with Mn in tetrahedral interstitial sites and Mn in substitution per cubic unit cell, hence with a concentration where and . The restriction to these only two defects is based on observations by transmission electron microscopy showing a clear crystalline continuity between Mn-rich regions and diamond Ge along the [001] direction, thus discarding non crystal-aligned defects. In addition, our simulations of six different point defects involving one Mn atom and of nine associated Mn dimers confirm the energetic relevance of only the substitutional and tetrahedral interstitial defects (see appendix A). Finally, 27 non-equivalent configurations are tested (some examples are shown in Fig. 1b). Ferromagnetic and antiferromagnetic orders have been considered, and the antiferromagnetic configurations turn out to have the lowest energies.
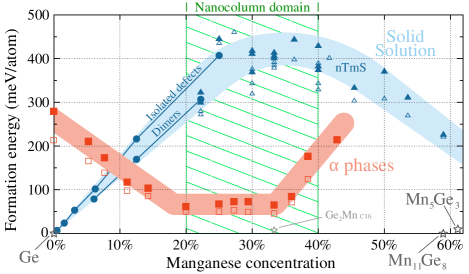
The evolution of the formation energy with the Mn content is reported on Fig. 2. First, we can see a steep increase of at low concentration (the slope being 1.5 eV/Mn atom), in agreement with the low solubility of Mn in Ge Luo et al. (2004). Then at higher concentration, the interactions between defects lower the formation energy . Consequently, the curve differs from a straight line, and the formation energy reaches a maximum around 400 meV/atom, before decreasing. The most significant result here is this hump-shaped curve with the maximum of the formation energy at 35% of Mn, i.e., within the concentration range of 15-40% for which the precipitates are observed experimentally Jamet et al. (2006); Devillers et al. (2007); Bougeard et al. (2006); Li et al. (2007). The absence of a minimum of in this experimental range rules out a hypothetical stability of a diamond based coherent solid solution.
Accordingly, our calculations show that neither a spinodal decomposition, nor the analog of the first step of an AlCu precipitation sequence can occur in the bulk of the matrix. In the latter case it would correspond to the so-called Guinier-Preston zones (also referred as phase). However, subsurface interstitials have been reported in Refs. Zhu et al., 2004; Zeng et al., 2008. We propose that this interstitial-rich solid solution at the surface could be in fact the phase, forming Guinier-Preston zones that will start the next precipitation step with a phase inside nanocolumns. In the following section, we propose a structure for such a phase.
III -phase structures
Since the previous section has shown that GeMn solid-solution precipitates are not compatible with the curve, we need an equivalent of the phase of AlCu, which is stabilized thanks to its natural interfaces with the host matrix. We propose a new class of materials based on the insertion of Mn into a simple-cubic crystal of Ge (Fig. 1c).
Such a structure was proposed to describe MnGe4, which is stable at high-pressure Takizawa et al. (1990). The exact structure was not determined experimentally, but – from similarity with Hg4Pt – it was suggested to involve Mn atoms placed every four interstitial positions, which are at the center of the Ge cubes. It exhibits a striking structural proximity with diamond Ge, with a mismatch of only -2.5% and -1.0% along the and directions, respectively Takizawa et al. (1990). However, the calculated formation energy reaches 180 meV/atom Arras et al. (2011).
Applying the same approach as for the TS compounds, we have tested 45 different atomic configurations of Mn interstitials, using various cell sizes to have a complete energy diagram of all cubic Ge-based compounds. We have discovered a whole family of low energy structures, based on the Ge2Mn phase shown in Fig. 1c, which is isostructural to FeSi2. We refer to it as the “-phase family” (see Fig. 1d). Such a variety in stoichiometry is common in the GeMn system, as illustrated by Mn3Ge alloys Arras et al. (2011). The calculated equilibrium lattice parameters of the perfect Ge2Mn phase are ==2.90 Å and =5.45 Å (Fig. 1c), leading to =0.94. Thus, despite its simple-cubic crystal structure, this compound exhibits a lattice mismatch with bulk Ge lower than 4% in all 3 directions, and a cell volume only 1.6% larger, in agreement with observations of Ref. Jamet et al., 2006. Also, a decrease in the Mn content is accompanied by a regular decrease of the cell size, as expected from the interstitial character of Mn atoms, leading to a cell volume at 20% Mn almost equal to that of bulk Ge, with .
Note that the new metastable Ge2Mn compound C16 described in Ref. Arras et al., 2010 is directly related to the “-phase family” but is distorted by a Jahn-Teller-type effect, making it strongly tetragonal and incompatible with the diamond structure.
Our calculations show that the Ge2Mn compound exhibits ferromagnetism, with a local moment on Mn atoms reaching 1 , and a polarization P0=-80% and P2=-83% (with definitions of P0 and P2 as in Ref. Mazin, 1999).
The formation energy of the phases displays a broad minimum around 60 meV/atom, at Mn concentrations ranging from 20% to 33%. Above 33%, Mn interstitial atoms must be added in the empty interstitial planes of Ge2Mn, at a formation energy cost of about 1 eV per Mn atom added. Below 20%, Mn planes of Ge2Mn become less than half filled and the formation energy increases rapidly, until the unstable simple-cubic Ge is left.
Thus, contrary to the TS configurations, the -phases family gives rise to a second minimum of energy versus stoichiometry compatible with a segregation mechanism. Furthermore, the flatness of the minimum in the 20 to 33% range, agrees with the different Mn concentrations observed in the nanocolumns by Jamet et al. (20%–33%) Jamet et al. (2006); Devillers et al. (2007), as well as in similar precipitates by Bougeard et al. (15%) Bougeard et al. (2006) and by Li et al. (17%–30%) Li et al. (2007).
Since the nanocolumns are embedded in the Ge matrix, the elastic energy has to be considered. We do not calculate exactly this energy, which depends on the nanocolumn distribution, but an upper bound of it. As shown in Fig. 2, we have calculated the formation energies of the possible structures either with their own lattices parameters, or constrained to be commensurate with the Ge lattice (hollow versus filled markers). The last situation corresponds to a state in which all the elastic constraints are localized inside the columns. In the reality, the matrix would also adapt to the stress in order to globally minimize this energy. Therefore, the energy difference between a phase constrained or not constrained by the Ge diamond lattice is an upper bound of the total elastic energy. These values turn out to be quite small – about 10 meV/atom – compared to other energy terms, and are thus fairly accurate approximations of the values of the elastic energy. More precisely, the formation energy of a given compound, including the elastic energy due to its embedding in the matrix of germanium, is located between the hollow and filled markers in Fig. 2.
IV Role of interfaces
The structural compatibility between diamond Ge and phases is of major importance here. We now evaluate interface energies within the usual slab approximation, i.e., from simulations of alternating crystalline layers. The surface energy , between two phases and , is thus defined by
| (4) |
where is the total boundary area and is the total internal energy in the periodic cell, and are the number of atoms in the layers of the respective phases, and are the formation energies [Eq. (1)]. Appendix B details the relation between this Eq. (4) and the thermodynamic semi-grand canonical ensemble. At equilibrium, the crystalline layers have not exactly the same lattice parameters parallel to the interface. Thus, to minimize the strain imposed to the layers by the common computer cell periodicities, the size of this cell is relaxed perpendicularly to the interface during the calculation of . Accordingly, the formation energies and in Eq. (4) are calculated with the same elastic conditions: fixed unit-cell periodicities except for the direction perpendicular to the interface. The width of the layers is increased until we get a convergence for better than 2 meV/Å2. This condition is achieved when the width of each compound is greater than 15 Å, i.e., a value that is of the same order of magnitude as the nanocolumn diameters.
The main interface orientations, [] and [], have been considered for the Ge/-Ge2Mn boundary. For each of these orientations, all possible atomic arrangements at the interface have been tested, resulting in 22 different configurations. The calculated interface energy between Ge2Mn and diamond Ge is found to be about 35 meV/Å2 for the lateral boundaries of the column (i.e., [] and [] orientations, the column axes being along []). For the interface perpendicular to the column axis, the interface energy is found larger: 63 meV/Å2, which is compatible with the cylindrical shape of the grains. These energies are to be compared with the larger value of for the interfaces between Mn5Ge3 and diamond Ge (Ref. Arras, 2010): 80 meV/Å2 (Mn5Ge3 [] on Ge [] and ); 87 meV/Å2 (Mn5Ge3 [] on Ge []). Only the boundary corresponding to Mn5Ge3 [] on Ge [] has a similar energy: 35 meV/Å2.
The transformation of the nanocolumns into rounded grains after annealing, shows that the nanocolumns are out of equilibrium. Above, we have introduced and calculated the main terms of energy: chemical energy, elastic energy and interface energy. We now want to take into account all of these terms and discuss the stability of the system depending on the particular distribution of Mn atoms.
First, we consider three types of large scale order: i) full homogeneous dilution of Mn atoms in the whole Ge diamond matrix; ii) nanocolumns with a high Mn concentration embedded in a matrix of germanium depleted in Mn; and iii) spherical clusters under similar conditions. The first case has been assumed in Refs. Zeng et al., 2008; Yada et al., 2010, with a growth at low temperature probably corresponding to a very limited atomic diffusion. The second situation has been obtained at intermediate temperature Jamet et al. (2006); Bougeard et al. (2006); the columnar shape has been linked to a predominance of surface diffusion during the growth Fukushima et al. (2006). Finally, the spherical clusters have been obtained with a high temperature growth Wang et al. (2008) or after annealingJamet et al. (2006), and therefore involve a three-dimensional (3D) diffusion.
Second, we compute the total energy for different atomic local orders: a) simple defects of the Ge diamond crystal; b) -Ge2Mn crystalline grains; or c) Mn5Ge3 crystalline grains. The details of the size and morphology are taken from Ref. Devillers et al., 2007: average Mn concentration of 4.1%, 30 000 columns per m2 (which together fix their mean diameter, 2 nm for Ge2Mn for instance), and spherical clusters of 10 nm in diameter.
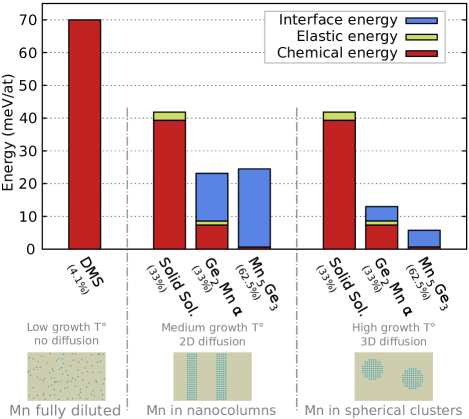
Figure 3 presents the energy contributions when the different chemical orders are considered. First, it appears that the solid solution is ruled out by its very high total energy, in both phase-separation cases. The case of full dilution has therefore to be limited to lower Mn contents. The high surface-to-volume ratio of the nanocolumns ( 2 nm-1 here as compared to 0.6 nm-1 for a 10-nm sphere) is indeed not high enough to favor a columnar solid solution: the low chemical energy of Ge2Mn compensates for its interface energy. On the other hand, is yet high enough to make the formation of Mn5Ge3 energetically unfavorable, because of its structural incompatibility with diamond-Ge, even if its formation energy is almost zero. Indeed, the lateral coherence of Ge2Mn with the Ge crystal, and the resulting low-interface-energy compensate in this case for its higher formation energy. Finally, in the case of spherical precipitates where the ratio is much smaller, the interface-energy advantage of Ge2Mn phase is not as crucial, and the Mn5Ge3 compound is found stable as observed experimentally.
From these observations, we can now propose a coherent precipitation sequence in the line of the three-stage precipitation sequence of Al2Cu (diluted ). The first stage (DMS ) corresponds to high surface-diffusion during the sample growthDevillers et al. (2007) and makes possible the precipitation of Mn-rich domains in the subsurface of the sample. Such a structure has not been studied in the present paper but is an extension of the reported subsurface interstitials Zhu et al. (2004); Zeng et al. (2008). The second stage () corresponds to the germination of a coherent phase from Mn interstitials. This phase has been identified as the proposed phase, which is more likely to be stabilized in the form of nanocolumns (Fig. 3). Finally, the last stage () is the transformation into the stable and less coherent Mn5Ge3 compound thanks to 3D diffusion. This latter transformation also leads to a change of the shape of the precipitates from columns to round-shape precipitates.
V Comparison to experimental results
In previous sections, we have assessed the stability of the phase based on theoretical arguments. We now want to analyze our previous experimental characterizations of the GeMn nanocolumns Jamet et al. (2006); Devillers et al. (2007); Rovezzi et al. (2008); Tardif et al. (2010a, b) taking into account the structure that we propose with the phase. In addition, we first present new results of high-resolution electron microscopy.
TEM —
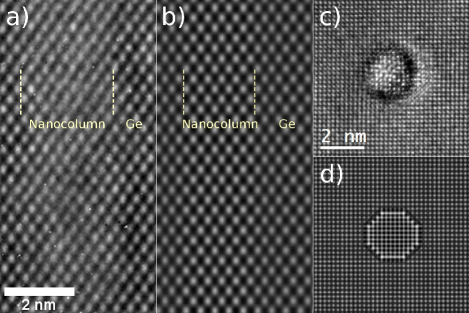
Up to this work, the hypothesis made for the nanocolumn structure was the solid-solution phase in particular because of its strong similarity with the germanium matrix when observed by transmission electron microscopy (TEM) as shown in Figs. 4a and c. Yet, the 0 0 1 atomic rows of the Ge2Mn phase also form a square lattice compatible with the diamond Ge peaks positions in Fig. 4c. The presence of two non-equivalent sub-lattices, one for Ge and one for Mn, corresponds to a super-structure which should be visible in plane view. However, these sub-lattices generate two variants depending on the position of the cell origin with respect to the diamond-Ge cell, and these two variants are expected to coexist inside each column, because of the very low interface energy of the anti-phase boundaries bridging them (we calculate it to be lower than 10 meV/Å2). We have included these two variants to calculate a TEM image of an unrelaxed -Ge2Mn nanocolumn in germanium (jems software Stadelmann (2004)), in cross section (Fig. 4b) and in plane view (Fig. 4d). The simulated images show a striking resemblance between phase and diamond Ge. The global contrast variation between the two phases is due to the manganese atoms, the germanium density being identical in both cases. Our calculations reproduce the dark rings around each column, corresponding to the structure discontinuity at the boundary.
Diffraction —
With the same inclusion of the two phase variants, we have computed the diffraction pattern of a collection of nanocolumns embedded in 100100 unit cells domains (see Ref. Tardif et al., 2010b for details on the column distribution and on the method). We find that the intensity is localized at the corresponding diamond diffraction peaks, and that the destructive interferences cancel the peaks due to the -phase sub-lattices.
EXAFS —
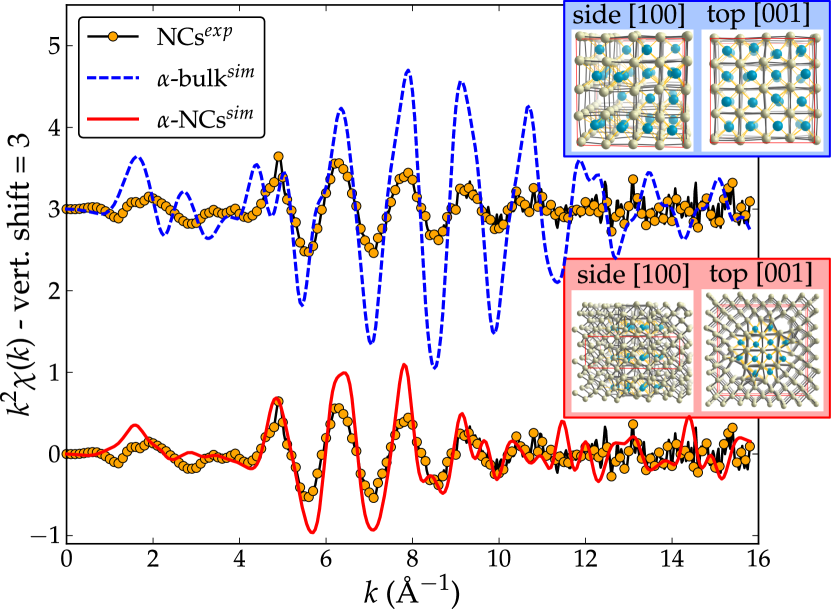
The Mn local atomic environment probed by extended X-ray absorption fine structure (EXAFS) spectroscopy at the Mn K-edge is also compatible with the proposed Ge2Mn phase when considered in the form of small nanocolumns (2 nm in diameter) embedded in a Ge matrix. To demonstrate this, a different approach to the standard EXAFS analysis is adopted. Instead of fitting the EXAFS signal with a set of theoretical scattering paths coming from Mn simple defects in Ge or clusters from well-known bulk structures (e.g., Mn5Ge3), as previously done by our group Rovezzi et al. (2008) and others Gunnella et al. (2010), we proceed in a qualitative analysis of the simulated EXAFS spectra based on molecular dynamics (MD) calculations of large relaxed cubic cells containing 96 atoms and 11.315 Å of side, using the experimental lattice parameter of germanium D’Acapito (2011). Due to the fact that we are considering complex structures with multiple absorbing sites, this approach has the advantage to correctly account for both the configurational and dynamical disorders. In fact, the EXAFS spectra are obtained by averaging the spectra of the single Mn atoms in the structure on the last 200 frames of the MD calculation 111The molecular dynamics calculations are carried out within the Density Functional Theory formalism. The canonical ensemble, NVT was used with 1000 time steps of 2 fs each with a target temperature of 300 K stabilized via a Nose thermostat. and successively averaging over all the Mn atoms in the cell. For each configuration, a cluster of = 8 Å around a central Mn atom is considered, and the simulations are carried out using the multiple scattering formalism with the Hedin-Lundqvist exchange potential as implemented in the feff8 code Ankudinov et al. (1998).
In Fig. 5 the simulated EXAFS spectra for the Ge2Mn phase in bulk form (-bulksim) and as nanocolumns embedded in Ge (-NCssim) are compared with the experimental data collected from a sample containing Mn-rich nanocolumns with a nominal Mn doping of 6% – details are given in Ref. Rovezzi et al., 2008. Both structures reproduce well the frequency of the experimental data, due to the value of the main Mn-Ge first shell distance of 2.51 Å( 2% increase to respect bulk Ge) found by the previous calculations for the phase. There is a considerable difference in the amplitude of the oscillations and their shape in the low- region. In fact, the double bump at 3 4 Å-1 that is the fingerprint of the nanocolumns Rovezzi et al. (2008) and the peak at = 5 Å-1 are better reproduced when moving from the bulk form to embedded nano-objects. This is demonstrated by the strong amplitude reduction when moving from the bulk (-bulksim) to the ideal nanocolumn (-NCssim). This difference can be ascribed to the large number of Mn atoms located at the interface with the Ge matrix of which local environment is too highly distorted to generate a coherent oscillation. Indeed, for nanocolumns of 2 nm in diameter, half of the Mn atoms are at the interface and are displaced by more than 0.2 Å as compared to perfect Ge2Mn. In fact, the first-shell coordination number found for -bulksim is 8.50.5 while it is 5.50.5 for -NCssim. The strong decrease of illustrates a new way of interpreting the global coordination number of 4.00.5 found experimentally, not as a single low coordinated site but as a mixture of different Mn environments (in the nanocolumns, at their interfaces and diluted in Ge).
XAS, XMCD, and magnetometry —
Finally, the computed electronic properties of the phases and their ferromagnetism are in line with the metallic character observed by X-ray absorption spectroscopy (XAS) at Mn L edge Tardif et al. (2010a) and the experimental magnetic local moment around 1 Jamet et al. (2006); Devillers et al. (2007) from magnetometry and X-ray magnetic circular dichroism (XMCD). In particular, it was shown that precise eigenvalues of the initial 2-states were necessary to obtain accurate DFT-calculated XAS and XMCD spectra Tardif (2011). The Curie temperature could not be calculated using standard techniques Slipukhina et al. (2009) because of the extreme variety of environments. However the values of 340 K and 1.2 /Mn measured for the high-pressure MnGe4 compound Takizawa et al. (1990) give an idea of the potentialities of these phases.
Conclusions
We have considered two types of (Ge,Mn) compounds as possible candidates for coherent nanocolumn precipitates in germanium: i) a solid-solution model based on diamond Ge with substitutional and interstitial Mn atoms; ii) a new intermetallic compound with the Mn atoms at interstitial sites of a simple-cubic Ge crystal and referred to as the phase. Our results show that the first hypothesis of a solid solution is not compatible with the experimental manganese concentration, which is between 15% and 40%. On the other hand, the proposed metastable phase is coherent with the diamond structure of the matrix with which it has a low interfacial energy.
The solid solution has a negligible interfacial energy with diamond Ge, but a high formation energy. Conversely, the compound Mn5Ge3 has a negligible formation energy, but a high interfacial energy. The growth conditions yield columns, which have a high ratio. We have shown that with such a geometry, the -phase nanocolumns have a favorable balance between these two energy terms. Thus, the geometry imposed by the material growth stabilizes this otherwise metastable compound.
The phase has a coherent interface with the germanium matrix and has a close connection with a simple cubic lattice. Experimentally, it is difficult to distinguish it from an hypothetical diamond cubic Ge lattice with highly concentrated Mn impurities. Although our argument in favor of the phase as a constituent of the nanocolumns is based on theoretical results, we have shown these results are coherent with the experimental data available so far.
Finally, with the GeMn system as a prototype, we have adapted the three-step mechanism of precipitation in the AlCu system to rationalize the formation of coherent solute-rich precipitates in magnetic semi-conductors, the phase playing the same role as the metastable Al2Cu phase. Such an analysis would also prevail for others multifunctional semi-conductors where heterogeneous materials are used to tailor two or three different properties.
Acknowledgements.
The simulations were performed at the CEA supercomputing center (CCRT), and part of this study was funded by ANR GEMO. The EXAFS and DFT-MD simulations were carried out at the CORAL cluster of ESRF.Appendix A The manganese point defects in diamond germanium
A.1 Introduction
This appendix is the starting point of our analysis of the Ge–Mn solid solution done in section II. Indeed, we detail here the results regarding the point defects consisting of dilute Mn atoms in the Ge diamond structure and the dimers of such defects. We address in particular the issue of their formation energy and their magnetic moment.
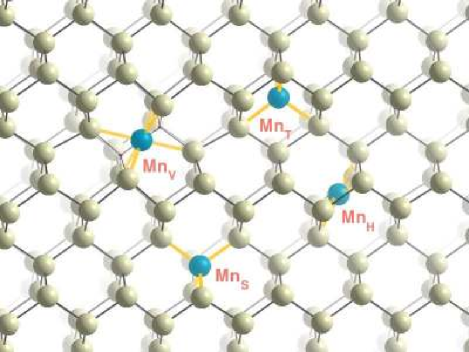
We consider the six following defects:
-
•
Mn : the substitutional position, which is the mere replacement of a Ge atom by a Mn atom;
-
•
Mn : the tetrahedral interstitial, in which the Mn atom is inserted in the bigger hole of the diamond structure;
-
•
Mn : the hexagonal interstitial, for which the Mn atom resides at the center of a Ge (non-planar) hexagon;
-
•
Mn : the split-vacancy, which is the final stable configuration of the initial combination of a vacancy and a neighboring substitutional Mn atom;
-
•
Mn : the “dumbbell” interstitial, for which one Mn and one Ge share one lattice site;
-
•
Mn : the ffcd (fourfold coordinated point defect Goedecker et al. (2002)), which is a defect where bonds are rearranged keeping constant the coordination number of each atom. In our case, one of the two central atoms composing this defect is a Mn atom.
We can split these defect into three categories, depending on the deviation in the number of atoms compared to the pure diamond lattice: i) those with zero variation (Mn, Mn), those for which one atom is removed (Mn), and those for which one atom is added (Mn, Mn, Mn). Among all these defects, two are found unstable upon structural relaxation, namely Mn and Mn. They become Mn and Mn respectively. The four others are presented on Fig. 6.
| Defect | (eV) | |||||
|---|---|---|---|---|---|---|
| this work | Ref. Luo et al., 2004111The shown results have been adapted to take into account reference energy differences. | Ref. Continenza et al., 2006111The shown results have been adapted to take into account reference energy differences. | () | (Å) | ||
| Mn | 0 | 1.5 | 1.6 | 2.0 | 3 | 2.453 (-1.8%) |
| Mn | +1 | 2.0 | 2.3 | 3.0 | 5 | 2.586 (+3.6%) |
| Mn | +1 | 2.3 | 5 | 2.518 (+5.2%) | ||
| Mn | -1 | 2.8 | 4 | 2.761 (-12.1%) | ||
| Defect | |||||
|---|---|---|---|---|---|
| (eV/Mn) | (eV) | () | (Å) | ||
| Mn | 0 | 1.7 | -0.8 | 0 | 2.00 (-20.0%) |
| Mn | +2 | 2.2 | 0.2 | 7 | 2.52 (+0.1%) |
| Mn | +1 | 1.3 | -0.3 | 0.3 | 2.45 (-2.0%) |
| Mn | +1 | 2.4 | -0.1 | 0 | 2.31 (-7.4%) |
| Mn | +0 | 1.9 | -0.6 | 0 | 2.34 (-6.5%) |
| MnS111Simulated in a 32 atom box. | 0 | 1.7 | - | 3 | - |
A.2 Computational details
The DFT computation of heterogeneous defects in diamond Ge is not straightforward for three main reasons: i) due to the exchange-correlation approximation made for the calculation, the diamond-Ge gap is reduced to almost zero, and some localized electronic states of the defect could interact unrealistically with the diamond Ge conduction band; ii) again due to the exchange-correlation approximation, the equilibrium lattice parameter of diamond Ge is off by almost 2%, which is expected to have an impact on the defect characteristics; iii) the computation of the formation energy of the defects requires the use of reference energies, which is obvious for Ge, but not for Mn. We will now briefly detail how we intend to overcome these major issues.
Diamond-Ge gap and -points —
To investigate the properties of an isolated defect, one must ensure that the defect is actually isolated in the simulations. However, the standard DFT methods rely on periodic boundary conditions to be efficient, yielding the simulation of not one, but an infinite array of defects. The distance between image defects is thus a key parameter that controls the accuracy of the simulation. Here, we use cubic boxes that contain 64 Ge atom in the diamond structure. In this case, the distance between image defects is about 11.5 Å, i.e., large enough to prevent important interactions through the strain of the matrix. However, as noted earlier, electronic interactions may occur via the conduction band of the diamond Ge, artificially lowered by the exchange-correlation approximation. A way to limit this phenomenon is to purposely use a coarse -point mesh, along with special -pointsMakov et al. (1996), to minimize the dispersive characteristic of the defect states. Sufficient -point mesh density must however be used to reproduce accurately the diamond Ge crystal. In the following calculations, we use a -point mesh that ensures errors lower than 5 meV/atom on the energy and 0.05% on the lattice parameter of the Ge crystal. It corresponds to a set of four points in the 64-atom box (by symmetry, only one inequivalent -point), and for the two-atom diamond unit cell, to a Monkhorst-Pack grid Monkhorst and Pack (1976) with the four usual shifts ([ ], [ ], [ ], [ ]). This method is particularly efficient regarding the magnetic moment, as it gives the correct integer value in unit, i.e., the one obtained for bigger boxes, whereas a larger mesh, for example, in the 64-atom box, gives wrong fractional values.
Lattice parameter and strain —
The DFT calculated equilibrium lattice parameter of diamond Ge is found larger than the experimental value by 1.9% with the usual Perdew-Burke-Ernzerhof (PBE) GGA approximation done in this article. Hybrid functionals may reproduce the lattice parameter with a better agreement as shown in Ref. Stroppa et al., 2011. Here, to directly evaluate the impact of the lattice parameter deviation on the characteristics of the defects, we compute them not only with this equilibrium lattice parameter, but also with 4 other lattice parameters shifted by: -4% ( +10 GPa); -2% ( +4 GPa); +2% ( -3 GPa); and +4% ( -5 GPa).
Formation energy —
The formation energy is given by a relation similar to Eq. (1), where this time the energy is not a quantity by atom but for the defect:
| (5) |
where is the DFT total energy of the cell, and are the partial numbers of atoms in the cell, and and the respective chemical potentials. This formula is quite straightforward when one sees the chemical potentials as reference energy, as it has been done in many previous works. The chemical potential of Ge, , is easy to determine, namely, by considering the energy per atom of the pure Ge crystal. However, has been given very different values in the previous works using many different references: the isolated Mn atom; the Mn atom as substitutional defect Zhu et al. (2004); the GeMn zinc-blend structure; the high temperature Mn phase Continenza et al. (2006); or the high pressure GeMn B20 phase Luo et al. (2004). Some authors do not even use references Zhu et al. (2008); Chen et al. (2009), but just give formation energy differences. We have considered none of these methods and, as described in Sec. I, we choose diamond Ge and Mn11Ge8 as the reference atom reservoirs.
A.3 Results
Simple defects —
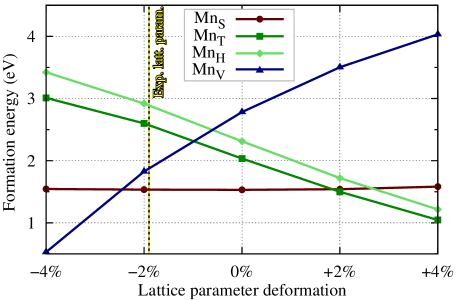
The results obtained for simple defects are gathered in Table 1. We can see that the substitutional Mn (Mn) is the most stable simple defect in diamond Ge, and exhibits a magnetic moment of 3 , as already shown by previous worksContinenza et al. (2006). We find the value of 1.5 eV for its formation energy, which explains the very low solubility of Mn in diamond Ge, and the initial slope of in Fig. 2. Magnetic moments are in accordance with other theoretical investigations, when their simulation boxes are large enough, or -point mesh coarse enough. Regarding the impact of the choice of lattice parameter on our results, the evolution of the formation energy versus the isotropic strain applied to the diamond is shown in Fig. 7. As expected, we observe that the slope of the energy curve versus strain depends on the type of defect, namely, if there are more or less atoms than in pure diamond Ge. In the substitutional case Mn, in which the number of atoms is conserved, strain has almost no impact, and the formation energy given in Table 1 is fairly accurate. On the contrary, for interstitials (Mn and Mn), a decrease of the lattice parameter (to come closer to the experimental lattice parameter) increases the formation energy. Oppositely, for the split vacancy Mn, the formation energy decreases with the lattice parameter. Thus, if Mn appears to be definitively the most stable defect, and Mn stabler than Mn, the question of the relative positioning of Mn remains.
Dimers —
To go a step further in the study of these defects, we now study the several possible associations of two close Mn atoms, i.e., dimers, in particular the following ones:
-
•
Mn : two substitutional Mn at first neighbor sites (2 Mn);
-
•
Mn : two tetrahedral interstitial Mn (2 Mn);
-
•
Mn : one substitutional Mn and one tetrahedral interstitial Mn (Mn+Mn);
-
•
Mn : the “dumbbell” interstitial, in which both atoms of the dimer are Mn, located on both sides of a lattice site;
-
•
Mn : the ffcd, in which both atoms composing the defect are Mn atoms.
Simulation box are here twice smaller than for simple defects, i.e., those of 32 atoms in the pure Ge crystal. Each dimer was tested in both ferromagnetic and antiferromagnetic configurations. Results are gathered in Table 2. In addition, the dimers Mn+Mn and Mn+Mn are found to be unstable. They relax toward Mn and Mn respectively.
Two points are worth noticing. First, as already proposed Continenza et al. (2006), the formation energy of Mn defects is reduced when they combine together, in particular from two Mn into one Mn. Second, dimers with the lowest energy (below 2 eV/Mn) are antiferromagnetic or ferrimagnetic.
Appendix B Interface energy
We detail in this appendix the calculation of the interface energy as done in section IV.
In this article, we have considered the thermodynamic semi-grand canonical ensemble Arras et al. (2011) to calculate the formation energy per atom at =0 of an alloy of and atoms as
| (6) |
where is the DFT energy per atom, and are the chemical potentials of respectively and atoms. The quantity is the concentration of atoms.
In a similar way, we can compute the total formation energy of a given system of atoms and atoms distributed in two phases and :
| (7) |
where the internal energy is the DFT total energy of the system.
Let and be the chemical potentials when the phases and are at equilibrium (i.e., and represent the atom reservoirs) Arras et al. (2011):
| (8a) | |||||
| (8b) | |||||
Note that the chemical compositions of and must be different for the denominators in Eq.( 8) to be nonzero. We restrict our discussion to this case. By definition, the formation energies of and phases are null for and and then Eq. (6) can also be written as
| (9a) | |||
| (9b) | |||
Now, we want to calculate the interface energy associated to the boundary between and . Energy is defined as the energy difference between the formation energy of the combined system and the total energies of the separated phases in bulk forms:
| (10) |
where and are the respective number of atoms in and phases.
This definition (10), allows us to compare different metastable structures of the interface, for instance, a mere juxtaposition of both types of crystal cells or rather reconstructions of the interface zone with different local atomic concentrations.
The respective numbers and of atoms in and are related to the numbers and by
| (11a) | |||||
| (11b) | |||||
This system of equations defines the numbers and if, and only if, the compositions of and phases are different. This is indeed the case since and correspond to the atom reservoirs that fix and [Eq. (8)].
From equations (9) and (11), we can relate the bulk part of the system energy to the deviations of the chemical potentials:
| (12) |
and replace this bulk energy in Eq.( 10) that becomes
| (13) |
Therefore, the interface energy of the boundary between the two phases is the formation energy of the system calculated for chemical potentials at which the phases are both at equilibrium so that their bulk formation energies vanish.
References
- Sato et al. (2010) K. Sato, L. Bergqvist, J. Kudrnovský, P. H. Dederichs, O. Eriksson, I. Turek, B. Sanyal, G. Bouzerar, H. Katayama-Yoshida, V. A. Dinh, T. Fukushima, H. Kizaki, and R. Zeller, Rev. Mod. Phys. 82, 1633 (2010).
- Nan et al. (2008) C.-W. Nan, M. I. Bichurin, S. Dong, D. Viehland, and G. Srinivasan, Journal of Applied Physics 103, 031101 (2008).
- Mingo et al. (2009) N. Mingo, D. Hauser, N. P. Kobayashi, M. Plissonnier, and A. Shakouri, Nano Letters 9, 711 (2009).
- Ohno (1998) H. Ohno, Science 281, 951 (1998).
- Gu et al. (2005) L. Gu, S. Y. Wu, H. Liu, R. Singh, N. Newman, and D. J. Smith, Journal of Magnetism and Magnetic Materials 290–291, Part 2, 1395 (2005), proceedings of the Joint European Magnetic Symposia (JEMS’ 04).
- Jamet et al. (2006) M. Jamet, A. Barski, T. Devillers, V. Poydenot, R. Dujardin, P. Bayle-Guillemaud, J. Rothman, E. Bellet-Amalric, A. Marty, J. Cibert, R. Mattana, and S. Tatarenko, Nat. Mater. 5, 653 (2006).
- Murray (1985) J. L. Murray, International Metals Reviews 30, 211 (1985).
- Zeng et al. (2008) C. Zeng, Z. Zhang, K. van Benthem, M. F. Chisholm, and H. H. Weitering, Phys. Rev. Lett. 100, 066101 (2008).
- Yada et al. (2010) S. Yada, R. Okazaki, S. Ohya, and M. Tanaka, App. Phys. Express 3, 123002 (2010).
- Bougeard et al. (2006) D. Bougeard, S. Ahlers, A. Trampert, N. Sircar, and G. Abstreiter, Phys. Rev. Lett. 97, 237202 (2006).
- Li et al. (2007) A. P. Li, C. Zeng, K. van Benthem, M. F. Chisholm, J. Shen, S. V. S. Nageswara Rao, S. K. Dixit, L. C. Feldman, A. G. Petukhov, M. Foygel, and H. H. Weitering, Phys. Rev. B 75, 201201 (2007).
- Wang et al. (2008) Y. Wang, J. Zou, Z. Zhao, X. Han, X. Zhou, and K. L. Wang, App. Phys. Lett. 92, 101913 (2008).
- Arras et al. (2011) E. Arras, D. Caliste, T. Deutsch, F. Lançon, and P. Pochet, Phys. Rev. B 83, 174103 (2011).
- Gonze et al. (2005) X. Gonze, G.-M. Rignanese, M. Verstraete, J.-M. Beuken, Y. Pouillon, R. Caracas, F. Jollet, M. Torrent, G. Zerah, M. Mikami, P. Ghosez, M. Veithen, J.-Y. Raty, V. Olevano, F. Bruneval, L. Reining, R. Godby, G. Onida, D. Hamann, D. Allan, G. Zerah, F. Jollet, M. Torrent, A. Roy, M. Mikami, P. Ghosez, J.-Y. Raty, and D. Allan, Zeit. Kristallogr. 220, 558 (2005).
- Torrent et al. (2008) M. Torrent, F. Jollet, F. Bottin, G. Zerah, and X. Gonze, Comput. Mat. Science 42, 337 (2008).
- Holzwarth et al. (2001) N. Holzwarth, A. Tackett, and G. Matthews, Computer Physics Communications 135, 329–347 (2001).
- Devillers et al. (2007) T. Devillers, M. Jamet, A. Barski, V. Poydenot, P. Bayle-Guillemaud, E. Bellet-Amalric, S. Cherifi, and J. Cibert, Phys. Rev. B 76, 205306 (2007).
- Fukushima et al. (2006) T. Fukushima, K. Sato, H. Katayama-Yoshida, and P. H. Dederichs, Japanese Journal of Applied Physics 45, L416 (2006).
- Luo et al. (2004) X. Luo, S. B. Zhang, and S.-H. Wei, Phys. Rev. B 70, 033308 (2004).
- Zhu et al. (2004) W. Zhu, H. H. Weitering, E. G. Wang, E. Kaxiras, and Z. Zhang, Phys. Rev. Lett. 93, 126102 (2004).
- Takizawa et al. (1990) H. Takizawa, T. Sato, T. Endo, and M. Shimada, Journal of Solid State Chemistry 88, 384 (1990).
- Arras et al. (2010) E. Arras, I. Slipukhina, M. Torrent, D. Caliste, T. Deutsch, and P. Pochet, Appl. Phys. Lett. 96, 231904 (2010).
- Mazin (1999) I. I. Mazin, Phys. Rev. Lett. 83, 1427 (1999).
- Arras (2010) E. Arras, Theoretical study of the structure and stability of GeMn alloys in the context of spintronics (in French), Ph.D. thesis, University of Grenoble - France (2010).
- Rovezzi et al. (2008) M. Rovezzi, T. Devillers, E. Arras, F. d’Acapito, A. Barski, M. Jamet, and P. Pochet, Appl. Phys. Lett. 92, 242510 (2008).
- Tardif et al. (2010a) S. Tardif, S. Cherifi, M. Jamet, T. Devillers, A. Barski, D. Schmitz, N. Darowski, P. Thakur, J. C. Cezar, N. B. Brookes, R. Mattana, and J. Cibert, App. Phys. Lett. 97, 062501 (2010a).
- Tardif et al. (2010b) S. Tardif, V. Favre-Nicolin, F. Lançon, E. Arras, M. Jamet, A. Barski, C. Porret, P. Bayle-Guillemaud, P. Pochet, T. Devillers, and M. Rovezzi, Phys. Rev. B 82, 104101 (2010b).
- Stadelmann (2004) P. Stadelmann, “Jems, ems java version,” (2004).
- Gunnella et al. (2010) R. Gunnella, L. Morresi, N. Pinto, A. D. Cicco, L. Ottaviano, M. Passacantando, A. Verna, G. Impellizzeri, A. Irrera, and F. d’Acapito, Journal of Physics: Condensed Matter 22, 216006 (2010).
- D’Acapito (2011) F. D’Acapito, Semiconductor Science and Technology 26, 064004 (2011).
- Note (1) The molecular dynamics calculations are carried out within the Density Functional Theory formalism. The canonical ensemble, NVT was used with 1000 time steps of 2 fs each with a target temperature of 300 K stabilized via a Nose thermostat.
- Ankudinov et al. (1998) A. L. Ankudinov, B. Ravel, J. J. Rehr, and S. D. Conradson, Phys. Rev. B 58, 7565 (1998).
- Tardif (2011) S. Tardif, GeMn nanocolumns: magnetic and structural properties in light of synchrotron radiation, Ph.D. thesis, University of Grenoble, France (2011).
- Slipukhina et al. (2009) I. Slipukhina, E. Arras, P. Mavropoulos, and P. Pochet, App. Phys. Lett. 94, 192505 (2009).
- Goedecker et al. (2002) S. Goedecker, T. Deutsch, and L. Billard, Phys. Rev. Lett. 88, 235501 (2002).
- Continenza et al. (2006) A. Continenza, G. Profeta, and S. Picozzi, Phys. Rev. B 73, 035212 (2006).
- Makov et al. (1996) G. Makov, R. Shah, and M. C. Payne, Phys. Rev. B 53, 15513 (1996).
- Monkhorst and Pack (1976) H. J. Monkhorst and J. D. Pack, Phys. Rev. B 13, 5188 (1976).
- Stroppa et al. (2011) A. Stroppa, G. Kresse, and A. Continenza, Phys. Rev. B 83, 085201 (2011).
- Zhu et al. (2008) W. Zhu, Z. Zhang, and E. Kaxiras, Physical Review Letters 100, 027205 (2008).
- Chen et al. (2009) H. Chen, W. Zhu, E. Kaxiras, and Z. Zhang, Physical Review B (Condensed Matter and Materials Physics) 79, 235202 (2009).