Thermodynamic phase diagram and phase competition in BaFe2(As1-xPx)2 studied by thermal expansion
Abstract
High-resolution thermal-expansion and specific-heat measurements were performed on single crystalline BaFe2(As1-xPx)2 (, ). The observation of clear anomalies allows to establish the thermodynamic phase diagram which features a small coexistence region of SDW and superconductivity with a steep rise of on the underdoped side. Samples that undergo the tetragonal-orthorhombic structural transition are detwinned in situ, and the response of the sample length to the magneto-structural and superconducting transitions is studied for all three crystallographic directions. It is shown that a reduction of the magnetic order by superconductivity is reflected in all lattice parameters. On the overdoped side, superconductivity affects the lattice parameters in much the same way as the SDW on the underdoped side, suggesting an intimate relation between the two types of order. Moreover, the uniaxial pressure derivatives of are calculated using the Ehrenfest relation and are found to be large and anisotropic. A correspondence between substitution and uniaxial pressure is established, i.e., uniaxial pressure along the -axis (-axis) corresponds to a decrease (increase) of the P content. By studying the electronic contribution to the thermal expansion we find evidence for a maximum of the electronic density of states at optimal doping.
pacs:
74.70.Xa, 74.25.Bt, 74.62.Dh, 74.62.FjI Introduction
In the intensively studied 122 family of iron-based superconductors, superconductivity can be induced by various substitutions in BaFe2As2 (Ba122), e.g., K for Ba, Co or Ru for Fe and also P for As, as well as by hydrostatic pressureRotter et al. (2008); Sefat et al. (2008); Sharma et al. (2010); Jiang et al. (2008); Kasahara et al. (2010); Alireza et al. (2009). In all cases, the resulting phase diagrams are surprisingly similar: a superconducting dome arises when the magneto-structural transition of the parent compound is suppressed by either increasing doping levels or increasing pressure. The isovalent substitution of As by P in BaFe2(As1-xPx)2 (P-Ba122) with a maximum of K is particularly interesting since (nominally) no additional charge carriers are introduced. Observation of the de Haas-van Alphen (dHvA) effect for (Refs. Shishido et al., 2010; Analytis et al., 2010) demonstrates the low scattering rate of the defects introduced by P substitution. Similarly, the absence of quasiparticle scattering by the dopant atoms in this system was demonstrated in a study on vortex pinningvan der Beek et al. (2010). It was also found that the phase diagram of P-Ba122 can be tracked with hydrostatic pressure from any starting P concentrationKlintberg et al. (2010), suggesting that pressure is somehow equivalent to doping, as has also been found for the Co-doped systemDrotziger et al. (2010); Meingast et al. (2011). Evidence for a quantum critical point close to optimal doping was obtained from non-Fermi liquid transportKasahara et al. (2010), nearly zero Curie-Weiss temperature in NMRNakai et al. (2010) and mass enhancement in dHvA measurementsShishido et al. (2010).
Here, we present a study of thermodynamic properties of the P-Ba122 system focusing on the underdoped and slightly overdoped regime () using thermal-expansion, specific-heat and magnetization measurements. Thermal expansion of single crystals probes the uniaxial pressure dependence of the entropy and is therefore well suited to study the effect of pressure on superconductivity and spin-density-wave (SDW) ordering. Uniaxial pressure effects are expected to be quite important in this class of materials due to their anisotropic crystal structureHardy et al. (2009); Bud’ko et al. (2009); Meingast et al. (2011). High-resolution thermal-expansion measurements also provide an ideal method for determining the thermodynamic phase diagram of these systems. We find that the phase diagram of P-Ba122 resembles those of other 122 superconductors, with the exception of a much steeper rise of the bulk on the underdoped side. We show that the small pressure applied by the dilatometer on the sample is sufficient to detwin the crystals in situ. By combining the results of crystals in the twinned and detwinned states, we show that the orthorhombicity of underdoped samples is reduced by the onset of superconductivity, which is a clear sign of the competition between superconducting and SDW/structural order parameters. Moreover, we establish a linear relation between P substitution and uniaxial pressure, as far as their effects on the phase diagram are concerned. Finally, an evaluation of the electronic component of the thermal expansion reveals an increasingly pressure sensitive density of states on approaching optimal doping from the underdoped side and a maximum of the Sommerfeld coefficient at optimal doping. Throughout this text, the term “doping” will be used in a broad sense, as an equivalent to substitution.
The paper is organized as follows. In section II and III we present the experimental details and results, from which we construct the thermodynamic phase diagram (section IV). In section V we discuss the interplay of the structural/magnetic order with superconductivity. The uniaxial pressure effects on and the electronic density of states are presented in Section VI, and conclusions are provided in Section VII. A brief preliminary reportB hmer et al. (2011) on parts of this work has been presented previously.
II Experimental details
Single crystals of P-substituted Ba122 were grown from stoichiometric mixtures of the starting materials as described in Ref. Kasahara et al., 2010. Crystals of pure BaFe2P2 were grown from self-flux using an Al2O3 crucible in a closed steel container. Ba and pre-reacted FeP were mixed in a ratio of 1:5, heated up to 1300∘C and slowly cooled down to 1200∘C at a rate of 0.3∘C/h. The typical crystal size is m3. 4-circle x-ray structural refinements were conducted on three of our samples and yielded a P content of . The P content of the other samples () was determined by energy-dispersive x-ray analysis (EDX) on these samples and complemented by 4-circle x-ray diffraction on samples from the same batch, hence the larger error.
Thermal expansion was measured in a home-built capacitive dilatometer with a typical resolution of Å (Ref. Meingast et al., 1990). In the dilatometer, the sample is pressed against one plate of a plate-type capacitor (with a force of N) so that a change of the sample length results in a changing capacitor gap. Samples were mechanically detwinned in situ by mounting them such that the dilatometer pressure is directed along their tetragonal [110] directionFisher et al. (2011). In this configuration, thermal expansion along the (shorter) orthorhombic -axis is measured. Comparison with twinned samples, for which the dilatometer pressure is applied along the tetragonal [100] direction, allows to estimate the thermal expansion along the orthorhombic -axis as well. Accurate data could be obtained in spite of the (for dilatometry) extremely small sample size.
The specific heat on the tiny samples with masses in the order of 100 micrograms was measured with a home-made micro-relaxation calorimeter using a ‘long relaxation’ technique van Heumen et al. (2007). Each relaxation at different base temperature provides about 1000 data points over a temperature interval of up to 50 % above the base temperature. Magnetization was measured with a commercial Quantum Design Vibrating-Sample Superconducting Quantum Interference Device (VSM-SQUID).
III Results
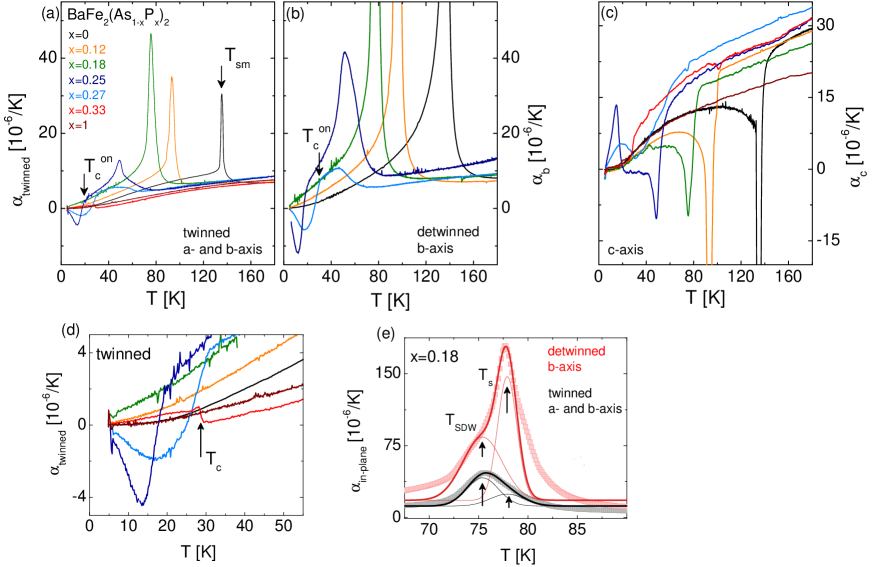
Fig. 1 shows the measured uniaxial thermal-expansion coefficients where is the sample length and the subscript stands for the direction. Clear anomalies are observed at the magneto-structural transition (at ) and at the onset of superconductivity at as indicated in the Figure. Panel (b) shows the detwinned measurements of underdoped samples, which become orthorhombic upon cooling. It is clear that the process of detwinning strongly enhances all anomalies when compared to the twinned measurements (panel (a)). The magneto-structural transition manifests itself as a broadened peak. Panel (e) shows how this peak can actually be decomposed into two separate peaks, revealing a small splitting of the structural transition at and the magnetic transition at . We find K for and K for by careful comparison of the different in-plane measurements. For no clear splitting of the transition can be observed. Samples with show bulk superconductivity. The onset of superconductivity on the underdoped side is signaled by a rather sharp kink (at ) followed by a broad peak, which has the opposite sign of the anomaly at the structural transition. We will use an area-conserving construction (see panel (e) of Fig. 2) to define a . On the overdoped side (), the anomaly at has the usual, step-like, shape expected at a second-order phase transiton, and and nearly coincide. Note that the sign of the thermal-expansion anomaly allows us to assign a sample uniquely to lying either on the underdoped or on the overdoped side. The anomalies of the thermal-expansion coefficient along the -axis (panel (c)) have similar shape but opposite sign as compared to the in-plane measurements in all cases. It is important to note that the anomalies of the ’s have the same sign and exhibit a very similar shape as reported for the Ba(Fe1-xCox)2As2 (Co-Ba122) systemBud’ko et al. (2009); Hardy et al. (2009); Meingast et al. (2011). Since (uniaxial pressure derivatives of the entropy), this shows that the entropy of the two systems responds similarly to uniaxial pressure.
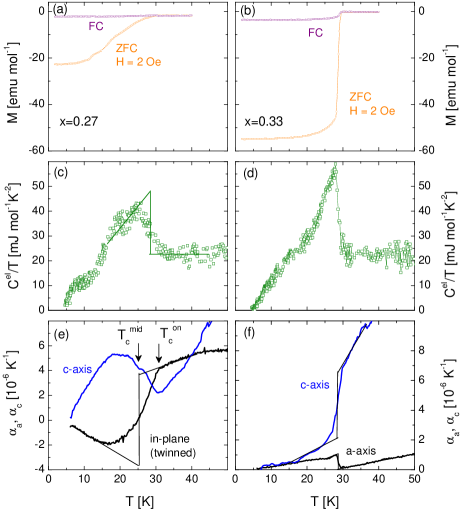
The strikingly different shape of the superconducting transition of underdoped and overdoped samples is also seen in other measurements. Fig. 2 shows the superconducting transition of the underdoped () and overdoped () P-Ba122 samples in the dc-magnetization, the electronic specific heat (derived by subtracting the lattice heat capacity of an undoped Ba122 sample), and the thermal expansion. For underdoped BaFe2(As0.73P0.27)2 there is a sharp onset at in all three data sets, however the main anomaly appears very broad and rounded. The approximate transition width is K. On the other hand, overdoped BaFe2(As0.67P0.33)2 exhibits sharp, step-like anomalies of , and at . A possible origin of the broadening in the underdoped samples will be presented in Section IV.
IV Phase diagram
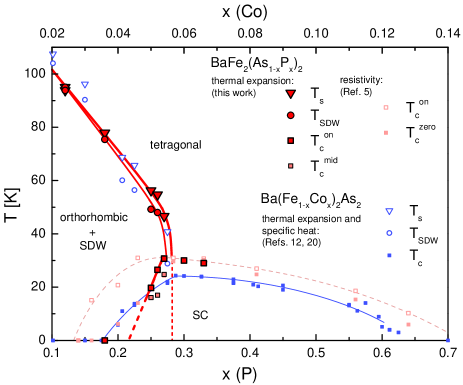
Fig. 3 shows the phase diagram compiled from the present thermodynamic data together with previous work on resistivityKasahara et al. (2010) of the same system and thermodynamic data for Co-Ba122 (Refs. Hardy et al., 2010; Meingast et al., 2011), which have been scaled so that the optimal doping concentrations of both systems coincide. In underdoped P-Ba122, the bulk obtained from thermal expansion is lower than inferred from resistivity. Furthermore, the thermodynamic measurements reveal a very steep slope of . This may offer a simple explanation for the broad superconducting transitions of the underdoped samples of P-Ba122 (Fig. 2). For a given concentration gradient in the sample, the width of the transition will be directly related to this slope. For the width of amounts to K while it is only K on the overdoped side. This difference can thus be explained by the roughly times greater slope of on the underdoped side. However, the sharp kinks at remain unexplained. We note that quite broad superconducting transitions on the underdoped side have also been reported previously from resistivityKasahara et al. (2010) and susceptibilityIye et al. (2012) measurements.
We have already noted that the response of the entropy to uniaxial pressure is very similar for P-Ba122 and Co-Ba122. Overall their phase diagrams are also very similar, however, they also show some important differences. First, on the underdoped side, the bulk rises more steeply in P-Ba122 than in the Co-doped system. This may be a signature of a stronger competition between the SDW and the superconducting phase. A steep rise of the transition line signals that two phases differ little in entropy so that only a significant increase of temperature triggers the transition. This means that here, superconductivity is not much “weaker” than magnetism, and a strong effect of the two types of order on each other is expected.
A second difference of the phase diagrams of P-Ba122 and Co-Ba122 is that the splitting of the magneto-structural transition is about two times smaller in the P substituted system. Interestingly, the two transitions remain coincident for isovalent Ru substitutionThaler et al. (2010). This suggests that, surprisingly, isovalently substituted P-Ba122 is closer to Co-Ba122 than to Ru-Ba122. This may be connected to the proposition that also Co substitution does not induce charge dopingWadati et al. (2010); Merz and et al. (2012). The reduced magnitude of the splitting may be explained by less scattering in the P-substituted samplesvan der Beek et al. (2010). A reduction of the splitting with decreasing disorder has been reported previously in the 1111 systemsJesche et al. (2010). Finally, on the overdoped side, is uniformly higher for P substitution than for Co substitution, possibly also due to less disorder.
V Interplay of orthorhombicity, SDW and superconductivity
Recent studies on Co-Ba122 showed that both magnetic and structural order parameters are reduced in the superconducting statePratt et al. (2009); Christianson et al. (2009); Nandi et al. (2010). This has been interpreted as evidence for microscopic coexistence and competition between the orthorhombic SDW phase and superconductivity in the underdoped region of the phase diagramPratt et al. (2009); Fernandes and Schmalian (2010). In some of the 1111 compounds, on the other hand, no such coexistence region has been observedLuetkens et al. (2009), and it is still debated whether magnetism and superconductivity coexist microscopically in K-doped Ba122Park et al. (2009); Inosov et al. (2009); Wiesenmayer et al. (2011). It is thus of interest to see whether such a coexistence also occurs in P-Ba122. A very recent NMR studyIye et al. (2012) shows evidence for a reduced magnetic order parameter in the superconducting state also for P-Ba122 and therefore claims microscopic coexistence of magnetism and superconductivity. In the following we will use our thermal-expansion data to study this interplay between structural/magnetic order and superconductivity via the response of the samples’ lengths and the orthorhombic order parameter to superconductivity.
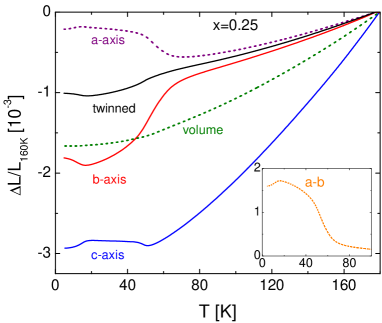
As an example, Fig. 4 shows the relative length changes of the sample. We note that the -axis length was not directly measured. However, it can be derived from the difference between in-plane twinned and detwinned data. The difference of the relative length changes of - and -axes, i.e., the orthorhombic order parameter inferred from our measurements, is shown in the inset of Fig. 4. We see that - and -axis lengths start to differ clearly at the structural transition, and this difference is directly proportional to the structural order parameter in this system. There exists a high-temperature tail to the transition, which arises from the small applied in-plane pressure of the order of MPaBlomberg et al. (2011); Dhital et al. (2012). Clearly, - and -axes approach each other again below and the orthorhombic order parameter decreases, suggesting a similar coupling of structural and superconducting order parameters as observed in Co-Ba122 (Ref. Nandi et al., 2010). Interestingly, the -axis length increases below and then decreases below , and thus exhibits a very similar behavior as the in-plane axes. Although it is not clear how, or if at all, the -axis response can be linked to the structural/magnetic order parameters, our results directly show that the SDW state favors a longer -axis. Equivalently, compressing the -axis by uniaxial pressure will destabilize magnetism. This is in agreement with DFT calculations under uniaxial pressureTomić et al. (2011). The decrease of the -axis length upon entering the superconducting state is thus consistent with a suppression of magnetism by superconductivity. Finally, we note that the effect of these transitions on the volume is very small (see Fig. 4) due to an almost complete cancellation of the anomalies along the different directions.
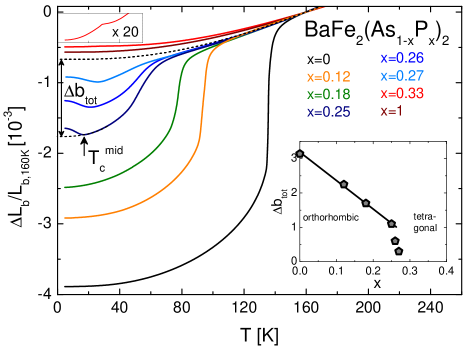
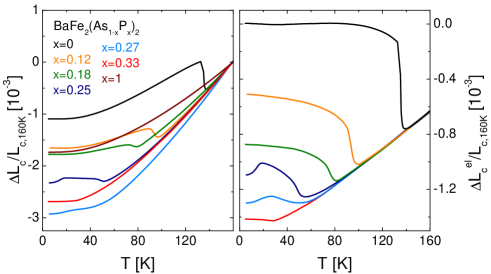
In Figures 5 and 6 we show the length changes as a function of temperature for different doping levels for the - and -axes, respectively. These axes can be measured accurately. We do not show the twinned and inferred -axis data or , since these are not as reliable due to possible partial detwinning during the twinned in-plane measurements. We note that the temperature dependence of the orthorhombic order parameter is however reflected in the (negative) -axis length since - and - axis are found to evolve nearly symmetrically. In Fig. 5 we define a parameter , which quantifies the total change of the -axis length due to the magneto-structural transition. As shown in the inset of this figure, decreases linearly with P content confirming reliable detwinning. An exception are the samples with and . Even though the transition temperatures are similar, is much smaller for these samples and does not follow any more. Possibly, only a part of the sample undergoes the magneto-structural transition. Similarly, NMR found evidence that a fraction of a collection of samples with does not undergo the SDW transitionIye et al. (2012). Hence we exclude the samples with and in the analysis of the electronic part of the thermal expansion (Section VI). As already seen for the sample, the -axis length increases and the orthorhombicity is significantly reduced when samples become superconducting. On the other hand, the in-plane length of the overdoped sample decreases below . However, the effect is tiny in comparison to the underdoped samples (see inset in the upper left corner of Fig. 5).
Interestingly, the -axis length displays a similar behavior as the in-plane axes. Fig. 6 (a) shows length changes of the -axis in analogy to Fig. 5. The iron-based materials are more compressible along the -axis than in-plane, which is reflected in a larger lattice contribution to the thermal expansion along the -axisHardy et al. (2009); Meingast et al. (2011). To obtain the “electronic -axis length changes” a suitable lattice background has to be subtracted. For this lattice background we used the data, because pure BaFe2P2 does not undergo any phase transitions and, additionally, the electronic contribution to its thermal expansion is negligibly small compared to the effects discussed here. We assume that this background is independent of P doping and, furthermore, that the high-temperature value of the total is doping independent. Variations of this high-temperature value are attributed to uncertainties arising from the tiny sample lengths along (m). These deviations can be modeled with a correction factor between and to the lattice contribution for the different samples. This correction does not affect the shape of the anomalies. The thus obtained are shown in panel (b) of Figure 6 as a function of temperature. Intriguingly, these resemble closely the dependence of the orthorhombic order parameter for all doping levels. This opens the interesting possibility to study the orthorhombic SDW state via its -axis length. As already detailed in the analysis of the sample, it is clearly seen that the magnetic state favors a longer -axis. Its destabilization by superconductivity is reflected in a reduced -axis length. Interestingly, along the -axis, there is a marked response also for the overdoped sample. The superconducting state in the absence of static magnetic order apparently favors a longer -axis in a similar manner as does the SDW state of underdoped P-Ba122. The same effect, though much smaller in magnitude, is also seen for the in-plane dimension: The -axis length of overdoped P-Ba122 is (slightly) reduced in response to superconductivity, as is the average in-plane length of the underdoped material upon entering the SDW state. The similar response of the lattice parameters may hint at a kinship of SDW and superconductivity as is suggested by nearly identical Gr neisen-parameters of the two phases in Co-Ba122Meingast et al. (2011).
Finally, we address the question of microscopic coexistence of magnetism and superconductivity. Dilatometry is a macroscopic probe and the dependence of a sample length cannot a priori be equated with the dependence of the lattice parameters if one has a phase-separated sample. Still, the close resemblance between our results and the evolution of lattice parameters of Co-Ba122 observed by x-ray diffractionNandi et al. (2010) supports that such an identification may indeed be done, suggesting that our data really show the effect of superconductivity on the lattice constants. This effect is most naturally explained by homogeneous coexistence and competition of magnetism and superconductivity also in P-Ba122. In confirmation, NMR measurementsIye et al. (2012) show an influence of superconductivity on the local magnetic order parameter and hence also conclude that SDW and superconductivity coexist microscopically but compete with each other.
Summarizing this section, the temperature and doping dependence of the lattice parameters of underdoped P-Ba122 reflect how superconductivity competes with the orthorhombic magnetic state and finally suppresses it. In contrast, superconductivity on the overdoped side is stabilized by lattice changes similar to those that occur upon entering the SDW phase, which hints at a close similarity of the two ordering phenomena.
VI Uniaxial pressure effects
For second-order phase transitions, uniaxial pressure derivatives of the transition temperature, , can be deduced from the jumps of the thermal-expansion coefficient and the specific heat . For the overdoped, tetragonal, sample (, K), clear second-order jumps in the uniaxial thermal-expansion coefficients K-1, K-1 and the specific heat mJ mol-1 K-2 are observed (see Fig. 2). The magnitude of the specific-heat jump is in good agreement with data of a recent report by Chaparro et al. Chaparro et al. (2011). can be calculated via the Ehrenfest relation
| (1) |
where cm3/mol (Ref. Kasahara et al., 2010) is the molar volume. The data yield K/GPa and K/GPa. The hydrostatic pressure derivative K/GPa is in reasonable agreement with high-pressure experiments Goh et al. (2010) which report an initial slope of K/GPa for a sample with =30.5 K. The same kind of anisotropy and a similar magnitude of the uniaxial pressure derivatives have been observed for a slightly overdoped Co-Ba122 crystal Hardy et al. (2009). The pressure derivatives on the underdoped side are more difficult to extract due to the large widths of the transitions. However, it is clear that the ’s are of opposite sign and by far larger in magnitude than those of the overdoped sample. Using the construction for the jumps shown in Fig. 2(e), we find for the sample K/GPa, K/GPa and K/GPa. Here, refers to an average of pressure along the - and -axis, as is relevant to the twinned in-plane measurements.
Since is always positive, the sign of the anomalies in the provide information on the anisotropy of the even in the absence of specific-heat data. Strikingly, the uniaxial pressure derivatives of and have the opposite sign to the derivatives of for all directionsB hmer et al. (2011). This is again consistent with a competition between the orthorhombic SDW phase and superconductivity, since pressure will favor either the SDW or superconducting phase at the expense of the other. Interestingly, all signs of the derivatives can be accounted for by identifying uniaxial pressure with a shift in the P content: stress along the -axis (and -axis on the underdoped side) corresponds to an increased P content while stress along the -axis (averaged in-plane axis) corresponds to a lower P content. This means that the phase diagram may be tracked (forwards or backwards) by the application of uniaxial pressure just as it can be tracked by hydrostatic pressureKlintberg et al. (2010). By comparing the values of obtained above with the respective slopes in the phase diagram K/at%(P) (underdoped) and K/at%(P) (overdoped) one can estimate that increasing the P content by 1 at% corresponds to a uniaxial pressure of GPa ( GPa) in the in-plane average (along the -axis). The lower accuracy of the -axis data unfortunately does not allow such a quantitative analysis.
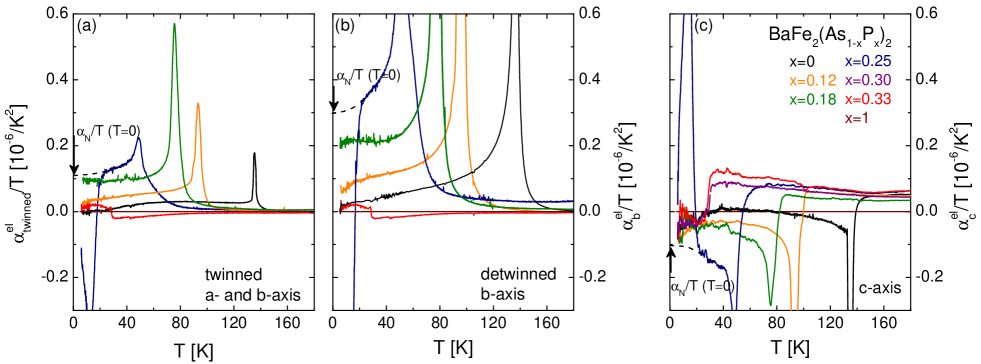
Thermal expansion data can also be used to obtain information about the (uniaxial) pressure dependence of the electronic density of states. For a Fermi liquid, the electronic thermal expansion divided by , , is expected to be a constant, , with the Sommerfeld coefficient. (This follows directly from and the electronic specific heat .) Fig. 7 shows the electronic/magnetic thermal-expansion coefficients , which were obtained from the original data by subtracting the data for as a phonon background using no correction factor (see section V). With increasing doping, a sizeable contribution from electronic/magnetic degrees of freedom evolves below the SDW transition for all three crystal directions. Especially for the data, this contribution is nearly independent of temperature up to about K, consistent with Fermi-liquid-type behavior. This is reminiscent of what is observed in weak itinerant ferromagnetic systems, such as MnSi (Ref. Matsunaga et al., 1982), and points to an intricate mixing of highly pressure-dependent electronic and magnetic degrees of freedom. For , and are too close to each other so that this constant term in is not seen.
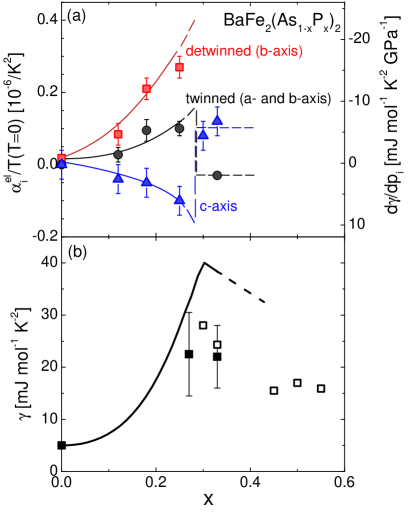
Panel (a) of Fig. 8 shows , obtained by extrapolating the normal state data to zero, and corresponding values versus P substitution. There is a sharp increase in the magnitude of upon approaching optimal doping and a sign change when passing to the overdoped side. The discontinuity of the derivatives at optimal doping is also suggested from an analogy with the Co-doped systemHardy et al. (2010); Meingast et al. (2011). We can obtain as a function of from integration of these data if, as before, we equate doping with pressure. We recall that we can link average in-plane (-axis) pressure to a decreased (increased) P content. As is evident from the sign change then, has a maximum at optimal doping. More quantitatively, the proportionality factor from above (GPa/at%(P) and GPa/at%(P)) yields values for as a function of doping; for example mJ mol-1K-2/at%(P) at . Integration of the smooth lines in Fig. 8(a) rescaled by this factor results in shown in Fig. 8(b). increases with doping in the underdoped region, has a sharp maximum at optimal doping and then decreases with further doping. Also shown are measured valuesgam of , which agree reasonably well considering the assumptions and uncertainties of our approach and the uncertainties in the values of . The overall behavior of is very similar to what has been observed in Co-doped Ba122, where the initial increase in was argued to result from the gradual suppression of the SDW order with Co dopingHardy et al. (2010); Meingast et al. (2011). Clearly, similar physics is at work in the P-doped system. On the other hand, a sharp increase of would also be expected from the presence of a quantum critical point close to optimal doping.
VII Conclusions
We have constructed the thermodynamic phase diagram of P-Ba122 in a significant range of P substitution . Compared to the Co-substituted system, the superconducting rises more steeply and there is only a small overlap region where superconductivity occurs within the orthorhombic SDW phase. P-Ba122 seems to be rather close to a first-order transition between magnetism and superconductivity, as is realized in some of the 1111 systems. The question arises why P-Ba122 and Co-Ba122 differ in this aspect of interplay between SDW and superconductivity. The competition of the two types of order is also reflected in the lattice constants. The destabilization of the SDW by superconductivity is reflected both in the in-plane lengths, as a reduction of orthorhombicity, and in the -axis length. However, superconductivity on its own favors a change of lattice parameters similar to the SDW state, suggesting an intimate relationship of the two ordering phenomena. Uniaxial pressure derivatives of the transition temperatures are large and anisotropic. Considering the effects on the phase diagram, we put forward a linear relation between uniaxial pressure and P content. The Sommerfeld coefficient is increasingly pressure (and therefore doping) dependent on approaching optimal doping. By evaluating its derivatives, we deduce that the density of states has a maximum at optimal doping.
Acknowledgements.
We cordially thank J. Schmalian, T. Iye and I. Eremin for discussions. This work was supported by the Deutsche Forschungsgemeinschaft through SPP 1458, by the Research Grants Council of Hong Kong, Grants 603010 and SEG_HKUST03 and by Grant-in-Aid for GCOE program “The Next Generation of Physics, Spun from Universality and Emergence” from MEXT, Japan.References
- Rotter et al. (2008) M. Rotter, M. Tegel, and D. Johrendt, Phys. Rev. Lett. 101, 107006 (2008).
- Sefat et al. (2008) A. S. Sefat, R. Jin, M. A. McGuire, B. C. Sales, D. J. Singh, and D. Mandrus, Phys. Rev. Lett. 101, 117004 (2008).
- Sharma et al. (2010) S. Sharma, A. Bharathia, S. Chandra, V. R. Reddy, S. Paulraj, A. T. Satya, V. S. Sastry, A. Gupta, and C. S. Sundar, Phys. Rev. B 81, 174512 (2010).
- Jiang et al. (2008) S. Jiang, H. Xing, G. Xuan, C. Wang, Z. Ren, C. Feng, J. Dai, Z. Xu, and G. Cao, J. Phys.: Condens. Matter 21, 382203 (2008).
- Kasahara et al. (2010) S. Kasahara, T. Shibauchi, K. Hashimoto, K. Ikada, S. Tonegawa, R. Okazaki, H. Shishido, H. Ikeda, H. Takeya, K. Hirata, T. Terashima, and Y. Matsuda, Phys. Rev. B 81, 184519 (2010).
- Alireza et al. (2009) P. L. Alireza, Y. T. C. Ko, J. Gillett, C. M. Petrone, J. M. Cole, G. G. Lonzarich, and S. E. Sebastian, J. Phys.: Condens. Matter 21, 012208 (2009).
- Shishido et al. (2010) H. Shishido, A. F. Bangura, A. I. Coldea, S. Tonegawa, K. Hashimoto, S. Kasahara, P. M. C. Rourke, H. Ikeda, T. Terashima, R. Settai, Y. Ōnuki, D. Vignolles, C. Proust, B. Vignolle, A. McCollam, Y. Matsuda, T. Shibauchi, and A. Carrington, Phys. Rev. Lett. 104, 057008 (2010).
- Analytis et al. (2010) J. G. Analytis, J.-H. Chu, R. D. McDonald, S. C. Riggs, and I. R. Fisher, PRL 105, 207004 (2010).
- van der Beek et al. (2010) C. J. van der Beek, M. Konczykowski, S. Kasahara, T. Terashima, R. Okazaki, T. Shibauchi, and Y. Matsuda, Phys. Rev. Lett. 105, 267002 (2010).
- Klintberg et al. (2010) L. E. Klintberg, S. K. Goh, S. Kasahara, Y. Nakai, K. Ishida, M. Sutherland, T. Shibauchi, Y. Matsuda, and T. Terashima, J. Phys. Soc. Jpn. 79, 123706 (2010).
- Drotziger et al. (2010) S. Drotziger, P. Schweiss, K. Grube, T. Wolf, P. Adelmann, C. Meingast, and H. v. Löhneysen, J. Phys. Soc. Jpn. 79, 124705 (2010).
- Meingast et al. (2011) C. Meingast, F. Hardy, R. Heid, P. Adelmann, A. B hmer, P. Burger, D. Ernst, R. Fromknecht, P. Schweiss, and T. Wolf, (2011), arXiv:1112.5326 [cond-mat] .
- Nakai et al. (2010) Y. Nakai, T. Iye, S. Kitagawa, K. Ishida, H. Ikeda, S. Kasahara, H. Shishido, T. Shibauchi, Y. Matsuda, and T. Terashima, Phys. Rev. Lett. 105, 107003 (2010).
- Hardy et al. (2009) F. Hardy, P. Adelmann, T. Wolf, H. v. Löhneysen, and C. Meingast, Phys. Rev. Lett. 102, 187004 (2009).
- Bud’ko et al. (2009) S. L. Bud’ko, N. Ni, S. Nandi, G. M. Schmiedeshoff, and P. C. Canfield, Phys. Rev. B 79, 054525 (2009).
- B hmer et al. (2011) A. E. B hmer, P. Burger, F. Hardy, T. Wolf, P. Schweiss, R. Fromknecht, H. v. L hneysen, C. Meingast, S. Kasahara, T. Terashima, T. Shibauchi, and Y. Matsuda, submitted to J. Phys. Conf. Series (SCES 2011).
- Meingast et al. (1990) C. Meingast, B. Blank, H. B rkle, B. Obst, T. Wolf, H. W hl, V. Selvamanickam, and K. Salama, Phys. Rev. B 41, 11299 (1990).
- Fisher et al. (2011) I. R. Fisher, L. Degiorgi, and Z. X. Shen, Rep. Prog. Phys 74, 124506 (2011).
- van Heumen et al. (2007) E. van Heumen, R. Lortz, A. B. Kuzmenko, F. Carbone, D. van der Marel, X. Zhao, G. Yu, Y. Cho, N. Barisic, M. Greven, C. C. Homes, and S. V. Dordevic, Phys. Rev. B 75, 054522 (2007).
- Hardy et al. (2010) F. Hardy, P. Burger, T. Wolf, R. Fisher, P. Schweiss, P. Adelmann, R. Heid, R. Fromknecht, R. Eder, D. Ernst, H. v. Löhneysen, and C. Meingast, Europhys. Lett. 91, 47008 (2010).
- Iye et al. (2012) T. Iye, Y. Nakai, S. Kitagawa, K. Ishida, S. Kasahara, T. Shibauchi, Y. Matsuda, and T. Terashima, J. Phys. Soc. Jpn. 81, 033701 (2012).
- Thaler et al. (2010) A. Thaler, N. Ni, A. Kracher, J. Q. Yan, S. L. Bud’ko, and P. C. Canfield, Phys. Rev. B 82, 014534 (2010).
- Wadati et al. (2010) H. Wadati, I. Elfimov, and G. A. Sawatzky, Phys. Rev. Lett. 105, 157004 (2010).
- Merz and et al. (2012) M. Merz and et al., to be published (2012).
- Jesche et al. (2010) A. Jesche, C. Krellner, M. de Souza, M. Lang, and C. Geibel, Phys. Rev. B 81, 134525 (2010).
- Pratt et al. (2009) D. K. Pratt, W. Tian, A. Kreyssig, J. L. Zarestky, A. Kreyssig, S. Nandi, N. Ni, S. L. Bud’ko, P. C. Canfield, A. I. Goldman, and R. J. McQueeney, Phys. Rev. Lett. 103, 087001 (2009).
- Christianson et al. (2009) A. D. Christianson, M. D. Lumbsden, S. E. Nagler, G. J. MAcDougall, M. A. McGuire, A. S. Sefat, R. Jin, B. C. Sales, and D. Mandrus, Phys. Rev. Lett. 103, 087002 (2009).
- Nandi et al. (2010) S. Nandi, M. G. Kim, A. Kreyssig, R. M. Fernandes, D. K. Pratt, A. Thaler, N. Ni, S. L. Bud’ko, P. C. Canfield, J. Schmalian, R. J. McQueeney, and A. I. Goldman, Phys. Rev. Lett. 104, 057006 (2010).
- Fernandes and Schmalian (2010) R. M. Fernandes and J. Schmalian, Phys. Rev. B 82, 014521 (2010).
- Luetkens et al. (2009) H. Luetkens, H.-H. Klauss, M. Kraken, F. J. Litterst, T. Dellmann, R. Klingeler, C. Hess, R. Khasanov, A. Amato, C. Baines, M. Kosmala, O. J. Schumann, M. Braden, J. Hamann-Borrero, N. Leps, A. Kondrat, G. Behr, J. Werner, and B. Büchner, Nat. Mater. 8, 305 (2009).
- Park et al. (2009) J. T. Park, D. S. Inosov, C. Niedermayer, G. L. Sun, D. Haug, N. B. Christensen, R. Dinnebier, A. V. Boris, A. J. Drew, L. Schulz, T. Shapoval, U. Wolff, V. Neu, X. Yang, C. T. Lin, B. Keimer, and V. Hinkov, Phys. Rev. Lett. 102, 117006 (2009).
- Inosov et al. (2009) D. S. Inosov, A. Leineweber, X. Yang, J. T. Park, N. B. Christensen, R. Dinnebier, G. L. Sun, C. Niedermayer, D. Haug, P. W. Stephens, J. Stahn, O. Khvostikova, C. T. Lin, O. K. Andersen, B. Keimer, and V. Hinkov, Phys. Rev. B 79, 224503 (2009).
- Wiesenmayer et al. (2011) E. Wiesenmayer, H. Luetkens, G. Pascua, R. Khasanov, A. Mamato, H. Potts, B. Banusch, H.-H. Klauss, and D. Johrendt, Phys. Rev. Lett. 107, 237001 (2011).
- Blomberg et al. (2011) E. C. Blomberg, A. Kreyssig, M. A. Tanatar, R. Fernandes, M. G. Kim, A. Thaler, J. Schmalian, S. L. Bud’ko, P. C. Canfield, A. I. Goldman, and R. Prozorov, (2011), arXiv:1111.0997 [cond-mat] .
- Dhital et al. (2012) C. Dhital, Z. Yamani, W. Tian, J. Zeretsky, A. S. Sefat, Z. Wang, R. J. Birgeneau, and S. D. Wilson, Phys. Rev. Lett. 108, 087001 (2012).
- Tomić et al. (2011) M. Tomić, R. Valentí, and H. O. Jeschke, (2011), arXiv:1106.5623 [cond-mat] .
- Chaparro et al. (2011) C. Chaparro, L. Fang, H. Claus, A. Rydh, G. W. Crabtree, V. Stanev, W. K. Kwok, and U. Welp, (2011), arXiv:1110.3075 [cond-mat] .
- Goh et al. (2010) S. K. Goh, Y. Nakai, K. Ishida, L. E. Klintberg, Y. Ihara, S. Kasahara, T. Shibauchi, Y. Matsuda, and T. Terashima, Phys. Rev. B 82, 094502 (2010).
- (39) Measured values of are taken from Fig. 2 for and and from Ref. Hardy et al., 2010 for . Values for , , , and are (also) obtained from the measured specific-heat jump (Ref. Chaparro et al., 2011) using the empirical linear relationship valid for Co-Ba122 (Ref. Hardy et al., 2010).
- Matsunaga et al. (1982) M. Matsunaga, Y. Ishikawa, and T. Nakajima, J. Phys. Soc. Jpn. 51, 1153 (1982).