High CO emission in the Cepheus E protostellar outflow observed with SOFIA/GREAT
Abstract
Context. Owing to the high energy required for their excitation, high CO transitions are a valuable tool for the study of protostellar jets and outflows. However, high spectral resolution observations of high CO lines, which are essential to distinguish the different components in the line profiles, were impossible until the start of operations of the Herschel space observatory and the Stratospheric Observatory for Infrared Astronomy (SOFIA).
Aims. We present and analyze two spectrally resolved high CO lines towards a protostellar outflow. We study the physical conditions, as a function of velocity, traced by such high-energy transitions in bipolar outflows.
Methods. We selected the molecular outflow Cep E, driven by an intermediate-mass class 0 protostar. Using the GREAT receiver on board SOFIA, we observed the CO (12–11) and (13–12) transitions ( 430 and 500 K, respectively) towards one position in the blue lobe of this outflow, that had been known to display high-velocity molecular emission.
Results. We detect the outflow emission in both transitions, up to extremely high velocities ( 100 km s-1 with respect to the systemic velocity). We divide the line profiles into three velocity ranges that each have interesting spectral features: standard, intermediate, and extremely high-velocity. One distinct bullet is detected in each of the last two. A large velocity gradient analysis for these three velocity ranges provides constraints on the kinetic temperature and volume density of the emitting gas, 100 K and 104 cm-3, respectively. These results are in agreement with previous ISO observations and are comparable with results obtained by Herschel for similar objects.
Conclusions. High CO lines are a good tracer of molecular bullets in protostellar outflows. Our analysis suggests that different physical conditions are at work in the intermediate velocity range compared with the standard and extremely high-velocity gas.
Key Words.:
stars: formation – ISM: jets and outflows – ISM: individual objects: Cep E – submillimeter: ISM – infrared: ISM1 Introduction
Observations over the past few decades have shown that during the star formation process, mass accretion is commonly associated with mass ejection in the form of jets. The interaction between the jet and the parent cloud generates shock fronts, that form large cavities called bipolar outflows. The simultaneous presence of jets and bipolar outflows, as well as accretion disks surrounding protostellar condensations, are commonly observed (Arce et al. 2007), making them the basic elements of the star formation scenario. In this picture, different excitation regimes, related to the different structures, are revealed with a diversity of observational probes, such as continuum emission and molecular transitions at different wavelengths. In the jet/outflow system, at its temperature peak the shocked material is mainly radiatively cooled through the near-IR transitions of H2, whereas the low-lying CO transitions trace the lower density, lower temperature ( 50 K) post-shock gas. In-between those two extreme regimes and over the 100-2000 K range, the cooling of the gas occurs mainly through the emission of atomic and molecular lines such as [OI], H2O, high CO, OH, and H2 transitions, which fall in the mid- to far-infrared spectral range (Nisini et al. 1999).
Traditionally, the physical conditions of the gas in protostellar outflows have been studied by means of ground-based observations of low-lying rotational transitions of the CO molecule (usually up to , corresponding to E K). In most cases, these low-energy transitions are more sensitive to the low excitation swept-up gas, not exclusively related with the jet and/or shock front. On the other hand, higher-lying transitions (E100 K) probe the warm gas unambiguously related with the jet and/or hot spots in the shocked gas. However, transitions with relatively high rotational quantum numbers (e.g. 9) fall into the window of the far-infrared regime that can not be observed from the ground. High CO observations were pioneered with the Infrared Space Observatory (ISO), which actually targeted several protostellar outflows (Nisini et al. 1999, 2000; Giannini et al. 2001). These ISO observations revealed that the high CO emission does indeed trace outflowing gas above 1000 K, but their poor spectral resolution did not allow us to probe either the presence of different spectral components, or the physical conditions of the gas as a function its velocity. In addition, their low spatial resolution ( 80″ at wavelengths corresponding to its Long Wavelength Spectrometer, LWS) complicates the analysis owing to the presence of different structures within the same beam. Only recently, with Herschel in operation and SOFIA starting operation, we had the opportunity to follow-up on these previous studies with high-resolution FIR spectroscopy and angular resolutions in the 15-20″ range.
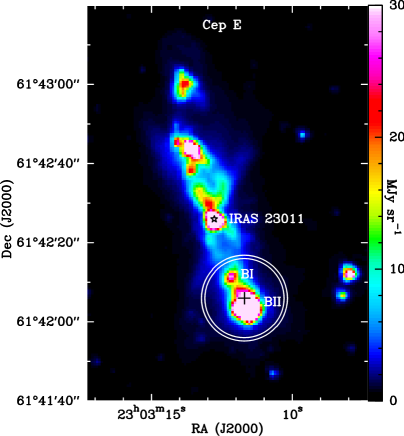
In this letter, we present one of the first studies of two high CO spectrally resolved lines in a protostellar outflow, as an example of the potential of SOFIA observations with GREAT in the context of protostellar jets/outflows. For this study, we selected the protostellar outflow Cep E, in the Cepheus molecular cloud, since it is associated with a relatively nearby (730 pc) intermediate-mass class 0 source (IRAS 23011+6126: Chini et al. 2001) of 100 L⊙, surrounded by an envelope structure of mass 18 M⊙. The jet/outflow system itself has been intensively studied at multiple wavelengths (Eislöffel et al. 1996; Lefloch et al. 1996; Moro-Martín et al. 2001; Smith et al. 2003). The strong CO wings and the evidence of jet-like components in the spectrum of Cep E outflow make it an ideal target for the study of the high CO emission in jet/outflow systems.
2 Observations
The SOFIA telescope was pointed towards the southern lobe of the Cep E outflow (Fig. 1). As seen in Fig. 1, the SOFIA observations covered the infrared knots BI and BII. The observations were performed during basic science flights in July 2011, with the German Receiver for Astronomy at Terahertz Frequencies (GREAT111GREAT is a development by the MPI für Radioastronomie and the KOSMA/Universität zu Köln, in cooperation with the MPI für Sonnensystemforschung and the DLR Institut für Planetenforschung.: Heyminck et al. 2012). The L1 band of the GREAT instrument was used to observe, in two separate flights, the CO (12–11) and (13–12) transitions at 1.4 THz and 1.5 THz, in the lower and upper sidebands, respectively. In Table 1, the line frequencies, diffraction-limited beam sizes, time ON source (), and atmospheric opacities () during the observations are presented. The front-end was connected to the AFFTS back-end (Klein et al. 2012), providing a total bandwidth of 1.5 GHz and a spectral resolution of 212 kHz, that at the observed frequencies correspond to 300 km s-1 and 0.4 km s-1, respectively. Single pointing observations were done in double-beam chopped mode, with a chop throw of 60″ in RA (at 1 Hz). The pointing was established with the optical guide cameras, and was stable to 4″. The calibration uncertainty is within 20%. From observations of Jupiter and Mars, a main-beam efficiency of 0.540.05 in the L1 band was determined (Heyminck et al. 2012), that - with a forward efficiency of 0.95 - was used to convert antenna to main beam temperatures, . Subsequent analysis of the data was done with CLASS within the GILDAS software222http://www.iram.fr/IRAMFR/GILDAS, following the standard procedures of baseline subtraction and spectra averaging. A first-order baseline was subtracted from all spectra.
Calibration was performed by carefully fitting the observed sky emission (Guan et al. 2012). Unfortunately, both CO transitions suffer from residual terrestrial atmospheric features at SOFIA’s flight altitude: the CO (12–11) detection bandwidth contains a strong water absorption (from the signal band) at positive velocities 60 km/s. This does not however affect the calibration of the pre-dominantly negative velocity emission towards the southern lobe. This is different for CO (13–12), whose calibration (and baselines) at extremely negative velocities (of lower than - 120 km s-1) are more uncertain owing to an image band atmospheric feature. However, quite comparable integrated intensities for both lines at small S/N values supports our confidence in the adopted calibration procedure.
| CO | 0 | HPBW | rmsa𝑎aa𝑎a scale, at 3 km s-1 spectral resolution. | |||
|---|---|---|---|---|---|---|
| Line | (GHz) | (K) | (″) | (mK) | (min) | |
| (13–12) | 1496.9922 | 503.1 | 20.0 | 82 | 0.03 | 15 |
| (12–11) | 1381.9951 | 431.3 | 21.7 | 96 | 0.16 | 7.4 |
| (2–1)b𝑏bb𝑏bConvolved to 20″ from original 11″ resolution (IRAM-30m), Lefloch et al. in prep. | 230.5380 | 16.6 | 20.0 | 32 | - | - |
3 Results
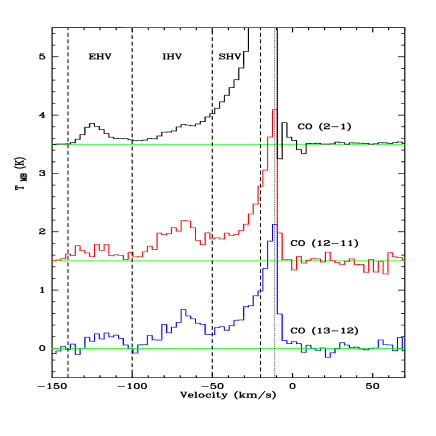
Together with the SOFIA/GREAT spectra, in Fig. 2 we also show a CO (2–1) line profile taken at the corresponding position from a Nyquist sampled map, obtained with the IRAM-30m telescope (Lefloch et al., in prep). The CO (2–1) spectrum was convolved to a beam of 20″ (i.e. the SOFIA beam at the (13–12) transition, see Table 1). From the CO spectra shown in Fig. 2 at least three spectral features can be distinguished: two secondary peaks, at around km s-1 and km s-1, and a wing-like profile (smooth decrease of intensity towards high velocities) in the range from km s-1 to km s-1. The secondary peaks are similar to the so-called molecular ‘bullets’ often observed in the spectrum from class 0 protostars and likely related to the jet component (e.g. L1448: Bachiller et al. 1990). These ‘bullets’ were reported previously in Cep E (Lefloch et al. 1996). The wing-like feature is typical of the outflow phenomenon, mostly tracing the cavity walls crated by the jet, and usually referred to as the ‘standard’ high-velocity component (e.g., Bachiller et al. 1990). On the basis of these spectral features, in Fig. 2 we divide all spectra into three velocity ranges: extremely high velocity (EHV: to km s-1), intermediate-to-high velocity (IHV: to km s-1), and standard high velocity (SHV: to km s-1). In Table 2, we present the line intensities integrated within the defined velocity ranges. From the spectra in Fig. 2, one can see that the bullet-like profile in the IHV range is more prominent in high than in low- CO, with the latter still being dominated by the wing-like profile that extends into this velocity range. On the other hand, the SHV component is stronger in low than in high CO. From the integrated intensities in Table 2, we found that the (2–1)/(12–11) ratio is about 0.8, 0.4, and 2.2, for EHV, IHV, and SHV, respectively, indicating different excitation conditions in the different velocity ranges. These findings underline the necessity for velocity-resolved spectroscopy in the excited CO transitions, to identify the bullets as distinct features. The significant emission of the high CO line at high-velocity indicates that it is very likely related to the jet component, unlike the wing component, which becomes weaker in these lines. Finally, the emission at low velocities is still considerable in our high CO lines. This implies that the a priori assumption made in the analysis of some ISO observations, namely that the excited CO emission originates exclusively from the high-velocity gas (e.g. Nisini et al. 2000), could be incorrect.
| CO | dv (K km s-1)333Statistical errors in parenthesis. | ||
|---|---|---|---|
| Transition | EHV | IHV | SHV |
| 13–12 | 4.8(0.9) | 14.9(1.0) | 16.1(0.8) |
| 12–11 | 6.0(1.0) | 19.5(1.2) | 17.7(0.9) |
| 2–1 | 5.1(0.2) | 8.8(0.3) | 38.9(0.2) |
| EHV: to km s-1; IHV: to km s-1 | |||
| SHV: to km s-1 | |||
4 Discussion: physical conditions
To constrain the physical conditions, we performed radiative transfer calculations with the RADEX code (van der Tak et al. 2007) based on the large velocity gradient (LVG) approximation and assuming a plane-parallel ‘slab’ geometry for the escape probability formula. The molecular data were retrieved from the LAMDA data base444http://www.strw.leidenuniv.nl/moldata/. The collisional rate coefficients were adopted from Yang et al. (2010), who calculated the collisional rates between CO and H2, incorporating energy levels up to for kinetic temperatures of up to 3000 K.
For the purposes of our study of the physical conditions as a function of velocity, we use the integrated intensities in the EHV, IHV, and SHV ranges (Table 2). The value that we adopt for the linewidth, , is directly inferred from the definition of our different velocity ranges (40, 50, and 30 km s-1, for EHV, IHV and SHV, respectively). Our background radiation field is assumed to only be produced by the CMB. Then, our procedure consists in running, for each velocity range, a grid of RADEX models to compute the integrated intensities within a three-dimensional parameter space defined by (kinetic temperature), (H2 volume density), and (CO) (CO column density).
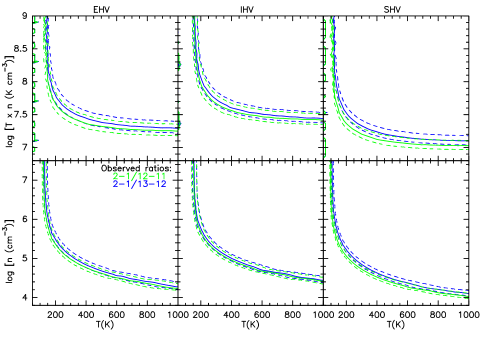
The LVG results were analyzed based on the (2–1)/(12–11), (2–1)/(13–12) line ratios and the absolute integrated intensities of those three lines. We point out that owing to the use of these ratios the results are biased toward the lower excitations traced by the low CO lines, and hence our results should be assumed to be lower limits. We use the IR size of the BI (3″4″) and BII (8″8″) knots to compute the brightness temperature, correcting for beam dilution effects. For the SHV component, we assumed the size of BII, while for the IHV and EHV components the size of BI was assumed. These assumptions are based on the knowledge that the EHV and IHV low CO emission peaks around BI, while the SHV emission peaks around BII (Hatchell et al. 1999). The LVG solutions were found when both the ratios and absolute integrated intensities match in the (, ) plane. The (CO) ranges constrained in this way are 4-91017, 4-61017, and 1-41017 cm-2, for the SHV, IHV, and EHV components, respectively. We tested the influence of the size of the emission region on our (CO) conclusions by varying the assumed size from a compact emission scenario, where the emission spreads over half the BI knot size, to a very extended case in which the filling factor is equal to one. Over this range, we found that (CO) varies over up to two orders of magnitude. However, this change in (CO) does not modify significantly the solution of the line ratios described below. In Fig. 3, we show the RADEX results as plots of versus (vs.) and () vs. . In the latter, () represents the thermal pressure, and is shown because in the LVG analysis the results are not as degenerate as for vs. (see Fig. 3). The (2–1)/(12–11) and (2–1)/(13–12) ratios yield lower limits to the parameters of 100 K, 4.2104 cm-3, and () K cm-3. These lower limits indicate that the line ratios actually trace high densities and temperatures, but the remarkable result of our LVG analysis is that the thermal pressure tends to be higher in the IHV range than in both the EHV and SHV ranges. In addition, it is quiet a surprise that both EHV and SHV provide similar constraints, since it is usually found that the EHV component (probably related to the jet) has higher excitation than the SHV component (which is likely to trace the outflow cavity).
The H2O mapping observations at 183 GHz of Lefloch et al. (2011), which covered the blue lobe and the central region of Cep-E with an angular resolution of 13″, also showed prominent bullet-like spectral features in the IHV range. The strongest emission was found around the central region, while weaker and no emission at all was found at BI and BII, respectively. Together with additional SiO (8–7) observations, LVG calculations made for the gas in the central region yielded the physical conditions of 200 K and 106 cm-3, which are comparable to the ones reported here, suggesting that the SiO, H2O, and high CO emission arises from gas with similar physical conditions, despite the different frequency range and positions probed. A correlation between the physical conditions of these molecules is an expected result given that the considered formation routes of SiO and H2O associate themselves with warm and dense gas. However additional observations are required to verify the spatial correlation between these molecules and to provide more accurate determinations of the physical conditions.
Previous ISO observations of CO transitions from (14–13) up to (25–26), yielded kinetic temperatures and H2 densities in the range 200-1200 K and 4104-4106 cm-3, respectively. These constraints were obtained by fitting LVG models to the total integrated emission of these spectrally unresolved high CO lines (Giannini et al. 2001; Moro-Martín et al. 2001). It is remarkable that our lower limits are in good agreement with the values obtained from ISO, although our results are given for three distinct velocity ranges over the same global one. However, a more complete LVG analysis is needed to strengthen our conclusions with respect to previous ISO studies, and to more clearly probe the physical conditions prevailing in the observed regions. Such an analysis should be based on additional observations of both lower- and higher- CO transitions with the GREAT spectrometer, such as the (11–10) and (16–15) ones, the latter would also allow us to make direct comparisons with ISO observations.
Spectrally resolved Herschel/HIFI observations have been used to study the emission in different velocity ranges in low-mass outflows by measuring the ratios of low to high CO lines, which is an approach that is similar to our analysis. The kinetic temperatures generally inferred by those studies for the outflow components are in the range 100-200 K (Yıldız et al. 2010; Bjerkeli et al. 2011). These values are similar to our lower limits. As already pointed out, the line ratios of a few high CO lines with low CO lines bias the results toward lower excitation conditions, and could in the end be inappropriate owing to the different physical component possibly related to each of them, as it has been proven in a few outflows (van Kempen et al. 2010). In this respect, additional observations of more high CO lines, as well low- and mid CO transitions, are required to test the possibility of the contribution of different physical components to the CO emission in outflows. Eventually, the combination of a maximum number of CO lines will provide the optimal way to shed light on the physical processes responsible for the existence of these components (e.g. Gusdorf et al. 2012; Visser et al. 2012).
5 Conclusions
The principal conclusions of the present study are:
-
1.
Our analysis of SOFIA/GREAT data has demonstrated that high CO lines are a good tracer of molecular bullets in protostellar outflows.
-
2.
The bullet at intermediate-to-high velocities has a higher level of excitation than the low and extremely high velocity gas, at the observed position of the Cep-E outflow.
-
3.
The still considerable low-velocity emission in high CO lines should be taken into account when modeling data.
-
4.
More and higher CO transitions must be observed to break the degeneracy in the LVG solutions.
Acknowledgements.
Based on observations made with the NASA/DLR Stratospheric Observatory for Infrared Astronomy. SOFIA Science Mission Operations are conducted jointly by the Universities Space Research Association, Inc., under NASA contract NAS2-97001, and the Deutsches SOFIA Institut under DLR contract 50 OK 0901. We thank B. Lefloch for providing us with the CO data from IRAM-30m. A. Gusdorf acknowledges support by the grant ANR-09-BLAN-0231-01 from the French Agence Nationale de la Recherche as part of the SCHISM project.References
- Arce et al. (2007) Arce, H. G., Shepherd, D., Gueth, F., et al. 2007, Protostars and Planets V, 245
- Bachiller et al. (1990) Bachiller, R., Martin-Pintado, J., Tafalla, M., Cernicharo, J., & Lazareff, B. 1990, A&A, 231, 174
- Bjerkeli et al. (2011) Bjerkeli, P., Liseau, R., Nisini, B., et al. 2011, A&A, 533, A80
- Chini et al. (2001) Chini, R., Ward-Thompson, D., Kirk, J. M., et al. 2001, A&A, 369, 155
- Eislöffel et al. (1996) Eislöffel, J., Smith, M. D., Davis, C. J., & Ray, T. P. 1996, AJ, 112, 2086
- Giannini et al. (2001) Giannini, T., Nisini, B., & Lorenzetti, D. 2001, ApJ, 555, 40
- Guan et al. (2012) Guan, X., Stutzki, J., Graf, U., et al. 2012, A&A, this volume
- Gusdorf et al. (2012) Gusdorf, A., Anderl, S., Güsten, R., et al. 2012, A&A, this volume
- Hatchell et al. (1999) Hatchell, J., Fuller, G. A., & Ladd, E. F. 1999, A&A, 346, 278
- Heyminck et al. (2012) Heyminck, S., Graf, U., Güsten, R., et al. 2012, A&A, this volume
- Klein et al. (2012) Klein, B., Hochgürtel, S., Krämer, I., et al. 2012, A&A, this volume
- Lefloch et al. (2011) Lefloch, B., Cernicharo, J., Pacheco, S., & Ceccarelli, C. 2011, A&A, 527, L3
- Lefloch et al. (1996) Lefloch, B., Eisloeffel, J., & Lazareff, B. 1996, A&A, 313, L17
- Moro-Martín et al. (2001) Moro-Martín, A., Noriega-Crespo, A., Molinari, S., et al. 2001, ApJ, 555, 146
- Nisini et al. (1999) Nisini, B., Benedettini, M., Giannini, T., et al. 1999, A&A, 350, 529
- Nisini et al. (2000) Nisini, B., Benedettini, M., Giannini, T., et al. 2000, A&A, 360, 297
- Smith et al. (2003) Smith, M. D., Froebrich, D., & Eislöffel, J. 2003, ApJ, 592, 245
- van der Tak et al. (2007) van der Tak, F. F. S., Black, J. H., Schöier, F. L., Jansen, D. J., & van Dishoeck, E. F. 2007, A&A, 468, 627
- van Kempen et al. (2010) van Kempen, T. A., Kristensen, L. E., Herczeg, G. J., et al. 2010, A&A, 518, L121+
- Visser et al. (2012) Visser, R., Kristensen, L. E., Bruderer, S., et al. 2012, A&A, 537, A55
- Yang et al. (2010) Yang, B., Stancil, P. C., Balakrishnan, N., & Forrey, R. C. 2010, ApJ, 718, 1062
- Yıldız et al. (2010) Yıldız, U. A., van Dishoeck, E. F., Kristensen, L. E., et al. 2010, A&A, 521, L40