STRONG EVOLUTION OF X-RAY ABSORPTION IN THE TYPE IIn SUPERNOVA SN 2010jl
Abstract
We report two epochs of Chandra-ACIS X-ray imaging spectroscopy of the nearby bright Type IIn supernova SN 2010jl, taken around 2 months and then a year after the explosion. The majority of the X-ray emission in both the spectra is characterized by a high temperature ( keV) and is likely to be from the forward shocked region resulting from circumstellar interaction. The absorption column density in the first spectrum is high ( cm-2), more than 3 orders of magnitude higher than the Galactic absorption column, and we attribute it to absorption by circumstellar matter. In the second epoch observation, the column density has decreased by a factor of 3, as expected for shock propagation in the circumstellar medium. The unabsorbed keV luminosity at both epochs is . The 6.4 keV Fe line clearly present in the first spectrum is not detected in the second spectrum. The strength of the fluorescent line is roughly that expected for the column density of circumstellar gas, provided the Fe is not highly ionized. There is also evidence for an absorbed power law component in both the spectra, which we attribute to a background ultraluminous X-ray source.
1 Introduction
Supernova (SN) 2010jl was discovered on 2010 Nov 3.5 (UT) at a magnitude of 13.5 (Newton & Puckett, 2010), and brightened to magnitude 12.9 over the next day, showing that it was discovered at an early phase. Pre-discovery observations indicate an explosion date in early October 2010 (Stoll et al., 2011). Spectra on 2010 Nov 5 show that it is a Type IIn event (Benetti et al., 2010). The apparent magnitude is the brightest for a Type IIn SN since SN 1998S. SN 2010jl is associated with the galaxy UGC 5189A at a distance of 50 Mpc (), implying that SN 2010jl belongs to the class of luminous SNe IIn with an absolute magnitude . Hubble Space Telescope (HST) images of the site of the SN taken a decade before the SN indicate that, unless there is a chance coincidence of a bright star with the SN site, the progenitor star had an initial mass (Smith et al., 2011). Optical spectra give evidence for a dense circumstellar medium (CSM) expanding around the progenitor star with speeds of (Smith et al., 2011). Stoll et al. (2011) found that the host galaxy is of low metallicity, supporting the emerging trend that luminous SNe occur in low metallicity environments. They determine the metallicity of the SN region to be .
Spitzer observations showed a significant infrared (IR) excess in SN 2010jl, indicating either new dust formation or the heating of circumstellar dust in an IR echo (Andrews et al., 2011). Andrews et al. (2011) attributed the IR excess to pre-existing dust and inferred a massive CSM around SN 2010jl, possibly suggesting a luminous blue variable (LBV) like progenitor. Smith et al. (2012) found signatures of new dust formation in the post-shock shell of SN 2010jl from their multi-epoch spectra. While a significant IR excess is present, the SN does not show large reddening, indicating that the dust does not have a spherically symmetric distribution about the SN (Andrews et al., 2011). The Swift on-board X-ray Telescope (XRT) detected X-rays from SN 2010jl on 2010 Nov (Immler et al., 2010). Assuming a temperature of 10 keV and a Galactic absorption column of cm-2, Immler et al. (2010) obtained an unabsorbed X-ray luminosity of erg s-1 in the keV band.
2 Observations and Analysis
2.1 Observations
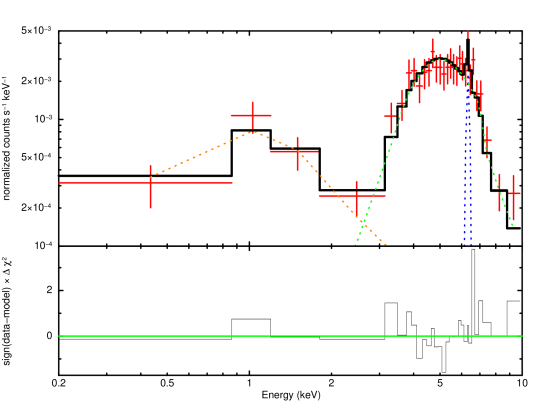
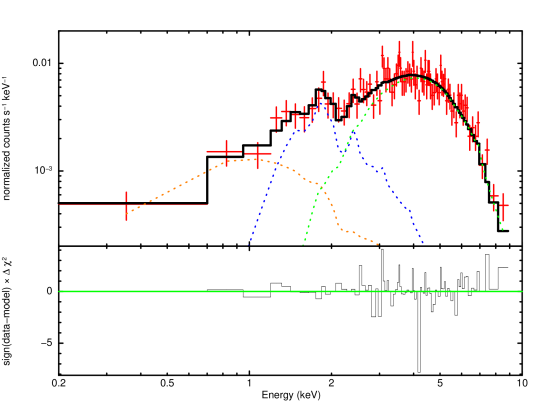
The Swift detection of SN 2010jl allowed us to trigger our approved Chandra Cycle 11 program in Dec 2010. We again observed SN 2010jl in Oct 2011 under Cycle 13 of Chandra. The first observation (Figure 1) took place under the proposal # 11500430 starting 2010 Dec 7 at 04:22:53 Hrs (UT) for an exposure of 19.05 ks and then on 2010 Dec 8 at 00:50:20 Hrs (UT) for a 21.05 ks exposure. The observations were taken with the ACIS-S without grating in a VFAINT mode. A total of 39.58 ks exposure time was used in the data analysis and 468 counts were obtained with a count rate of cts s-1. The second set of observations (Figure 2) took place under our proposal # 13500593 starting on 2011 Oct 17 at 20:25:09 Hrs (UT) for an exposure of 41.04 ks. The observations were again taken with the ACIS-S in the VFAINT mode with grating NONE. In a total of 40.51 ks usable exposure time, we obtained 1342 total counts, i.e. a count rate of cts s-1. We extracted the spectra using CIAO software111http://asc.harvard.edu/ciao/ and used HEAsoft222http://heasarc.gsfc.nasa.gov/docs/software/lheasoft/ to carry out the spectral analysis.
2.2 Spectral Analysis
As can be seen in Figures 1 and 2, the normalized count rate is higher in the Oct 2011 spectra. This does not necessarily indicate higher intrinsic emission from the SN at the later time, because the count rates are absorbed count rates and the unabsorbed emission depends on the intervening column density, which may change. In the keV range, the fluorescent 6.4 keV Fe line is present in the first spectrum but not the second (Figure 3). Here we carry out a detailed spectral analysis of both spectra and determine the significance of various emission components along with the Fe 6.4 keV line.
2.2.1 December 2010 spectrum
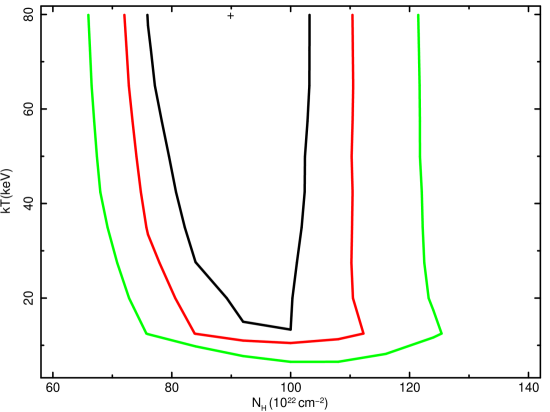
For the December 2010 spectrum, we first fit the high temperature component in the keV energy range, where most of the emission in the Chandra energy band lies. We fit the spectrum in this range with an absorbed Mekal model (Mewe et al., 1985; Liedahl et al., 1995) with metallicity (Stoll et al., 2011). The preferred Mekal temperature always hit the upper bound of the temperature allowed in the Mekal model, i.e. 79.9 keV. The column density is also very high, with cm-2. Since the temperature in the best fit models seems high, we checked for the possibility of non-thermal X-ray emission and fit a power law model. The column density in this fit is consistent with that of the Mekal model; however the photon index is too small to be physically plausible (), and we disfavor the non-thermal model.
When we plot the confidence contours of versus , the column density in our fits is well constrained, but the upper bound of the temperature is not constrained (Figure 4). We established a lower bound on the temperature by assuming a value and finding the goodness of fit; keV gives a good fit with acceptable value, but not lower values. Thus 8 keV is a lower limit on the temperature of the main X-ray emission component of the SN. For the lower temperature component in the keV range, we fix the absorption column to the Galactic value of cm-2 since the absorption column for this component is very poorly constrained. This component is best fit with a temperature of keV or a power law with .
Figure 1 shows the best fit to the Chandra spectrum taken between 2010 Dec 07.18 UT and 2010 Dec 08.03 UT, and the best fits are tabulated in Table 1. Our complete model is the AbsorptionPowerlaw Absorption(MekalGaussian). 97.9% of the total unabsorbed flux in the Chandra band is carried by the high temperature component. The Fe 6.4 keV line carries 1.7% of the total flux while the low- component has only 0.4% of the total flux. The rest energy of the Fe line is keV, which is consistent with the K line. The equivalent width of the line is keV.
2.2.2 October 2011 Spectrum
The Chandra spectrum taken between 2011 Oct UT is different from the first epoch spectrum. We first fit the high temperature component between keV. The temperature in this case also reaches the Mekal model upper limit of 79.9 keV. To consider the possibility of non-thermal emission, we fit a power law to the spectrum. However, the power law fit to this component yields a photon index of , which is implausible.
In this spectrum, the column density has decreased by a factor of three; the best fit column density for is cm-2. The Fe 6.4 keV line is not present, but the low-temperature component is there. Because of few data points and a large uncertainty in the column density in this component, we again fix the column density to the Galactic value. When we fit the low temperature component with a thermal plasma or a power law model, it fits with a temperature of keV or a power law of . However, another component is still required by the data. When we try to fit this component using the same column density as that of the main emission component, we find keV and a very high unabsorbed luminosity erg s-1, which is implausible. Thus we try to fit this component with an independently varying column density. The column density associated with this component is around 1/4 that of the high component column density. This gives a reasonable and physically plausible component and indicates that the flux is this component is % of the total emission. Thus, in this spectrum, we have three components: a high- high- component, a high- low- component and a low- component.
Although the preferred temperature again reaches the upper bound allowed by the Mekal model, the error determination shows that there is no upper bound and the lower bound to the temperature is 12 keV. Our final model thus is AbsorptionPower law AbsorptionMekal+AbsorptionMekal. Figure 2 shows the best fit to the Chandra October 2011 spectrum. Table 1 lists the models and best fit parameters. In this case, 81.1% of the unabsorbed flux is carried by the high column density component, 18.2% by the lower- component and 0.7% is carried by the power law component.
3 Results and Interpretation
Here we highlight the main differences between the December 2010 and October 2011 spectra and discuss the best fit models and their implications. The lower limits on the temperature for the two spectra are 8 keV and 12 keV, respectively, showing that a hot component is present. The column densities of the main X-ray emission component (high- component) are high at both epochs. The column densities at the first and second epochs are cm-2 and cm-2 (for a metallicity of ), respectively. These are 3000 times and 1000 times higher than the Galactic column density ( cm-2). The high value and variability of point to an origin in the circumstellar medium. The excess column density to the X-ray emission is not accompanied by high extinction to the supernova, showing that the column is probably due to mass loss near the forward shock wave where any dust has been evaporated. This is the first time that external circumstellar X-ray absorption has been clearly observed in a supernova.
Assuming 2010 Oct 10 as the date of explosion (Andrews et al., 2011; Patat et al., 2011), the epochs of the two Chandra observations are 59 and 373 days, respectively. The keV absorbed flux at the second epoch ( erg cm-2 s-1) is higher than that at the first epoch ( erg cm-2 s-1), but this is due to the lower absorption column density at the second epoch. The actual unabsorbed emission from the SN is constant within %. At the two epochs, the unabsorbed luminosity in the keV band is , placing SN 2010jl among the most luminous X-ray supernovae yet observed. Table 1 of Immler (2007) shows that the only other SNe with comparable luminosities are Type IIn events or gamma-ray burst associated SNe at early times. The luminosity of found by Swift on 2010 Nov 5 (Immler et al., 2010) is revised to a value close to our Chandra result if cm-2 is assumed. In the thermal interpretation, the shock velocity can be deduced as km s-1, where is Boltzmann’s constant and is the mean particle weight. A lower limit of 10 keV for the temperature puts a lower limit of the 2700 km s-1 on the shock speed.
In comparing the observed luminosity to a thermal emission model to find the physical parameters, we note that our measurements give the spectral luminosity, not the total luminosity. We use equation (3.11) of Fransson et al. (1996) for the luminosity, adjusting to an observed photon energy of keV rather than keV; the Gaunt factor is increased to . For the preshock column density, we use equation (4.1) of Fransson et al. (1996). These expressions allow for a variation of the preshock density , where is a constant. The value corresponds to a steady wind and is commonly used, but implies stronger evolution than we observe in SN 2010jl. If the circumstellar medium around SN 2010jl is due to some presupernova eruptive event, deviation from is plausible. Another parameter is , determined by the expansion of the supernova shock . For the plausible value , we find that give a reasonable representation of the luminosity and evolution. The implied value of the mass loss rate , normalized to cm, is , where , is the preshock wind velocity in units of , and is the shock velocity in units of at the first epoch.
The high temperature implies that we are observing the forward shock region. The physical conditions are such that the forward shock front is close to the cooling regime (Chevalier & Irwin, 2012). In this case, the luminosity of the forward shock is expected to dominate that from the reverse shock and the reverse shock emission may be absorbed by a cooled shell, which explains the lack of observational evidence for reverse shock emission.
In modeling the X-ray absorption in SN 2010jl we have assumed that the absorbing gas is not fully ionized. If the circumstellar gas is photoionized by the X-ray emission, the absorption is reduced (e.g., Fransson, 1982). Taking an X-ray luminosity of and (at cm), the ionization parameter is ; a similar value is obtained taking cm-2 and cm for the early epoch. This is in a regime where the CNO elements may be completely ionized, but Fe is not (Hatchett et al., 1976). The CNO elements absorb radiation at keV, so there is the possibility of getting enhanced emission around that energy, as is observed in SN 2010jl. We investigated this possibility by running various cases with the CLOUDY photoionization code (Ferland et al., 1998). It is possible to obtain cases in which there is a peak at keV, but they had too little absorption in the keV range. We thus favor a background source origin for the 1 keV emission, especially because the emission remains fairly constant over the 2 epochs.
The value of in Dec 2010 implies that , where is the electron scattering optical depth through the preshock wind. The H line at that time showed roughly symmetric broad wings (Smith et al., 2012) that are probably best explained by electron scattering in the slow moving wind. Chugai (2001) estimated that the broad features observed in SN 1998S require . The required optical depth may be several times that observed along the line of sight to the X-ray emission, which could be the result of asymmetry. Andrews et al. (2011) found that the column density of dust needed for observed infrared emission is larger than that on the line of sight to the supernova, although this is at larger radii.
The Dec 2010 spectrum shows a 6.4 keV feature (Figure 3), which is identified with the narrow K iron line. Since the 6.4 keV Fe line arises from neutral or low ionized iron (Fe I to Fe XI), it supports our finding that the radiation field is not able to completely ionize the circumstellar gas. A simple estimate of the expected equivalent width of the Fe line () can be obtained from equation (5) of Kallman et al. (2004): keV, where is the circumstellar column density in units of cm-1 and the line production is due to a central X-ray source in a spherical shell. The expression assumes a flux spectrum ; , which is more appropriate to the hot thermal spectrum here, increases by 1.2. The prediction for the metallicity in our case in the early spectrum is keV, and the observed value is 0.2 keV. In view of the uncertainties in the model and the observations, we consider the agreement to be adequate. At the second epoch, is smaller by a factor of 3, so the strength of the Fe line should be correspondingly smaller; this is consistent with the nondetection of the line. The problem with this picture is that it assumes the Fe is in the low ionization stages that produce the K line; this requires an ionization parameter (Kallman et al., 2004), which is below the inferred value. One possibility is that the circumstellar gas is clumped, with a density times the average; another is that the K line emission is from dense gas that is not along the line of sight.
A thermal fit to the low temperature component implies an absorbing column density of cm-2, much less than the column to the hot component and consistent with the Galactic column density within the errors. This rules out the possibility that the cooler X-rays come from slow cloud shocks in the clumpy CSM or from the reverse shocks. The component is also present in the second epoch. It could arise from a presupernova mass loss event or from an unrelated source in the direction of the supernova. The components are best fit with either a thermal component ( keV) or a power law with . The luminosities of this component in the Dec 2010 and Oct 2011 spectra are erg s-1 and erg s-1, respectively. The luminosity range and the power law index are compatible with a background ultraluminous X-ray source (ULX), which can typically be described by an absorbed power law spectrum (Swartz et al., 2004). Since the error in the flux determination is between %, a factor of 1.4 change in the luminosity at the two epochs is consistent with a constant flux. Thus we attribute this component to a background source, most likely an ULX, which is associated with the blue excess emission region seen in the pre-SN HST images (Smith et al., 2011). We examined the HEASARC archives for useful limits on such a source, but did not find any.
The December 2010 spectrum has only one temperature component associated with the high column density. However, in the October 2011 spectrum, there are two temperature components associated with a high column density, one with temperature keV and another with temperature 1.1 keV. The lower temperature component fits with 1/4 the column density of the high temperature component. The fact that the component is absent at the first epoch suggests that it is related to the supernova emission. We examined the possibility that the emission is the result of reduced absorption due to photoionization of the absorbing material, in particular, that lighter atoms are ionized but heavier atoms are not. However, we were not able to reproduce the observed emission and the source of this emission remains uncertain.
SN 2010jl is a special Type IIn supernova because we have been able to catch it in X-rays early on with as sensitive an instrument as Chandra and trace the early X-ray evolution. We observe dramatic changes over two epochs separated by 10 months. For the first time we see clear evidence of external CSM absorption in a supernova. We also find that the CSM is not fully photoionized by the SN emission, the SN is very luminous in X-rays, and the temperature of the emitting gas is keV.
References
- Andrews et al. (2011) Andrews, J. E., Clayton, G. C., Wesson, R., et al. 2011, AJ, 142, 45
- Benetti et al. (2010) Benetti, S., Bufano, F., Vinko, J., et al. 2010, Central Bureau Electronic Telegrams, 2536, 1
- Chevalier & Irwin (2012) Chevalier, R. A., & Irwin, C. M. 2012, ApJ, 747, L17
- Chugai (2001) Chugai, N. N. 2001, MNRAS, 326, 1448
- Ferland et al. (1998) Ferland, G. J., Korista, K. T., Verner, D. A., et al. 1998, PASP, 110, 761
- Fransson (1982) Fransson, C. 1982, A&A, 111, 140
- Fransson et al. (1996) Fransson, C., Lundqvist, P., & Chevalier, R. A. 1996, ApJ, 461, 993
- Hatchett et al. (1976) Hatchett, S., Buff, J., & McCray, R. 1976, ApJ, 206, 847
- Immler (2007) Immler, S. 2007, in Supernova 1987A: 20 Years After, ed. S. Immler, K. Weiler, & R. McCray (AIP: Melville, NY), 246
- Immler et al. (2010) Immler, S., Milne, P., & Pooley, D. 2010, The Astronomer’s Telegram, 3012, 1
- Kallman et al. (2004) Kallman, T. R., Palmeri, P., Bautista, M. A., Mendoza, C., & Krolik, J. H. 2004, ApJS, 155, 675
- Liedahl et al. (1995) Liedahl, D. A., Osterheld, A. L., & Goldstein, W. H. 1995, ApJ, 438, L115
- Mewe et al. (1985) Mewe, R., Gronenschild, E. H. B. M., & van den Oord, G. H. J. 1985, A&AS, 62, 197
- Newton & Puckett (2010) Newton, J., & Puckett, T. 2010, Central Bureau Electronic Telegrams, 2532, 1
- Patat et al. (2011) Patat, F., Taubenberger, S., Benetti, S., Pastorello, A., & Harutyunyan, A. 2011, A&A, 527, L6
- Smith et al. (2011) Smith, N., Li, W., Miller, A. A., et al. 2011, ApJ, 732, 63
- Smith et al. (2012) Smith, N., Silverman, J. M., Filippenko, A. V., et al. 2012, AJ, 143, 17
- Stoll et al. (2011) Stoll, R., Prieto, J. L., Stanek, K. Z., et al. 2011, ApJ, 730, 34
- Swartz et al. (2004) Swartz, D. A., Ghosh, K. K., Tennant, A. F., & Wu, K. 2004, ApJS, 154, 519
| Spectrum | Model | NH | Parameter | Abs. flux | Unabs. flux | |
|---|---|---|---|---|---|---|
| Dec 2010 | Mekal | 0.84(23) | ||||
| + Gaussian | ||||||
| + PowerLaw | (fixed) | |||||
| Mekal | 0.87(24) | (fixed) | ||||
| + Gaussian | ||||||
| + PowerLaw | (fixed) | |||||
| Oct 2011 | Mekal | 0.92(75) | ||||
| + Mekal | ||||||
| + PowerLaw | (fixed) | |||||
| Mekal | 0.99(78) | (fixed) | ||||
| + Mekal | ||||||
| + PowerLaw | (fixed) |
Note. — Here is in cm-2, is in keV, and the fluxes are in erg cm-2 s-1. The fluxes are given in the keV energy range. The absorbed and unabsorbed fluxes are for that particular component in the model. The errors in the fluxes are %.