The ionized and hot gas in M17 SW:
Abstract
Aims. With new THz maps that cover an area of 3.32.1 pc2 we probe the spatial distribution and association of the ionized, neutral and molecular gas components in the M17 SW nebula.
Methods. We used the dual band receiver GREAT on board the SOFIA airborne telescope to obtain a 5′.73′.7 map of the 12CO =13–12 transition and the [C II] 158 m fine-structure line in M17 SW and compare the spectroscopically resolved maps with corresponding ground-based data for low- and mid- CO and [C I] emission.
Results. For the first time SOFIA/GREAT allow us to compare velocity-resolved [C II] emission maps with molecular tracers. We see a large part of the [C II] emission, both spatially and in velocity, that is completely non-associated with the other tracers of photon-dominated regions (PDR). Only particular narrow channel maps of the velocity-resolved [C II] spectra show a correlation between the different gas components, which is not seen at all in the integrated intensity maps. These show different morphology in all lines but give hardly any information on the origin of the emission. The [C II] 158 m emission extends for more than 2 pc into the M17 SW molecular cloud and its line profile covers a broader velocity range than the 12CO =13–12 and [C I] emissions, which we interpret as several clumps and layers of ionized carbon gas within the telescope beam. The high- 12CO emission emerges from a dense region between the ionized and neutral carbon emissions, indicating the presence of high-density clumps that allow the fast formation of hot CO in the irradiated complex structure of M17 SW. The [C II] observations in the southern PDR cannot be explained with stratified nor clumpy PDR models.
Key Words.:
galactic: ISM — galactic: individual: M17 SW — radio lines: ISM — molecules: 12CO— atoms: [C II]1 Introduction
M17 SW is a giant molecular cloud at a distance of 1.98 kpc (Xu et al., 2011), illuminated by a highly obscured ( mag) cluster of several (among stars) O/B stars (Beetz et al., 1976; Hanson et al., 1997), and it harbors several candidate young stellar objects (Povich et al., 2009). The large amount of observational data available in the literature and its nearly edge-on geometry make M17 SW one of the best-studied prototypes of a clumpy photon-dominated region PDR interface in the Galaxy. Studies of molecular and atomic emission indicate that the structure of the gas is highly clumped and not homogeneous (Stutzki et al., 1988; Stutzki & Güsten, 1990; Meixner et al., 1992; Pérez-Beaupuits et al., 2010, and references therein), and the structure of its neutral and molecular gas seems to be dominated by magnetic rather than by thermal gas pressure, in contrast to many other PDR regions (Pellegrini et al., 2007). Temperatures of 275 K were found toward the VLA 21cm continuum arc (Brogan & Troland, 2001), and are associated with NH3 and highly excited 12CO emission (Güsten & Fiebig, 1988; Harris et al., 1987).
Recent AKARI observations (Okada et al., 2010) with spatial resolutions between 39′′ and 57′′ showed that the [C II] 158 m line emission is widespread in the M17 complex and peaks at the northern (M17 N) and southern (M17 SW) bars, in agreement with previous observations (Matsuhara et al., 1989; Stutzki et al., 1988). However, this and previous observations of the hot and ionized gas in M17 SW are limited in spatial resolution and extent (e.g. Harris et al., 1987; Stutzki et al., 1988; Genzel et al., 1988; Meixner et al., 1992; Howe et al., 2000). Therefore, in this work we present new observations (of an area 5′.73′.7) of hot molecular (12CO =13–12) and ionized atomic ([C II] 158 m) gas, with spatial resolutions of 19′′.8 and 15′′.6, respectively, which advances existing work in M17 SW.
 |
 |
 |
 |
2 Observations
The observations were performed with the German Receiver for Astronomy at Terahertz Frequencies (GREAT111GREAT is a development by the MPI für Radioastronomie and the KOSMA/ Universität zu Köln, in cooperation with the MPI für Sonnensystemforschung and the DLR Institut für Planetenforschung., Heyminck et al., 2012) on board the Stratospheric Observatory For Infrared Astronomy (SOFIA). We used the dual-color spectrometer during its first Short Science flight on 05 April 2011 to simultaneously map the fine-structure transition of [C II] at 1900.536900 GHz (157.7 m) and the 12CO =13–12 transition at 1496.922909 GHz (200.3 m) toward M17 SW. The observations were performed in on-the-fly (OTF) total power mode. The area mapped consists of six strips, each covering ( with a sampling of (half the beamwidth at 1.9 THz). Hence, each strip consists of four OTF lines containing 28 points each. We integrated 1s per dump and 5s for the off-source reference.
All our maps are centered on R.A(J2000)=18:20:27.6 and Dec(J2000)=-16:12:00.9, which corresponds to the SAO star 161357. For better system stability we used a nearby reference position at offset (345′′,). A pointed observation of this reference position against the known better reference (offset (1040′′,) Matsuhara et al., 1989) showed that the reference is clean of 12CO emission, but contains weak (20% of the peak emission) and relatively narrow (FWHM15 ) [C II] emission. All [C II] spectra presented here were corrected for this missing flux.
Pointing was established with the SOFIA optical guide cameras, and was accurate to better than . Because the acousto-optical and fast Fourier transform spectrometers (Klein et al., 2012) operated in parallel give redundant information, we base the following analysis on the data from the latter, which provided 1.5 GHz bandwidth with about 212 kHz (0.03 ) of spectral resolution. Because during this commissioning flight the instrument showed some random gain variations, we discarded 15-20% of the spectra by filtering the spectra for outliers in the total-power IF level and for outliers in the noise rms (obtained after subtracting a third-order polynomial), retaining only reliable data. The calibration of these data to antenna temperature was performed with the kalibrate task from the kosma_software package (Guan et al., 2012). We then reduced and imaged the data further with the CLASS90 packages, which is part of the GILDAS222http://www.iram.fr/IRAMFR/GILDAS software. Using the beam efficiencies () 0.51 for [C II] and 0.54 for 12CO =13–12, and the forward efficiency () of 0.95 (Heyminck et al., 2012), we converted all data to main beam brightness temperature scale, .
3 Results
The velocity-resolved spectra of the new GREAT/SOFIA observations reveal a much more complex structure than expected based on our understanding of M17 SW as a highly clumped PDR, with a significant fraction of the [C II] emission not at all associated with the molecular PDR material.
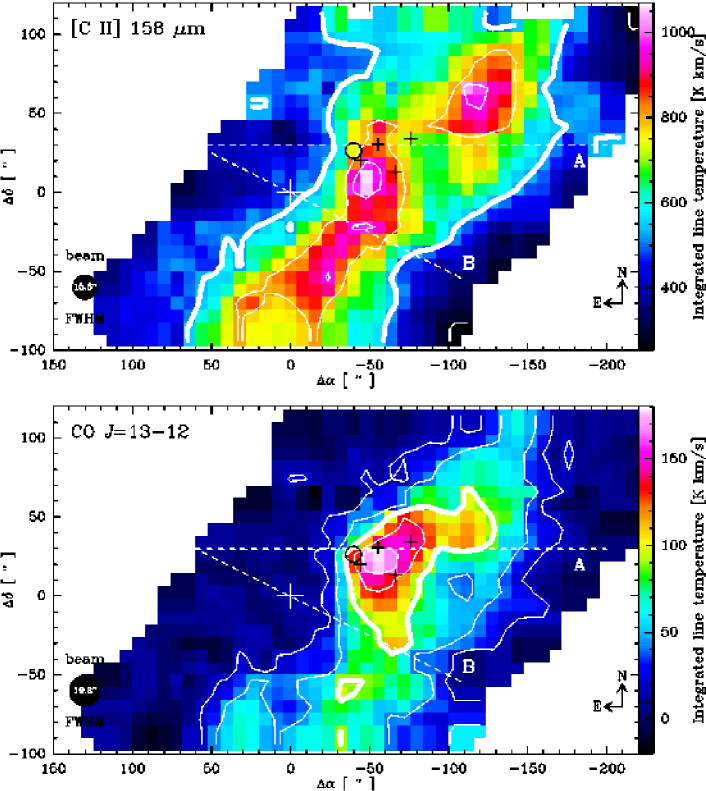
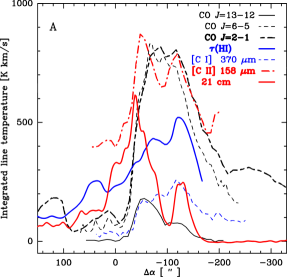
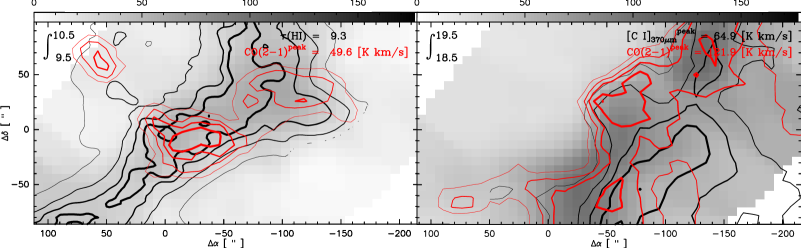
Figures 1–4 display the GREAT data compared with supplementary data of typical PDR tracers from the literature. Figure 1 shows the velocity-integrated emission of [C II] between 0 and 40 (peak 1070 ) and 12CO =13–12 [14 – 28 , peak 180 ] (left panels). While the high-excitation CO emission follows the hot dense gas structure seen in previous submm line studies (but see the discussion below), the [C II] distribution reveals surprises: its velocity-integrated distribution is quite shallow and far more extended than predicted for the stratification in classical PDR models. This is demonstrated in Fig. 1a and the intensity cuts across the PDR in Fig. 2, showing strong [C II] emission over the whole extent of the mapped area.
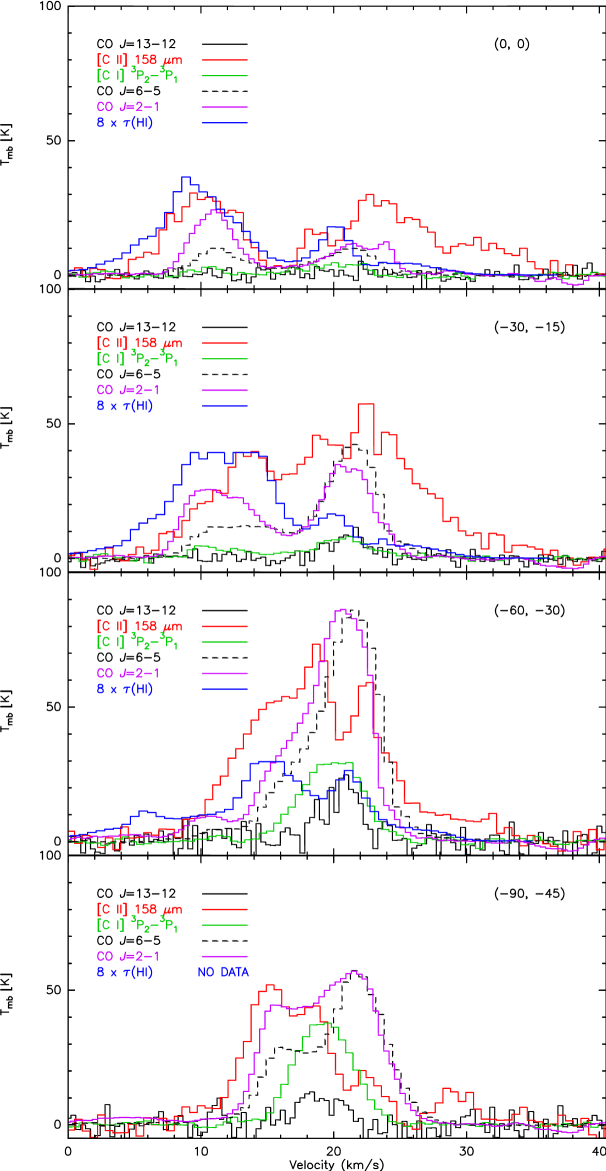
The broader distribution is consistent with the lower angular resolution data from the KAO (Stutzki et al., 1988), at the time interpreted to result from the deeper UV-penetration into a clumpy medium. However, the new GREAT/SOFIA data, resolving the spectra in velocity, show a more complex scenario. We find that (in M17 SW) the [C II] emission (=91.21 K, and ) traces - in addition to the dense PDR gas west of the ionization front - also a widespread (toward the east), probably more diffuse atomic gas component that is invisible in CO. A sample of this is shown in Fig. 3 (left panel), displaying in gray scale the intensity distribution of the lower velocity components of [C II] and its (non)correlation with CO and H I. Comparing individual spectra (Fig. 4), we see that the span of observed velocities in [C II] is much wider than that of any other PDR tracing species. In the spectra at offset (0,0), a position well in front of the PDR interface (Fig. 1b), for example, [C II] still shows a bright and amazingly wide line with V 30 , including velocities not detected in molecular (CO) or (denser) atomic (neutral carbon [C I]) gas column density tracers. Most interestingly, those velocities (e.g., 4 – 10 ) exhibit appreciable opacities in atomic hydrogen (Brogan & Troland 2001 - note that H I is observed in absorption against the 21 cm background continuum, hence its detectability across the map depends on the continuum distribution). The broad and intricate structure of the [C II] spectral line (Fig. 4) can also be the signature of several clumps or layers of ionized carbon gas at “redder” and “bluer” velocities than the other tracers.
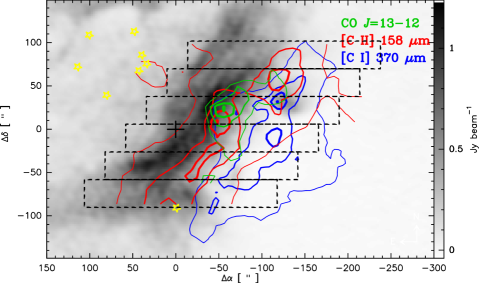
Fig. 1b provides evidence for a C C stratification across the PDR: the bulk of the [C I] emission (defined as 75% of the peak emission) avoids the bulk emission of [C II], with their peaks being separated by 70′′ in the NE-SW direction, i.e., 0.67 pc at the distance of 1.98 kpc (Xu et al., 2011). In a previous analysis the extended [C I] emission (west from the ionization front), and its particular peak emission in front of the bulk CO emission (if stratified, the [C I] peak should be observed before the CO peak, from the direction of the PDR interface), was argued to emerge from the interclump regions of a very clumpy medium, but could also result from a partial face-on illumination of the molecular clouds (e.g., Stutzki et al., 1988; Stutzki & Güsten, 1990; Meixner et al., 1992; Pérez-Beaupuits et al., 2010). In the context of the clumpiness of the PDR and the newly discovered association of much of the [C II] emission with atomic gas (see below) at velocities not matched by any molecular material, the [C II] peak cannot be interpreted as the classical stratification expected in a homogeneous PDR333In a clumpy PDR, with many internal surfaces, the [C II] peak should be even closer to the [C I] peak, becoming indistinguishable from it depending on clumpiness of the source and spatial resolution of the observations., but instead has to be caused by excitation gradients with increasing optical depth into the atomic and molecular cloud.
The excitation study of the warm PDR layers, including the CO excitation, will be the subject of a forthcoming publication. Here we briefly elaborate on the new GREAT data: The 12CO =13–12 line follows a similar spatial distribution as the lower- lines reported in Pérez-Beaupuits et al. (2010), although the whole 12CO =13–12 emission is shifted toward the ionization front. Its peak emission is 16′′ (0.15 pc) southeast of the 12CO =6–5 peak. The =13–12 line is already fainter than the lower- transitions, indicating subthermal excitation.
4 Discussion
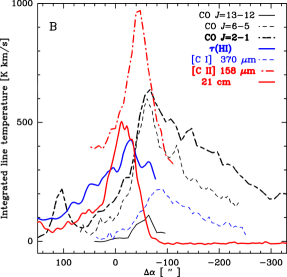
We can distinguish two different spatial regimes in the PDR with embedded star cores of active star formation. The strip line along (P.A. , Fig. 2A) traces the embedded star-formation, going through the ultracompact H II region UC1 (), the embedded H2O maser positions farther west, and the weaker additional H II region seen as a separate clump at in the 21 cm continuum map and matching the secondary peak of [C II], [C I], and the 12CO =2–1 lines (Figs. 1b and 2A). A dominant internal heating is likely suppressing the layering here. The strip with the position angle (Fig. 2B) instead traces the classical PDR. For a homogeneous PDR one expects a stratified layering of [C II] [C I], high- CO and low- CO. However, Stutzki et al. (1988) showed the structure to be very clumpy so that no stratification should be observed. Our observations now show that high- CO and low- CO peak at similar depths in the cloud while the integrated [C II] peak is shifted by pc relative to the CO peaks. The [C II] shift cannot even be explained by homogeneous PDR models, much less by a clumpy medium.
In [C II] we detect all velocity components that were discussed in the H I channel maps by Brogan & Troland (2001, their Figs. 4 and 5), including a weak foreground cloud at 7 , shocked gas in front of the cluster that is blown toward the observer at 11–17 , and the main PDR velocity of 21 . In the higher density gas (west of the H II region), [C II] seems to be optically thick, showing self-absorption dips at the peak velocities of H I and the molecular lines. The 12CO =2–1 emission also traces the optically thin shocked gas down to 10 (Fig. 4), the 12CO =13–12 line is hardly excited there. A good match between [C II] and 12CO =2–1 can be seen at intermediate velocities (Fig. 3, right panel) where the shifted [C I] emission with respect to [C II] is also evident.
We can compare the column density contributions visible in the different velocity components using the column density for the H I gas by Brogan & Troland (2001) and the C+ column density (e.g., Schneider et al., 2003, their eq.A.4) responsible for the observed [C II] emission. For the gas temperature and the density we assumed 250 K and at the offset (0,0), and 150 K and for the offsets deeper in the cloud according to Pérez-Beaupuits et al. (2010).
To compare our results with the H I data we estimated [C II] and H I column densities at selected positions along the southern PDR (Fig. 4) from the [C II] emission and H I optical depths, integrating the spectra in the velocity ranges 11–17 and 17–24.5 . Selection of these velocity ranges is described by Brogan et al. (1999). In the range 11–17 we found ([C II]) (with uncertainties of 20%) between 6.510 at offset position (0,0) and 1.610 at (, ), while the corresponding H I column densities vary (with uncertainties 7–16%) between 5.510 and 4.710, respectively. In the velocity range 17–24.5 the [C II] column densities are between 1.210 and 2.910 at the same offset positions, and we found (H I) between 3.710 and 4.410. The variation in HI column densities is less than 20% in both velocity ranges, indicating a relatively homogeneous H I interface seen also by [C II]. The latter, instead, presents a much stronger column variation (40%–60%) depending on the ambient conditions.
Assuming the normal cosmic carbon abundance of (Wakelam & Herbst, 2008) and complete ionization of the carbon, we obtained gas column densities for the low-velocity component and for the high-velocity component. The [C II] emission of the low-velocity component in front of the PDR is therefore consistent with pure H I gas, while for all other components (above 17 ) at least half of the [C II] emission stems from molecular gas, i.e., classic PDR material. The material in front of the southern PDR must be atomic to a high degree, indicating non-equilibrium chemistry (e.g. Stoerzer & Hollenbach, 1998).
5 Final remarks
The integrated intensity maps do not tell us about the origin of the emission lines. Only narrow channel maps of the velocity-resolved [C II] spectra show a correlation with the diffuse gas components. From the comparison of different tracers in different velocity components we found that for the regions of embedded star formation the internal heating is always the dominant process, providing a very good match of all tracers without significant layering. The good spatial correlation of CO, [C II], and other tracers at particular velocity components/channels confirms the clumpy PDR picture from Stutzki & Güsten (1990). However, a significant fraction of the [C II] velocity components is not associated (spatially) with the dense (high- CO) or the diffuse (H I and CO =2–1) PDR tracers. The structure neither matches a stratified nor a clumpy PDR model. The [C II] emitting gas is only partially explained by atomic gas. Optically thin, hot molecular gas must contribute more than half of the emission.
Acknowledgements.
We are grateful to C. Brogan for providing the 21 cm and H I data. We thank the referee for the very careful reading of the manuscript and constructive comments. Results are partially based on observations made with the NASA/DLR Stratospheric Observatory for Infrared Astronomy. SOFIA Science Mission Operations are conducted jointly by the Universities Space Research Association, Inc., under NASA contract NAS2-97001, and the Deutsches SOFIA Institut under DLR contract 50 OK 0901. We also gratefully acknowledge the outstanding support by the observatory staff. This work was supported by the German Deutsche Forschungsgemeinschaft, DFG project SFB 956C.References
- Beetz et al. (1976) Beetz, M., Elsaesser, H., Weinberger, R., & Poulakos, C. 1976, A&A, 50, 41
- Brogan et al. (1999) Brogan, C., Troland, T., Roberts, D., & Crutcher, R. 1999, ApJ, 515, 304
- Brogan & Troland (2001) Brogan, C. L. & Troland, T. H. 2001, ApJ, 560, 821
- Genzel et al. (1988) Genzel, R., Harris, A. I., Stutzki, J., & Jaffe, D. T. 1988, ApJ, 332, 1049
- Guan et al. (2012) Guan, X., Stutzki, J., Graf, U., Güsten, R., & et al. 2012, A&A, this volume
- Güsten & Fiebig (1988) Güsten, R. & Fiebig, D. 1988, A&A, 204, 253
- Hanson et al. (1997) Hanson, M. M., Howarth, I. D., & Conti, P. S. 1997, ApJ, 489, 698
- Harris et al. (1987) Harris, A. I., Stutzki, J., Genzel, R., et al. 1987, ApJ, 322, L49
- Heyminck et al. (2012) Heyminck, S., Graf, U., Güsten, R., et al. 2012, A&A, this volume
- Howe et al. (2000) Howe, J. E., Ashby, M. L. N., Bergin, E. A., et al. 2000, ApJ, 539, L137
- Johnson et al. (1998) Johnson, C. O., Depree, C. G., & Goss, W. M. 1998, ApJ, 500, 302
- Klein et al. (2012) Klein, B., Hochgürtel, S., Krämer, I., et al. 2012, A&A, this volume
- Matsuhara et al. (1989) Matsuhara, H., Nakagawa, T., Shibai, H., et al. 1989, ApJ, 339, L67
- Meixner et al. (1992) Meixner, M., Haas, M., Tielens, A., Erickson, E., & Werner, M. 1992, ApJ, 390, 499
- Okada et al. (2010) Okada, Y., Kawada, M., Murakami, N., et al. 2010, A&A, 514, A13
- Pellegrini et al. (2007) Pellegrini, E. W., Baldwin, J. A., Brogan, C. L., et al. 2007, ApJ, 658, 1119
- Pérez-Beaupuits et al. (2010) Pérez-Beaupuits, J. P., Spaans, M., Hogerheijde, M. R., et al. 2010, A&A, 510, A87+
- Povich et al. (2009) Povich, M. S., Churchwell, E., Bieging, J. H., et al. 2009, ApJ, 696, 1278
- Schneider et al. (2003) Schneider, N., Simon, R., Kramer, C., et al. 2003, A&A, 406, 915
- Stoerzer & Hollenbach (1998) Stoerzer, H. & Hollenbach, D. 1998, ApJ, 495, 853
- Stutzki & Güsten (1990) Stutzki, J. & Güsten, R. 1990, ApJ, 356, 513
- Stutzki et al. (1988) Stutzki, J., Stacey, G. J., Genzel, R., et al. 1988, ApJ, 332, 379
- Wakelam & Herbst (2008) Wakelam, V. & Herbst, E. 2008, ApJ, 680, 371
- Xu et al. (2011) Xu, Y., Moscadelli, L., Reid, M. J., et al. 2011, ApJ, 733, 25