Evidence of a two–dimensional grain sliding regime in the plastic deformation of micron and sub–micron films.
Abstract
Copper and aluminium sub–micron films are structured as columnar arrays of grains traversing the entire film, and hence are virtual two–dimensional polycrystalline solids. A closed–form solution for the two–dimensional plastic flow is obtained assuming that grain boundary sliding is the dominating mechanism for deformation. The theoretical results obtained here are in close agreement with experimental data appeared in the literature, which suggests further work on the subject.
keywords:
thin films, plastic deformation, grain boundary sliding, modelingPACS:
62.20.F-, 62.23.Kn, 62.25.-g, 68.90.+gTensile and compressive stresses of thermal origin can reach hundreds of MPa in the small–scale structures of a complex microelectronic device, either on service or in the fabrication process. Besides, the strong functional interdependence of the numerous constituents of the system leaves no tolerance for local strain failures. The structural dimensions of current microsystems are in the length scale of 100 nm or less. Hence, reliable design ensuring no risk of stress–induced catastrophic defect demands precise knowledge of the mechanical properties of sub–micron metallic films, together with a good understanding of the response of the film to strongly varying stresses. This has opened a new field of research in materials science because the mechanical behaviour of thin films has proven to be very different from that of their bulk counterparts.
Normal–view and cross–sectional micrography has shown that polycrystalline sub–micron films have grain sizes larger or of the order of the film thickness, with grains traversing the entire film [1, 2]. Typical films are structured as columnar arrays of grains which in the plane of the film exhibit random equiaxed shapes and crystallographic orientations. However, partial crystallographic ordering is detected in the direction normal to the film plane. The grains of copper sub–micron films, either self–standing or on a supporting substrate, show strong tendency to orient the (111) crystal direction along the normal to the film surfaces [1, 2].
A sub–micron metallic film of this kind configures a physical realization of a two–dimensional polycrystalline solid. The interest of this goes beyond the technical applications because provides means for the laboratory testing of theoretical models for plastic flow in a reduced dimensionality. Techniques for the fabrication and mechanical testing of self standing beams of sub–micron thickness have been developed in recent years [3]. Besides this, a neat solution for the problem of drawing out the intrinsic film mechanical properties when testing thin films on substrates has appeared quite recently in the literature. In it the true stresses exerted in both principal directions of a metallic film, deposited on a compliant polymer substrate, are accurately measured by diffracting in situ the X–rays coming from a synchrotron source [2]. The diffraction pattern reveals the distortions of the crystal cells of the metallic film, which are proportional to the true stresses operating on the film. The stabilising effect of the substrate permits relatively large plastic tensile and compressive deformation of films as thin as 80 nm without the risk of buckling. Because of the mismatch of the Poisson ratios of the metallic film and the substrate, any strain in the longitudinal direction is associated not only to a stress in that direction, but also to a stress in the transversal one. This is not a serious shortcoming because the method gives both stresses, and , and what matters is the difference between them, as will become clear in what follows.
Experiments on copper [2] and aluminium [3] micron and sub–micron films show that the plastic deformation starts with a strong but brief hardening period, going to not beyond 0.5% strain, followed by a plateau or a slowly softening regime extending up to failure. Simulations by von Blanckenhagen et al. [4] of the response to an applied stress of the dislocation sources in a representative columnar grain, and the subsequent dislocation dynamics, explains very well the initial strengthening plastic deformation, fitting both the measured stress–strain curves and dislocation densities. However, for strains exeeding 0.5% the simulation gives too large stresses and does not explain the plateau, suggesting a crossover with another deformation mechanism. We provide here supporting evidence that the latter higher strain mechanism is two–dimensional grain sliding.
If we assume that grain boundary sliding is the dominant mechanism for the plastic deformation of the film, we can reduce the general theoretical formalism of Ref. [5] to two–dimensions for analysing the data. The basic hypothesis of the model is that adjacent grains can slide past each other over long distances by effect of the shear stresses actuating in their shared boundaries, accommodating at the same time their shapes by internal mechanisms to prevent voids at the interfaces and preserve matter continuity. The sliding–induced stress fields associated to grain shape accommodation are of little relevance because are assumed much weaker than the shear stress causing grain sliding. The latter is linearly related with the relative speed between the adjacent grains and has a threshold , below which no elementary sliding process can occur [6].
Fig. 1 represents a pair of adjacent two–dimensional grains. The and axes of the local frame of reference , associated to the unitary vectors and , are normal and parallel to the grain boundary shared by the grains, respectively. The main frame of reference , with unitary vectors and , has its axes in the principal directions of the stress tensor. Denoting , , the components of the stress tensor in the frame of reference, the relative velocity of the two grains is
| (1) |
where is a proportionality coefficient and is the sign of the shear stress . The term ensures that when . This expresion for has proven to hold with great accuracy for several aluminium, titanium and magnesium alloys [7]. The coefficient must not depend on either the shear stresses or the orientation of the grain boundary, therefore its dependence on the normal stresses is only via the hydrostatic pressure invariant [8, 9].
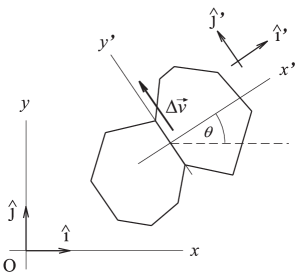
Replacing , where and are the principal stresses and is the rotation angle defined in Fig. 1, and , it gives
| (2) |
which presumes that
| (3) |
and otherwise . A grain boundary whose normal subtends with the principal direction or an angle smaller than is not able to slide because the in–plane shear stress is below , no matter how strong the external forces may be.
To link these equations with the velocity field of the plastically flowing film, consider two points at and . The macroscopically small segment intersects a large number of grain boundaries, and then , where is the mean grain size. The relative velocity between the starting and final points of the segment is the sum of the relative velocities between the consecutive grains it passes through. Thus
| (4) |
where numbers the successive grain boundaries intersecting . But for the factor in the denominator, the right–hand–side of this equation defines an average. Consequently, in the proper limit,
| (5) |
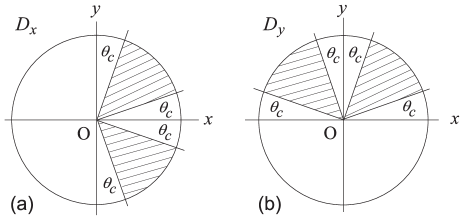
where symbol means the average over all boundary orientations compatible with . With the latter restriction and recalling condition (3) this means
| (6) |
where the integration domains and are those shown in Fig. 2. Solving one obtains that
| (7) | ||||
where
| (8) |
These equations assume that the mean grain size is conserved, and yield a complete set of equations for the velocity field of the material medium in terms of the stresses. From them
| (9) |
which means that the plastic flow is laminar and conserves the film specific area . The strain rate tensor follows directly from Eqs. (7), explicitly
| (10) | ||||
for the biaxial deformation with principal axes and .
Eqs. (10) and (8) show two very important properties,
specific to the two–dimensional plastic flow by grain sliding. They
are:
(i) The stresses depend only on the strain rates, and not on
the strains. Hence no strain hardening or softening of the material is
expected in a bidimensional grain sliding plastic regime.
(ii) The ratio between the true strain rates and the coefficient
depends on the principal stresses only through their
difference . As explained before, the coefficient
is expected to depend on the pressure invariant
, however this dependence seems to be rather
weak at room temperature, as revealed by the experimental data shown
next.
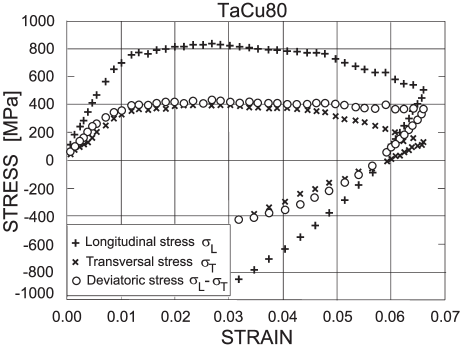
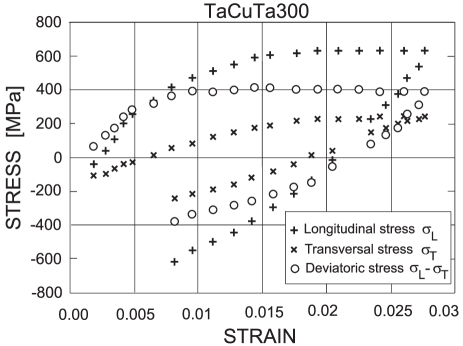
Fig. 3 shows the data of Gruber et al. [2] on a copper film of thickness and mean grain size (measured in the film plane), deposited on a polyimide substrate and strained at constant strain rate. The film incorporates a capping tantalum layer of 9 nm thick. The principal stresses and , which can be assimilated to and in Eqs. (10) and (8), were measured by the synchrotron X–ray diffration method. The graph shows that both and vary with the strain , which is assimilable to in the previous equations. The longitudinal stress rapidly increases to a maximum at and then decreases monotonically to when the tensile test ends at . The transversal stress displays a similar behaviour, with maximum at and at . Both stresses vary a few hundreds MPa and are far from constant.
Instead, the difference (white circles) increases rapidly in the interval and then remains nearly constant up to the end of the tensile test at . Recalling Eqs. (10) and (8), this evidences that the tensile test was carried out at a constant strain rate. To be precise, the cross–head displacement of the mechanical testing machine was increased in small steps because the registration of a diffraction picture takes one or two minutes. Also, the flat region of the curve vs. has a slight negative slope, which can be explained because what was kept constant in the experiment was the engineering strain rate, while in Eq. (10) is the true strain rate. When the engineering strain rate is maintained constant, the true strain rate diminishes with strain, and the same does , as given by Eq. (10). It is usually argued that plastic deformation is driven by the deviatoric principal stresses , where the hydrostatic pressure is the negative average of the normal stresses. In two dimensions the deviatoric stress is . In the insets of the figures we disregarded the factor 1/2 and called the deviatoric stress to .
Upon unloading, Fig. 3 shows that varies linearly with , with a slope close to the one displayed by the elastic part of the loading curve. On compression, converges rather slowly to a compressive net stress , which is a quantity amazingly close to the tensile strain at the same strain in the tensile plateau of the experimental curve. This shows that the material undergoes no final strain strengthening or weakening, that is, no Bauschinger effect seems to occur.
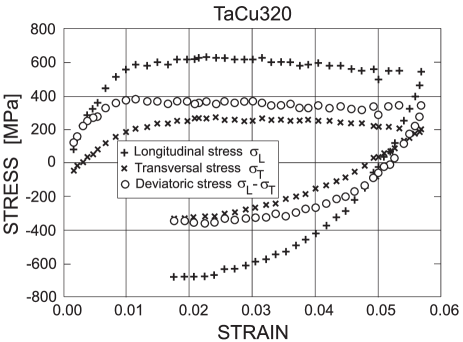
Figs. 4 and 5 displays the data given by similar experiments with copper films of different thicknesses and mean grain sizes, and with one or two passivating tantalum layers of 8 nm thick. As in Fig. 3, and by the same reason, in both cases the plateau exhibits a small negative slope. Upon compression, converges rather slowly to near the same stress of the tensile plateau. Again the material seems to undergo no Bauschinger effect. Fig. 6 reveals results of a similar experiment, conducted now with a bare copper film of thick on polyimide, with no passivating coatings, strained at constant strain rate. Again keeps constant for and shows a more regular behaviour than the original data on and .
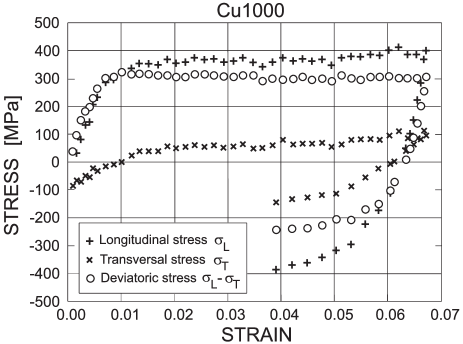
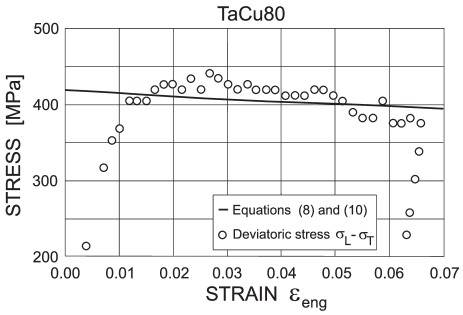
Fig. 7 displays and expanded view of the tensile branch appearing in Fig. 3. Together with the experimental data, the figure shows the curve of true stress vs. engineering strain given by Eqs. (10) and (8) under the assumption that the engineering strain rate was kept constant in the tensile run. If the engineering strain rate is constant, the true strain rate decreases with , and the same should happen to the true stress . The curve was obtained from , where is the function of given by Eqs. (10) and (8). Just to show an example of the procedure we adopted and .
The two–dimensional plastic behaviour of submicron films has a special interest from a theoretical viewpoint. Making the same hypotheses and reasoning the same way as done to obtain Eq. (10), but now in a medium of three–dimensional polyhedra, one finds out that [5]. Hence the three–dimensional model yields non conservation of the specific volume. As volume variations can only be supported by the elasticity of the grains, one can recall Hooke’s law and write , where is the bulk elastic modulus and the pressure variation rate. This new equation determines that the stresses are not independent dynamical variables, plastic deformation is essentially a time–dependent problem and the stresses turn out dependent of the strain components [5]. Hence the three–dimensional version of the model yields strain strengthening or softening. The two–dimensional case is free of these complications, and thus sub–micron films are particularly suited for testing experimentally the hypotheses of the model for plastic deformation by grain sliding, which should hold the same in two– or three–dimensions.
References
- [1] Y. Xiang, J.J. Vlassak, Acta Mater. 54 (2006) 5449- 5460.
- [2] P. A. Gruber, J. Böhma, F. Onuseit, A. Wanner, R. Spolenak, E. Arzt, Acta Mater. 56 (2008) 2318- 2335.
- [3] C. Malhaire, C. Seguineau, M. Ignat, C. Josserond, L. Debove, S. Brida, J.M. Desmarres, X. Lafontan, Rev. Sci. Instrum. 82, 023901 (2009).
- [4] B. von Blanckenhagen, E. Arzt, P. Gumbsch, Acta Mater. 52 (2004) 773 784.
- [5] M. Lagos, V. Conte, Scripta Mater. 65 (2011) 1053- 1056.
- [6] Y. Qi, P.E. Krajewski, Acta Mater. 55 (2007) 1555.
- [7] M. Lagos, C. Retamal, Phys. Scr. 81 (2010) 055601.
- [8] M. Lagos, Phys. Rev. Lett. 85 (2000) 2332.
- [9] M. Lagos, Phys. Rev. B 71 (2005) 224117.