The filamentary multi-polar
planetary nebula NGC 5189 222Based on observations obtained with the Swope and du Pont telescopes at Las Campanas Observatory and archival material from the Gemini Observatory and NASA/IPAC Infrared Science Archive
Abstract
We present a set of optical and infrared images combined with long-slit, medium and high dispersion spectra of the southern planetary nebula (PN) NGC 5189. The complex morphology of this PN is puzzling and has not been studied in detail so far. Our investigation reveals the presence of a new dense and cold infrared torus (alongside the optical one) which probably generated one of the two optically seen bipolar outflows and which might be responsible for the twisted appearance of the optical torus via an interaction process. The high-resolution MES-AAT spectra clearly show the presence of filamentary and knotty structures as well as three expanding bubbles. Our findings therefore suggest that NGC 5189 is a quadrupolar nebula with multiple sets of symmetrical condensations in which the interaction of outflows has determined the complex morphology.
Presentamos un conjunto de imágenes ópticas e infrarrojas combinadas con espectros de rendija larga de mediana y alta dispersión de la Nebulosa Planetaria (NP) del sur NGC 5189. La compleja morfología de esta NP es desconcertante y no había sido estudiada en detalle hasta ahora. Nuestra investigación revela la presencia de un toroide denso y frío, en el infrarrojo, el cual probablemente generó uno de los dos flujos bipolares vistos en el óptico y podría, mediante un proceso de interacción, ser también responsable de la apariencia retorcida del toroide óptico. Los espectros de alta resolución del MES-AAT muestran claramente la presencia de nudos y estructuras filamentosas, así como tres burbujas en expansión. Nuestros hallazgos sugieren que NGC 5189 es una NP cuadrupolar con varios conjuntos de condensaciones simétricas donde la interacción de flujos determinó su compleja morfología.
ISM:planetary nebulae: individual (NGC 5189)
0.1 Introduction
NGC 5189 (PK 307-031, PN G307.2, He 2) belongs to a group of bipolar planetary nebulae that exhibit more than one bipolar structure. Examples of objects in this class are NGC 2440 (López et al., 1998), NGC 6302 (Meaburn et al., 2008), NGC 6309 (Vázquez et al., 2008), NGC 1514 (Aryal et al., 2010) and NGC 6644 (Hsia et al., 2010). These kind of objects represent particularly interesting cases of study as they show morphological signatures of episodic mass outflows, most likely emerging from a precessing source. This type of phenomenon is receiving increasing attention in the literature, and is found not to be restricted to PNe with bipolar morphologies. The point symmetric IC 4634 (Guerrero et al., 2008) and the elliptical Fleming 1 (PN G290.5+07.9) (López et al., 1993) are examples of objects that have been discussed under assumptions of episodic, symmetric outflows with precessing symmetry axis. In the case of elliptical PNe, instead of multiple lobes one finds twisted strings of ansae and condensations delineating the presumed precession of the symmetry axis. Theoretical models like those of Soker & Livio (1989, 1994), based on close binary systems combined with a precessing systemic axis describe one of the plausible scenarios under which such conditions may occur. The implication of magnetic fields should not be discarded as magnetohydrodynamic (MHD) models such as those by García-Segura et al. (1999) were able to reproduce the collimated outflows (or jets) observed by coupling magnetized winds and stellar rotation.
Phillips & Reay (1983) have pointed out the interesting structure of NGC 5189 which they describe at first sight as “highly chaotic”. In their electronographic narrow band images, they identified five pairs of condensations or ansae (low-ionization structures following Gonçalves et al. 2001) symmetrically distributed with respect to the central star (CS) at different position angles. The authors infer the occurrence of multiple mass loss events with a change of orientation in time to explain the observed pattern. And to account for the precessing phenomenon, they suggest the presence of a binary system (sheltering the precessing central star) with a few days period. To our knowledge no binary companion has been detected so far in NGC 5189.
Reay et al. (1984) used a wide field imaging Fabry-Perot system to obtain a bidimensional line profile map of NGC 5189. By this mean they derived the kinematics of two potential pairs of ansae and their results indicate rather low-medium velocities. Indeed, the first pair, which corresponds to the smallest and closest (to the CS) condensations as defined by Phillips & Reay (1983), is described as an inner ring with an expansion velocity of 25.3 km s-1 (radially, from the CS). The radial velocities of the second more distant pair of ansae to the CS following Phillips & Reay (1983) have been derived as km s-1.
Despite its significant asymmetry, NGC 5189 has not been extensively studied from a morphological point of view and the main information collected are gathered in Table 1. Also, in this paper we present unpublished optical imaging data, medium– and high resolution spectra as well as newly analysed infrared images from the Midcourse Space Experiment (MSX; Price et al. 2001) and the recent Wide-field Infrared Survey Explorer (WISE; Wright et al. 2010) surveys. The combination of datasets will help us to analyse in detail the morphological structure of the PN.
3 Property Value Type PN Ia, IIab Distance (kpc) 0.88c, 0.90d, 0.55e, 0.70f, 0.54l (H)Balmer 0.65a, 0.85l (H)Radio 0.56a, 1.83l (5GHz) (mJy) 455c, 507l (\arcsec) 140c, ([O III]) ( K) 1.310.05a ([S II]) (cm-3) 39060a, 200–900i, 1000l (K) 135103k Stellar Type [WC 2]g, [WO I]h,i (O VI sequence) log (/L) 2.90.5k References: aKingsburgh & Barlow (1994), bQuireza et al. (2007), cZhang (1995), dTajitsu & Tamura (1998), ePhillips (2004), fMaciel & Koppen (1994), gMendez (1991), hMiszalski et al. (2009), iPolcaro et al. (1997), jTylenda et al. (2003), kAlthaus et al. (2010), lHua et al. (1998).

0.2 Observations and Results
0.2.1 Optical Imaging
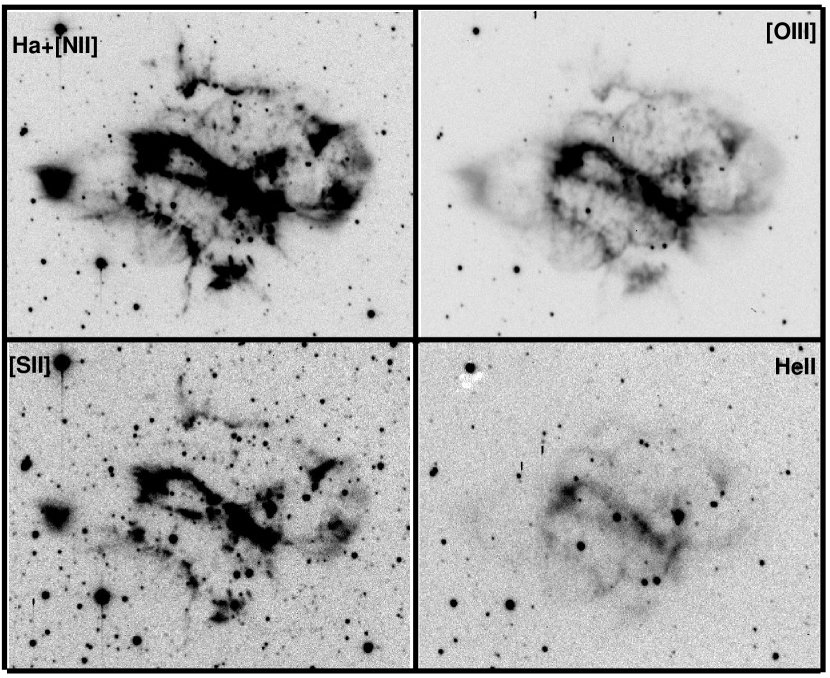
A set of images of NGC 5189 were obtained at Las Campanas Observatory (LCO, Chile) on the 1.0 m Swope telescope in May 1990, with a Texas Instruments (TI#1) CCD detector. The effective scale is 0.435 arcsec/pixel corresponding to a nominal field of 5.8 square arcmin. The interference filters were centred on H (Å), [O III] (Å), [S II] (Å) and He II 4686 (Å) with exposure times of 600 s (H and [O III]), 900 s and 1200 s, respectively. The images, presented in Fig. 1, were trimmed to pixels and reduced with the standard iraf111 IRAF is distributed by the National Optical Astronomy Observatory, which is operated by the Association of Universities for Research in Astronomy (AURA) under cooperative agreement with the National Science Foundation methods.
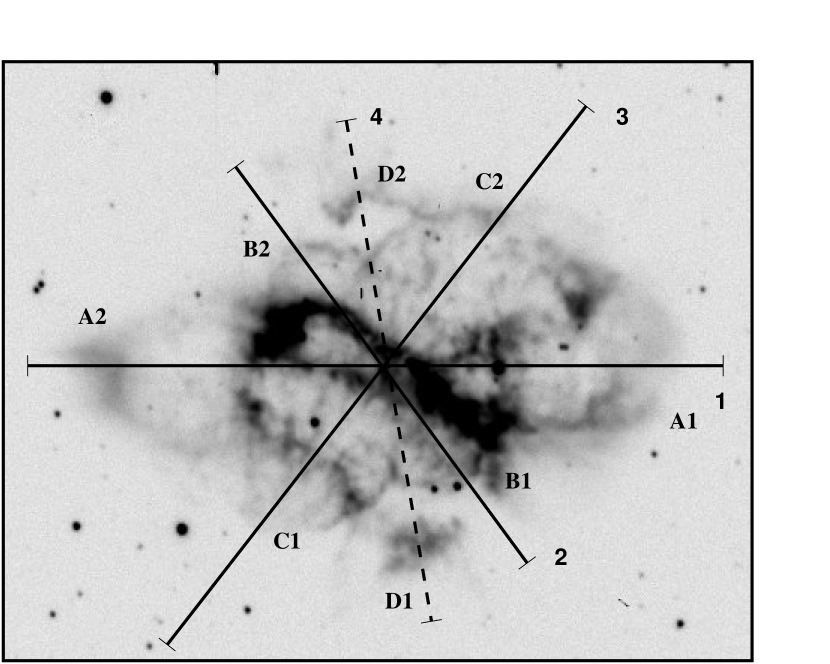
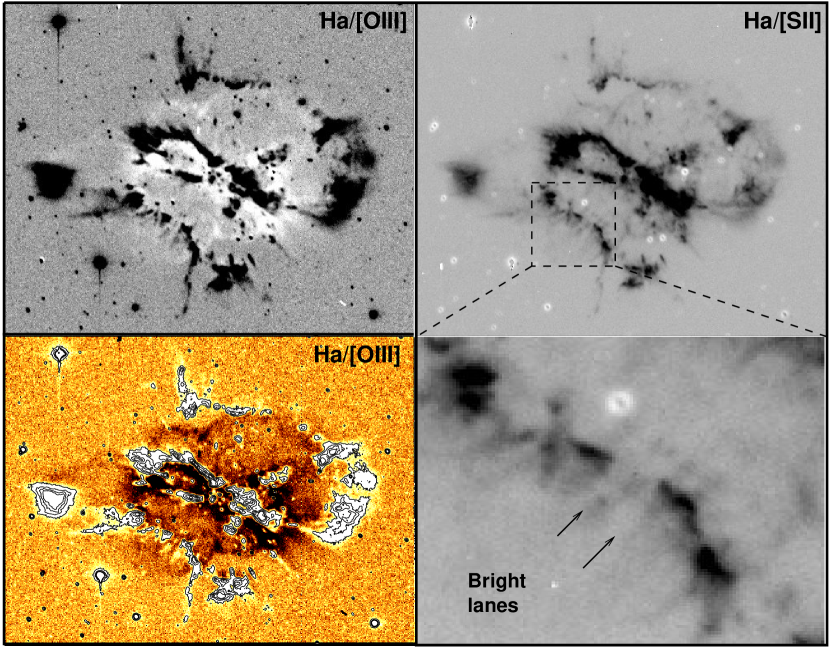
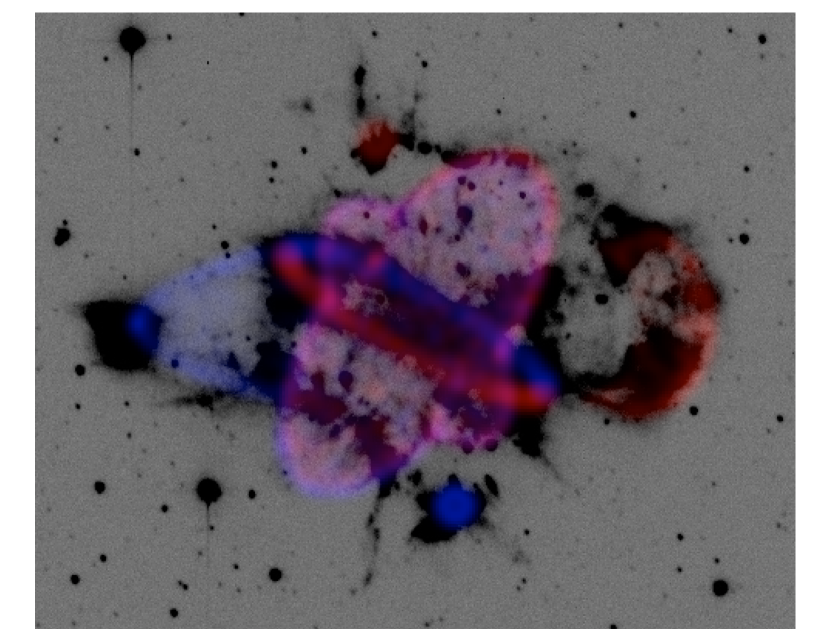
The [O III] frame (and to a lesser extent the He II one) in Fig. 1 perfectly delineates the highly excited multiple outflows remarking the complex morphology while the H+[N II] and [S II] frames underline the central part and borders of NGC 5189. Fig. 2 presents the three likely outflows seen in NGC 5189 (well illustrated in the [O III] image) and numbered 1, 2, and 3 orientated at the respective position angles (PA) of 90, 37 and 141 and the respective associated pairs of collimated outlows A1–A2, B1–B2 and C1–C2. The existence of a fourth outflow (numbered 4 on Fig. 2) at PA 10 is less clear as only the ‘polar’ caps of the probable ejections are seen (D1 and D2). This case will be discussed later in the article. All the bipolar structures are emerging from the same geometric center related to the central star. The condensations or ansae defined by Phillips & Reay (1983) which include the opposite structures named B1, B2, and C by Reay et al. (1984) are clearly identified in our images (and particularly in the image ratio H(+[N II])/[O III], Fig. 3) and correspond to the tips of the axes 1 and 4 (A2, D1, and D2). The H(+[N II])/[O III] frame which traces the excitation conditions, also shows that the high excitation structures are mainly related to the central toroidal-like belt and the outer edges of NGC 5189. It is also interesting to notice from the image ratio in Fig. 3 that the [O III] emission is globally enclosed in this H+[N II] ‘nested bubble’ and seems to form a bipolar structure whose waist is coincident with the axis 4 and whose long axis is coincident with the axis 1. The [S II] emission is distributed similarly to that of H+[N II] and from Fig. 3 (top and bottom right), it appears that the string of knots forming the outer edges (the opposite North-West and South-East rims), may in fact reflect a discontinuity in the high excitation outer shell of the PN. The poly-symmetric structure of NGC 5189 is clearly related to its dynamic evolution. A signature of this dynamical process are the dark lanes well seen in between knots of the South-East outer rim in the non-inverted H and [S II] images.
All images in Fig. 1 clearly show the presence of a knotty central toroidal structure with a major axis size of about 78\arcsecand a PA of 62. This structure seems flatten, tending more towards a disk description, with radial filaments emerging from its outer border. This torus/disk seems also to be slightly twisted. Several collimated cometary knots are located in NGC 5189 and are well seen in Fig. 4. Those knots suggest the interaction of the stellar wind and photoionizing flux with the nebular material.
0.2.2 IR imaging
The dust and molecular content of PNe has often been used as morphological tracer in the infrared wavebands (e.g. Phillips & Ramos-Larios 2008; Ressler et al. 2010; Ramos-Larios et al. 2008). We present Near-, Mid-Infrared (NIR and MIR) and H2 images of NGC 5189. In Fig. 5 we show the D-band (14.65-) image of the MIR MSX as well as a composite image of the data bands A, D, and E at the respective wavelengths 8.28-, 14.65- and 21.34-. The respective fluxes being 0.216 Jy at 8.28-, 1.029 Jy at 14.65-, and 1.635 Jy at 21.3-, with the respective quality flux of 3, 2 and 1 (i.e. good, fair and limit; Egan et al. 2003). The spatial resolution of of the Spatial Infrared Imaging Telescope which gathered the MSX data, allows us to distinguish a dusty structure which is found to be coincident with the torus and some parts of the outer borders of the PN when compared to an optical image. From the MSX data, mainly the D band, it is clear that the dust is not equally distributed with more material in the southern side of the toroid than its northern side. But this effect could be due to the projection of the toroid.
WISE images, from the preliminary catalogue and image atlas, were retrieved from the NASA/IPAC Infrared Science Archive (IRSA). WISE is a NASA Explorer mission that survey the entire sky at wavelengths of 3.4, 4.6, 12, and 22-m (W1 through W4, respectively). An advantage of WISE is its angular resolution better than that of MSX with 61, 64, 65 and 120 at 3.4, 4.6, 12, and 22-m respectively.
Fig. 6-Top Left shows a 3-colors image of NGC 5189 using the 3.4-m (blue), 4.6-m (green) and 12-m (red) [close to the MSX D band] where we immediately notice a bright X-shaped structure which also seems to display much fainter ansae. The peculiar central morphology is well seen at the largest wavelengths i.e. in the W3 and W4 wavebands (12 and 22-m where the derived magnitudes are the highest with 5.7 mag and 2.0 mag respectively) which allow us to measure an opening angle of between both arms which also have nearly the same length ( for the arm A and for the arm B). By comparing the WISE and optical morphologies we can appreciate the dusty nature of NGC 5189 with the 12-m (and 22-m) emission perfectly covering the whole nebula and coinciding with its optical edges. While the arm A is fully coincident with the optical torus, the arm B does not show any obvious optical counterpart i.e. there is no other visible optical torus.
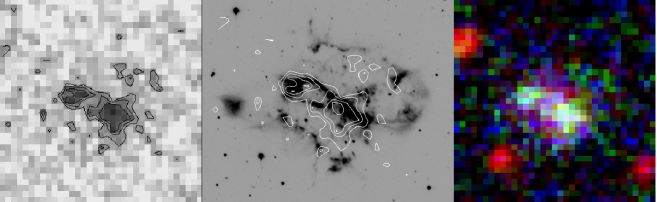
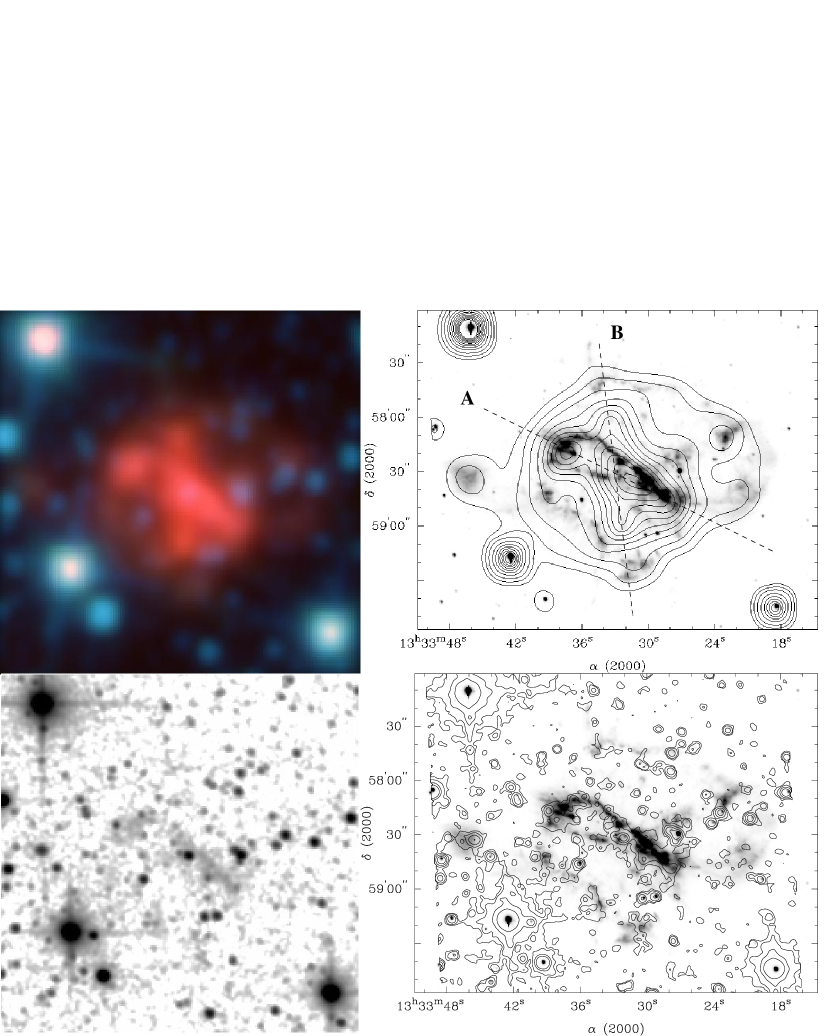
Finally, in order to estimate the distribution of molecular material in NGC 5189 we have retrieved the and data from the 2MASS catalogue and followed the prescription by Ramos-Larios et al. (2006) to infer the H2 distribution in the nebula. The resultant map is shown in Fig 6-Bottom (left and right) that we compare to the optical (H+[N II]) image. The results indicate that the molecular emission is mainly concentrated in the optical torus and there is some indication that H2 is also found in the nebula’s edges and particularly at the northern and southern cometary knots locations. The latter is in agreement with the molecular H2 content generally found in this kind of structures.
0.2.3 Kinematics
Longslit spectra were obtained with the modular spectrometer on the 2.5-m du Pont telescope at LCO in June 1990. The spectrometer was used with its 200-mm camera combined with a CRAF CCD pixels, with 12-m/pixel size. A 1200 lines/mm grating was used to cover the spectral range from –6805 Å. The instrumental combination yields a spectral resolution of FWHM in pixels (linear dispersion of 0.479 Å/pixel) and a spatial resolution along the slit of 0.292 arcsec/pixel. A slit width of 1\arcsec and 149\arcsec long was set. The spectra were flat-fielded and wavelength calibrated against separate exposures of a Quartz and Neon arc, respectively. Two exposures were obtained, one of 1200 s along SE-NW axes and the other one of 1000 s, at the same position angle PA=329, but shifted 36\farcs6 to the West (Fig. 7).
| Slit A | Slit B | Slit C | |||
|---|---|---|---|---|---|
| A1 | +27 | B1 | +32 | C1 | |
| A2 | +40 | B1’ | C2 | ||
| A2’ | B2 | C2’ | +13 | ||
| AA | +11 | B2’ | +27 | CA | |
| AB | BA | CB | |||
| AB’ | +14 | BB | CC | ||
| AC | +52 | ||||
| AD | +26 |
The data points with (’) indicate a zone of expansion and correspond to the velocities measured using the faintest part of this expansion .
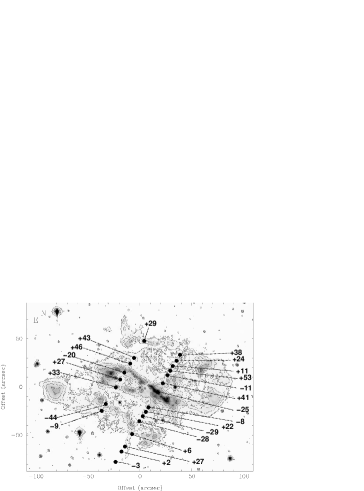
The medium resolution spectra allow us to visually distinguish variations in shape along each spectral line and velocity patterns. With a spectral dispersion of 0.479 Å/pixel over the spectral range yielding a resolution of 21.8 km s-1/pixel, we were able to estimate the radial velocities along NGC 5189 at the two slits positions using the bright [N II] line, adopting a rest wavelength Å. The accuracy on the wavelength calibration is about 4 km s-1. As none of the slits passes through the location of the central star of the nebula, we cannot directly estimate the systemic velocity. However this information was provided trough our high resolution spectroscopy data (see below) where we measured a systemic velocity of km s-1. Fig. 7 shows the velocities at different points of the PN and although we only have the velocity pattern along the two slits, we can give an overall description of the kinematics considering NGC 5189 as a large butterfly type (underlined by the external contours). Indeed, in adequacy with Fig. 7 it therefore appears that globally the northern part of the “optical” torus is blue-shifted (with negative values of -20 and -25 km s-1) while its southern part is red-shifted (with mainly the positive velocity +33 km s-1), giving us the orientation of inclination (Fig. 9). And as one would expect (by pure geometrical effect in an expanding axisymmetric nebula), the southern lobe of the butterfly envelope is mainly blue shifted (Fig. 7 indicates mainly negative velocities down to -44 km s-1) while its northern counterpart is red shifted (with a majority of positive values up to +53 km s-1. This large scale kinematics of the nebula is in agreement with the results obtained by Reay et al. (1984).
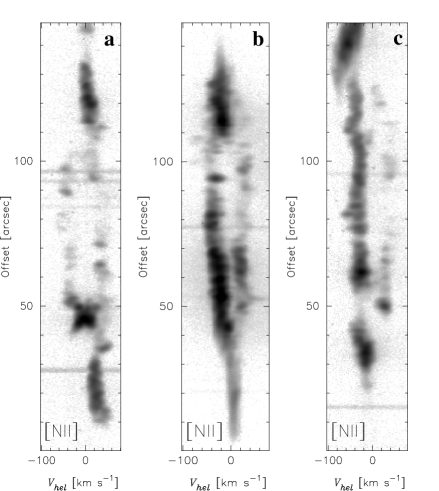
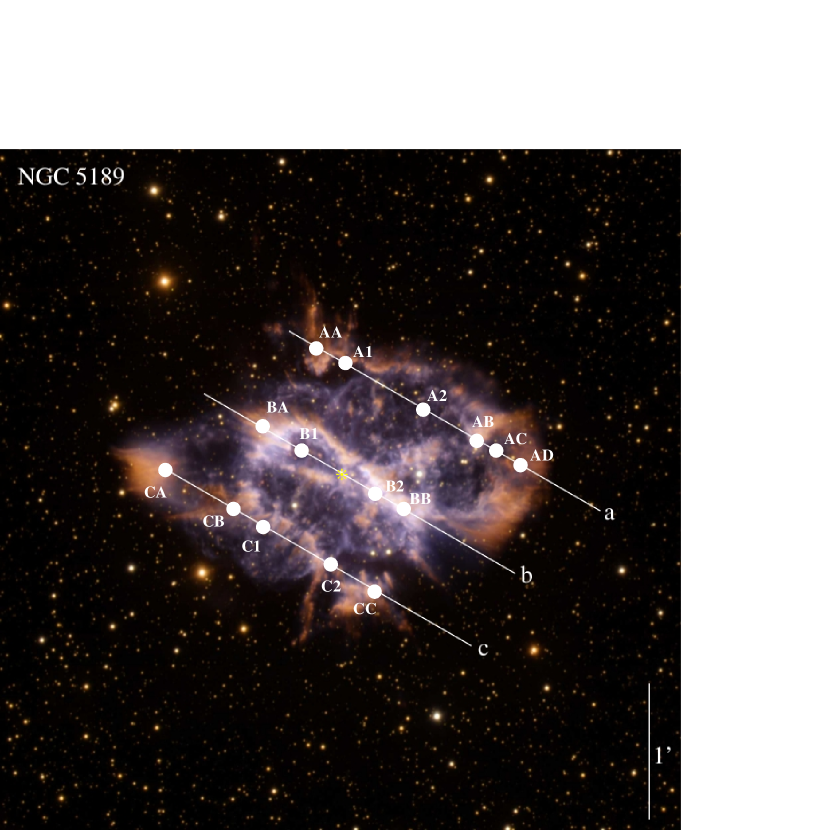
In addition to the LCO spectra, long-slit high resolution spectra better suited for kinematic work, have been obtained with the Manchester Echelle Spectrometer (MES; Meaburn et al. 1984) on the 3.9-m Anglo-Australian telescope (AAT). The observations, performed on 1997 April 14 with a Tektronix CCD with rows of 24-m square pixels, were obtained with a 100 Å wide filter containing H and the [N II] , 6584Å emission lines. The spectral dispersion of Å/pixel over the spectral range yields to a resolution of 11 km s-1/pixel through a slit of width 150-. The total slit coverage is composed of 3 exposures of 1200 s each, all at the position angle PA=61 at opposite location respective to the central star and the torus long axis (Fig. 10). The CCD was binned by two in the spatial direction, giving \arcsec/pixel. These spectra are available in the SPM Kinematic Catalogue of Galactic Planetary Nebulae222http://kincatpn.astrosen.unam.mx (López et al., 2011). The structure of the line profiles, presented in Fig. 8, is outstanding and reflects the highly filamentary and knotty structure of NGC 5189. Similarly to the LCO spectra, the different velocities obtained with the MES spectra were derived using the bright [N II] Å emission line. We identified a systemic velocity of km s-1 ( km s-1) which is comparable to the velocity derived by Schneider et al. (1983) within their error bar.
Also, we obtained the following maximum expansion velocities: km s-1 in the North-West lobe (slit a), km s-1 in the central region (slit b) and km s-1 in the South-East lobe (slit c). Interestingly, those velocities do not show extreme values as would suggest the complex morphology.
The MES–AAT spectra are positioned at with respect to that of the LCO and provide the same global kinematic information related to the main structures evolution as it can be seen in Fig. 9. Fig. 10 presents the detailed kinematics of several zones within NGC 5189 (cf Table 2). The velocities of the structures belonging to the central torus at both opposite sides (points BA and BB) evolve at pretty much the same rate with relative values of and km s-1 respectively, similar to the systemic velocity. The torus is moving homogeneously towards us and therefore would not have the “warped” characteristics where one would expect to see an equally strong red-shifted side. The higher velocities at the expanding points B1 ( km s-1 and km s-1 ) and B2 ( km s-1, km s-1) could be the result of the dynamic motions of structures which come across the torus. The cometary knots in the northern and southern parts of the nebulae (points AA and CC respectively aligned with axis 4 in Fig. 2) show roughly the same velocities with +11 and respectively. Finally, the zones of NGC 5189 located on the [N II] rich butterfly edges (see Fig. 3-Top Left) have been studied (points CA, CB and C1 on the South-East and A1, AC and AD on the North-West) and they globally show the same larger velocities. Thus, the mean velocity of the components of the “southern lobe” is km s-1 while the mean velocity of the components of the “northern lobe” is km s-1.
0.3 Discussion and Conclusion
A detailed study of the seemingly complex structure of NGC 5189 has revealed a poly-polar morphology. The main findings are discussed below.
-
•
This work highlights the presence of a new dense and cold infrared torus whose coincidence with the waist seen in the axis 4 in Fig. 2 indicates that it gave birth to a bipolar outflow which coincides with the nested bubble of [O III] emission. The interaction of this newly discovered IR torus and the optical one (which are related to the same geometric center) might explain the warped morphology of the latter. The twisted torus hypothesis is ruled out by the kinematics measurements.
-
•
The MES-AAT spectra indicate the presence of filamentary and knotty structures as well as the expansion of three bubbles with the following velocities: km s-1 in the North-West lobe (slit a), km s-1 in the central region (slit b) and km s-1 in the South-East lobe (slit c).
-
•
The high resolution spectroscopy data also show that the largest velocities are found at both extremes of the nebulae with km s-1 and km s-1 for the points CA and CB respectively on the eastern side of the PN (Fig. 10), and +26 km s-1 and +52 km s-1 for the opposite points AD and AC on the western side. The similar velocity of the diametrically opposed structures named AA and CC with +11 km s-1 and km s-1 seems to indicate that both are related.
We therefore suggest that NGC 5189 is composed of two symmetry axis each of them composed of a torus associated to a bipolar outflow. This corresponds to the IR torus combined to the [O III] bipolar emission which encloses the outflows B1–B2, C1–C2 and part of A1–A2 (see Fig. 2 and 4); and the optical torus combined to the bright outer filamentary/knotty butterfly structure whose contours are well seen in the H/[O III] image ratio in Fig. 3. Any other lobes would be the result of the expansion or dynamical motions of the existing nebular material in low-density or empty spaces.
The combination of the imaging and spectroscopic data allowed us to make a first step in disentangling and (re-)defining NGC 5189 exact morphology. Indeed, the “chaotic” aspect of NGC 5189 is the consequence of the encounter between two sets of bipolar outflows. The boundary between the different outflows is however not well determined with our kinematic data, although we can see it in the morphology, nor is the process leading to such evolution of the planetary nebula. We therefore need a more complete kinematical mapping (e.g. to derive the inclination angles and the kinematical ages of each structures) to have a better understanding of the formation of NGC 5189.
Acknowledgements
This work is supported by PAPIIT-UNAM grant IN109509 (Mexico). LS acknowledges a Post-Doctoral fellowship from UNAM. Based on observations obtained at the Gemini Observatory (acquired through the Gemini Science Archive), which is operated by the Association of Universities for Research in Astronomy, Inc., under a cooperative agreement with the NSF on behalf of the Gemini partnership: the National Science Foundation (United States), the Science and Technology Facilities Council (United Kingdom), the National Research Council (Canada), CONICYT (Chile), the Australian Research Council (Australia), Ministério da Ciência, Tecnologia e Inovaço (Brazil) and Ministerio de Ciencia, Tecnología e Innovación Productiva (Argentina).This research has also made use of the NASA/ IPAC Infrared Science Archive, which is operated by the Jet Propulsion Laboratory, California Institute of Technology, under contract with the National Aeronautics and Space Administration
References
- Althaus et al. (2010) Althaus, L. G., Córsico, A. H., Isern, J., & García-Berro, E. 2010, A&A Rev., 18, 471
- Aryal et al. (2010) Aryal, B., Rajbahak, C., & Weinberger, R. 2010, MNRAS, 402, 1307
- Egan et al. (2003) Egan, M. P., Price, S. D., Kraemer, K. E., Mizuno, D. R., Carey, S. J., Wright, C. O., Engelke, C. W., Cohen, M., & Gugliotti, M. G. 2003, VizieR Online Data Catalog, 5114, 0
- García-Segura et al. (1999) García-Segura, G., Langer, N., Różyczka, M., & Franco, J. 1999, ApJ, 517, 767
- Gonçalves et al. (2001) Gonçalves, D. R., Corradi, R. L. M., & Mampaso, A. 2001, ApJ, 547, 302
- Guerrero et al. (2008) Guerrero, M. A., Miranda, L. F., Riera, A., Velázquez, P. F., Olguín, L., Vázquez, R., Chu, Y., Raga, A., & Benítez, G. 2008, ApJ, 683, 272
- Hsia et al. (2010) Hsia, C.-H., Kwok, S., Zhang, Y., Koning, N., & Volk, K. 2010, ApJ, 725, 173
- Hua et al. (1998) Hua, C. T., Dopita, M. A., & Martinis, J. 1998, A&AS, 133, 361
- Kingsburgh & Barlow (1994) Kingsburgh, R. L. & Barlow, M. J. 1994, MNRAS, 271, 257
- López et al. (1998) López, J. A., Meaburn, J., Bryce, M., & Holloway, A. J. 1998, ApJ, 493, 803
- López et al. (1993) López, J. A., Meaburn, J., & Palmer, J. W. 1993, ApJ, 415, L135+
- López et al. (2011) López, J. A., Richer, M. G., García-Díaz, M. T., Clark, D. M., Meaburn, J., Riesgo, H., Steffen, W., & Lloyd, M. 2011, ArXiv e-prints
- Maciel & Koppen (1994) Maciel, W. J. & Koppen, J. 1994, A&A, 282, 436
- Meaburn et al. (1984) Meaburn, J., Blundell, B., Carling, R., Gregory, D. F., Keir, D., & Wynne, C. G. 1984, MNRAS, 210, 463
- Meaburn et al. (2008) Meaburn, J., Lloyd, M., Vaytet, N. M. H., & López, J. A. 2008, MNRAS, 385, 269
- Mendez (1991) Mendez, R. H. 1991, in IAU Symposium, Vol. 145, Evolution of Stars: the Photospheric Abundance Connection, ed. G. Michaud & A. V. Tutukov, 375–+
- Miszalski et al. (2009) Miszalski, B., Acker, A., Parker, Q. A., & Moffat, A. F. J. 2009, A&A, 505, 249
- Phillips (2004) Phillips, J. P. 2004, MNRAS, 353, 589
- Phillips & Ramos-Larios (2008) Phillips, J. P. & Ramos-Larios, G. 2008, MNRAS, 386, 995
- Phillips & Reay (1983) Phillips, J. P. & Reay, N. K. 1983, A&A, 117, 33
- Polcaro et al. (1997) Polcaro, V. F., Rossi, C., Viotti, R., & Norci, L. 1997, A&A, 318, 571
- Price et al. (2001) Price, S. D., Egan, M. P., Carey, S. J., Mizuno, D. R., & Kuchar, T. A. 2001, AJ, 121, 2819
- Quireza et al. (2007) Quireza, C., Rocha-Pinto, H. J., & Maciel, W. J. 2007, A&A, 475, 217
- Ramos-Larios et al. (2008) Ramos-Larios, G., Guerrero, M. A., & Miranda, L. F. 2008, AJ, 135, 1441
- Ramos-Larios et al. (2006) Ramos-Larios, G., Kemp, S. N., & Phillips, J. P. 2006, RMxAA, 42, 131
- Reay et al. (1984) Reay, N. K., Atherton, P. D., & Taylor, K. 1984, MNRAS, 206, 71
- Ressler et al. (2010) Ressler, M. E., Cohen, M., Wachter, S., Hoard, D. W., Mainzer, A. K., & Wright, E. L. 2010, AJ, 140, 1882
- Schneider et al. (1983) Schneider, S. E., Terzian, Y., Purgathofer, A., & Perinotto, M. 1983, ApJS, 52, 399
- Soker & Livio (1989) Soker, N. & Livio, M. 1989, ApJ, 339, 268
- Soker & Livio (1994) —. 1994, ApJ, 421, 219
- Steffen & López (2006) Steffen, W. & López, J. A. 2006, RMxAA, 42, 99
- Tajitsu & Tamura (1998) Tajitsu, A. & Tamura, S. 1998, AJ, 115, 1989
- Tylenda et al. (2003) Tylenda, R., Siódmiak, N., Górny, S. K., Corradi, R. L. M., & Schwarz, H. E. 2003, A&A, 405, 627
- Vázquez et al. (2008) Vázquez, R., Miranda, L. F., Olguín, L., Ayala, S., Torrelles, J. M., Contreras, M. E., & Guillén, P. F. 2008, A&A, 481, 107
- Wright et al. (2010) Wright, E. L., Eisenhardt, P. R. M., Mainzer, A. K., Ressler, M. E., Cutri, R. M., Jarrett, T., Kirkpatrick, J. D., Padgett, D., McMillan, R. S., Skrutskie, M., Stanford, S. A., Cohen, M., Walker, R. G., Mather, J. C., Leisawitz, D., Gautier, III, T. N., McLean, I., Benford, D., Lonsdale, C. J., Blain, A., Mendez, B., Irace, W. R., Duval, V., Liu, F., Royer, D., Heinrichsen, I., Howard, J., Shannon, M., Kendall, M., Walsh, A. L., Larsen, M., Cardon, J. G., Schick, S., Schwalm, M., Abid, M., Fabinsky, B., Naes, L., & Tsai, C.-W. 2010, AJ, 140, 1868
- Zhang (1995) Zhang, C. Y. 1995, ApJS, 98, 659