Correlated Spectral And Temporal Behaviour Of
Late-Time Afterglows Of Gamma Ray Bursts
Abstract
The cannonball (CB) model of gamma ray bursts (GRBs) predicts that the asymptotic behaviour of the spectral energy density of the X-ray afterglow of GRBs is a power-law in time and in frequency where the difference between the temporal and spectral power-law indexes, , is restricted to the values 0, 1/2 and 1. Here we report the distributions of the values , and their difference for a sample of 315 Swift GRBs. This sample includes all Swift GRBs that were detected before August 1, 2012, whose X-ray afterglow extended well beyond 1 day and the estimated error in was . The values of were extracted from the CB model fits to the entire light curves of their X-ray afterglow while the spectral index was extracted by the Swift team from the time integrated X-ray afterglow of these GRBs. We found that the distribution of the difference for these 315 Swift GRBs has three narrow peaks around 0, 1/2 and 1 whose widths are consistent with being due to the measurement errors, in agreement with the CB model prediction.
1 Introduction
A major breakthrough in the study of gamma ray bursts (GRBs) was the discovery of their X-ray afterglow by the Beppo-SAX satellite (Costa, E. et al. 1997), which led to their localization and consequently to the discovery of their longer wave-length afterglows (van Paradijs et al. 1997, Frail & Kulkarni 1997), which were predicted (Paczynski & Roads 1993, Katz 1994, Mezaros & Rees 1997) by the fireball model of GRBs (Paczynski 1986, Goodman 1986). Until the launch of the Swift satellite, the fireball model was widely accepted as the correct model of GRBs and their afterglows (see, e.g., the reviews by Meszaros 2002, Zhang & Meszaros 2004, Piran 2004). The rich data on GRBs and their afterglows obtained in recent years with the Swift and Fermi satellites complemented by data from ground-based rapid response telescopes and large follow-up telescopes, however, have challenged this prevailing view (see, e.g., Dar 2006 and the publications of Dado et al. cited in this paper and references therein; Margutti et al. 2012 and references therein).
In contrast, the cannonball model (CB) of GRBs (Dar & De Rújula 2004 and references therein) has been very successful in reproducing also the detailed light-curves of GRBs and their AGs that were measured with the Swift and Fermi satellites (see, e.g., Dado et al. 2009a,b). This success required adjustment of the free parameters of the CB model to fit the data, which could have made one wonder whether the good agreement between theory and observations was due to the flexibility of the model rather than to its validity.
The CB model, however, has been used also to predict universal properties of GRBs and their afterglows before their discovery by observations, which do not depend on free or adjustable parameters. For the prompt emission, these included the large linear polarization of the prompt gamma rays111Such evidence was reported by Coburn & Boggs 2003 (see, however, Rutledge & Fox 2004 and Wigger et al. 2004), Willis et al. 2005, McGlynn et al. 2007, Gotz et al. 2009 and Yonetoku et al. 2011. (e.g., Shaviv & Dar 1995), the rapid spectral softening that accompanied the fast decline of the prompt -ray emission (see, e.g., Dado et al. 2007 and references therein), and several correlations among GRB observables (see, e.g., Dar & De Rújula 2000, Dado & Dar 2012 and references therein) including the ’Amati relation’ (Amati et al. 2002).
As for the afterglow emission, the CB model predicted the appearance of an underlying supernova in the optical AG of relatively nearby long duration GRBs (see, e.g., Dar 1999, Dado et al. 2002, 2003 and references therein), the canonical behaviour of X-ray light-curves - the transition to a plateau phase after a fast decline with a rapid softening of the prompt emission spectral energy density (SED) that bends/breaks smoothly into an asymptotic power-law decline (e.g., Dado et al. 2002, Dar & De Rújula 2004) - before it was discovered with Swift (Nousek et al. 2006), and the chromatic behaviour of the broad-band (XUVONIR) afterglow at early time (e.g., Covino et al. 2006) that becomes achromatic well after the smooth bend/break time with roughly a universal spectral index 222This behaviour was predicted only for late-time non-flaring afterglows..
In this paper, we have used the CB model to derive another universal feature of the late-time broad band (XUVONIR) afterglow of GRBs, which does not involve adjustable parameters. Namely, we show that in the CB model the observed pectral energy density of the late-time afterglow declines with time and frequency, like where the difference between the temporal and spectral power-law indexes can have one of the values =0, 1/2 or 1. This closure relation then was tested using the 0.3-10 keV light-curves of the X-ray afterglow of 315 Swift GRBs, which were measured accurately enough well beyond 1 day with the Swift X-ray telescope (XRT). The CB model best fits to the entire available data of their X-ray afterglows were used to extract the values of their late-time temporal index , while the values of their spectral index were those inferred by the Swift team from the spectrum of the time integrated X-ray afterglow.
2 The synchrotron radiation afterglow at late time
In the CB model (see, e.g., Dar & De Rújula 2004, Dado et al. 2002, 2009a and references therein) GRBs and their afterglows are produced by the interaction of bipolar jets of highly relativistic plasmoids (CBs) of ordinary matter with the radiation and matter along their trajectory (Shaviv & Dar 1995, Dar 1998). Such jetted CBs are presumably ejected in accretion episodes on the newly formed compact stellar object in core-collapse supernova (SN) explosions (Dar et al. 1992, Dar & Plaga 1999, Dar & De Rújula 2000), in the merger of compact objects in close binary systems (Goodman et al. 1987, Shaviv & Dar 1995) and in mass accretion episodes in microquasars and phase transitions in compact stars (Dar 1998, Dado et al. 2009b).
In the CB model, the circumburst medium in front of a highly relativistic CB is completely ionized by the radiation from the CB. In the CB’s rest frame, the ions of the medium that are continuously impinging on the CB generate within it a turbulent magnetic field, whose energy density is assumed to be in approximate equipartition with that of the impinging particles, (e.g., Dado et al. 2002), where is the external baryon density and is the proton mass. The electrons that enter the CB with a relative Lorentz factor in the CB’s rest frame are Fermi accelerated there to a smoothly broken power-law distribution in with a break around and a power-law index well above it. These electrons cool rapidly by emission of synchrotron radiation (SR). This SR is isotropic in the CB’s rest frame and has a smoothly broken power-law with a characteristic break frequency , which is the typical synchrotron frequency radiated by the interstellar medium (ISM) electrons that enter the CB at time with a Lorentz factor . In the observer frame, the emitted photons are beamed into a narrow cone along the CB’s direction of motion by its highly relativistic bulk motion, their arrival times are aberrated and their energies are boosted by its bulk motion Doppler factor and redshifted by the cosmic expansion during their travel time to the observer. In particular, in the observer frame (see, e.g. Eq. (25) in Dado et al. 2009a),
| (1) |
where is its Doppler factor with being the angle between the line of sight to the CB and its direction of motion. For and , to an excellent approximation. The spectral energy density of the unabsorbed SR afterglow has the form (see, e.g., Eq. (26) in Dado et al. 2009a),
| (2) |
where the spectral index of the emitted radiation is related to the power-law index of the Fermi accelerated electrons through for and for . The photon spectral index of the unabsorbed X-ray afterglow and the photon spectral index of the emitted radiation is given by .
The intercepted ISM particles that are swept into the CB decelerates its motion. For a CB of a baryon number , a radius and an initial Lorentz factor , which propagates in an ISM of a constant density , relativistic energy-momentum conservation for plastic collisions yields the deceleration law (Dado et al. 2009b and references therein):
| (3) |
where and
As can be seen from Eqs. (2) and (3), for a constant-density ISM, the shape of the light-curve of the AG depends on only three parameters: the product , the deceleration time scale and the spectral index . As long as , and consequently , and change rather slowly with and generate the plateau phase of . For , Eq. (3) yields . Thus, for late time (), becomes , and decreases to well below the UVONIR bands (). Consequently, Eq. (2), yields a universal achromatic power-law behaviour of the late-time () broadband XUVONIR AG,
| (4) |
where . Such a canonical behviour of the X-ray afterglow of GRBs is demonstrated in Figure 1 where the 0.3-10 keV X-ray light-curve of GRB 060729 that was measured with the Swift XRT is plotted together with its CB model best fit light-curve.
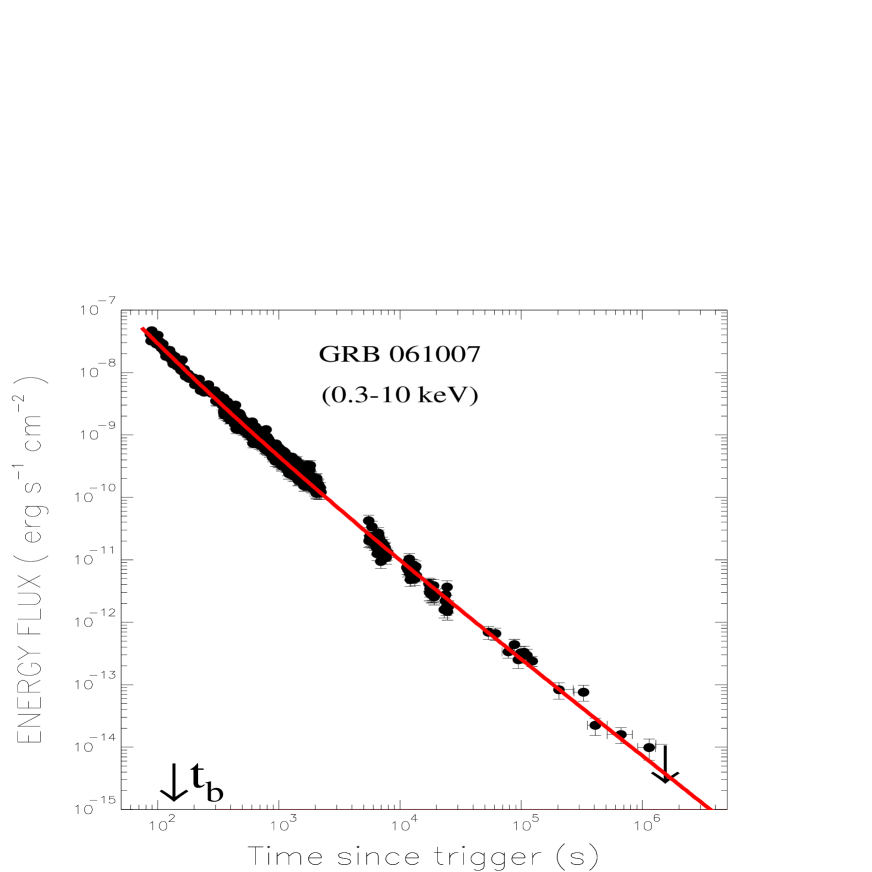
Often the break of the X-ray afterglow of very luminous GRBs is hidden under the prompt GRB emission or its fast decline phase (this happens because is rather large and yielding a rather small ). In such GRBs the ”late-time” power-law decline of the X-ray AG begins right after the fast decline of the prompt emission with the canonical late-time temporal index (Dado et al. 2008). This is demonstrated in Figure 2 where the light-curve of the X-ray afterglow of GRB 061007 that was measured with the Swift XRT is plotted together with its CB-model best fit light-curve.
Consider now a CB that encounters a wind-like density profile at . For simplicity, let us set the encounter time to be in the observer frame. As long as the CB has not yet swept in a relativistic mass comparable to its mass, and change rather slowly as a function of time and stay put at their values at . Hence, . Consequently, as long as the CB has not swept in a relativistic mass comparable to its rest mass, Eqs. (2) and (1) yield for a wind-like density profile
| (5) |
Consequently, , i.e., =1. (Dado et al. 2009a). A GRB produced near the center of an elliptical galaxy may have an X-ray afterglow with such a late-time behaviour. This is demonstrated in Figure 4 where we plotted the light-curve of the X-ray afterglow of the short GRB 060414 and its CB model best fit light-curve.
In the CB model, the prompt emission pulses are produced by different CBs which, for simplicity, are assumed to be emitted in the same direction. The time resolution during the afterglow phase is usually much longer than the time separation between the prompt GRB pulses, i.e., the separation between the CBs’ emission times, which, coupled with the initial fast expansion of the CBs and their merger due to the deceleration of the leading one in the ISM, allow us to consider them as a single blob during the afterglow phase (see e.g. Dar & De Rújula 2004), which we have so far done.
However, if the ejecta has a ”shot gun” distribution, i.e., consist of many () CBs, which are spread within a small angle angle (), then one must integrate their contribution taking into account their different viewing angles. In the limit of a uniform angular distribution of CBs within an angle (namely, an angular density ) and neglecting the spread in arrival times from different CBs at late time, the simple integration of Eq. (1) over for an on-axis observer yields the late-time SED,
| (6) |
i.e., and hence, and at late time. These results are valid also for observers slightly off-axis because the integration over viewing angle is dominated by the contribution from CBs moving near the line of sight. In Figure 5 we have plotted the 0.3-10 keV X-ray afterglow of GRB 110808A that was retrieved from the Swift/XRT light-curve repository (Evans et al. 2007, 2009) and its CB-model best fit light-curve assuming a shot-gun configuration of CBs.
All together, the CB model predicts that the late-time temporal decay of the GRB afterglow is well approximated by power-law with a power-law index that is simplly related to the spectral index of the late-time afterglow. In particular it predicts that error-free measurements of the late-time , must yield a triple-peak distribution with narrow peaks around 0, 1/2 and 1 provided that the circumburst environments are well represented by the assumed constant density ISM or a wind-like density profile.
Note, however, that while the CB model predicts a triple peak distribution of at late time, it predicts a single-peak distribution of the late-time around 1.083 and a late-time power-law decay of with a temporal index that is peaked around (e.g., Dar and De Rújula 2004, 2007).
3 Comparison with observations
Reliable and accurate values of the temporal and spectral power-law
indexes and of the late-time X-ray afterglow measured
with the Swif XRT, which are reported in the
Swift/XRT light-curve repository (Evans et al. 2007, 2009), often are
difficult to obtain because of one or more of the following reasons:
(a) The XRT measurements often run out of statistics or approach the
background level before reaches its late-time constant value.
(b) Temporal gaps in the late-time data.
(c) Flares that are superimposed on the presumably smooth afterglow
light-curves.
(d) A too simplistic model of extragalactic absorption
restricted to the host galaxy whose chemical
composition is taken to be solar and independent of redshift, that is used
to infer . Moreover, GRBs without known
redshift are treated as GRBs at redshift z = 0.
Before the launch of the Swift satellite, the knowledge of the X-ray afterglow of GRBs was incomplete and its inferred behaviour from limited and patchy data appeared to agree with the fireball model predictions (Meszaros and Rees 1997; Sari et al. 1998). After the launch of the Swift satellite it became rather clear that the observed properties and the diversity of the measured X-ray-afterglows, both at early and late times, challenge the fireball model paradigm (see, e.g., Dar 2006 and the other publications of Dado et al. cited in the bibliography, and the references therein). This led to empirical parametrizations of AG light-curves such as smoothly broken power-laws (e.g., Beuermann et al. 1999) exponential to power-law functions (e.g., Willingale et al. 2007), and smoothly broken segmented power-laws (e.g., Margutti et al. 2012), which have never been derived from an underlying physical model. In most cases it was possible to fit reasonably well the observational data by introducing sufficient number of free adjustable parameters. However, because of difficulties (a)-(d) and the scarcity of late-time data it was not clear whether the extrapolation of these fits to late times yields reliable values of the late-time (asymptotic) .
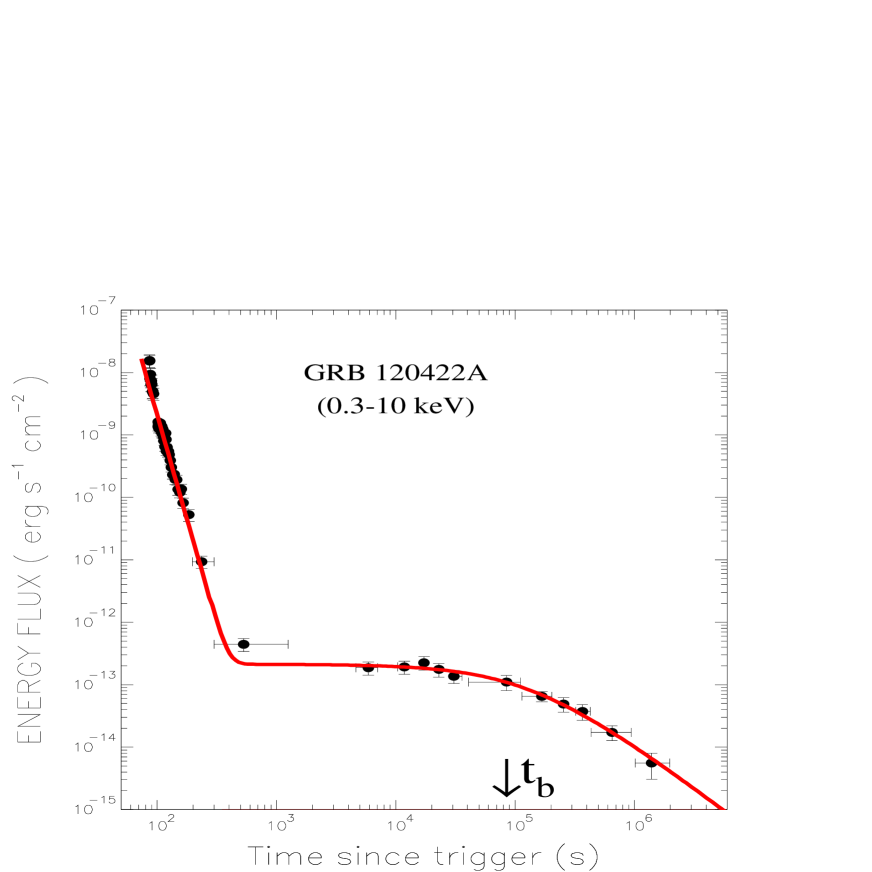
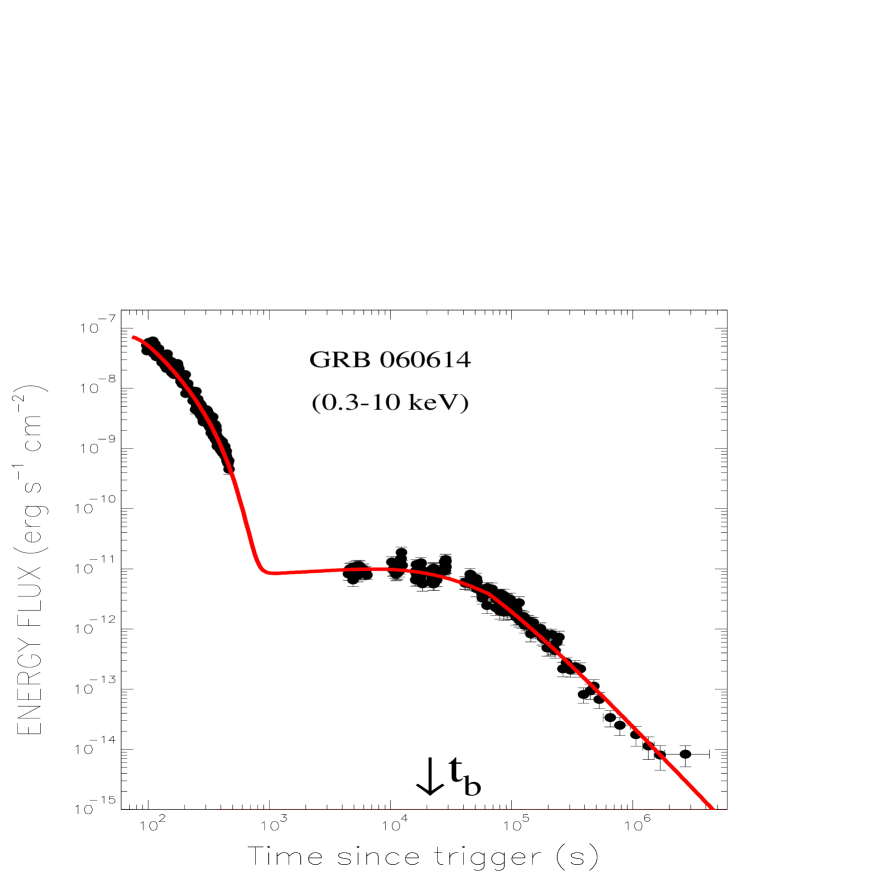
In contrast, the CB model light-curves summarized in Eqs. (1)-(2), which were derived in fair approximations from the underlying assumptions of the CB model, were shown to describe very well the observed X-ray light-curves of the X-ray AGs of a large sample (over 150) of Swift GRBs with known redshift, including those with superimposed early-time and late- time flares (see, e.g., Dado et al. 2009a,b; Dado and Dar 2010 and references therein). In particular, their underlying smooth component was fitted very well by Eqs. (1)-(2) only with three adjustable parameters, , and and the properly chosen circumburst environment (a constant density or a wind-like density profile). This is demonstrated in Figures 1-6.
Thus, in order to avoid difficulties (a)-(d) and empirical parametrizations of the X-ray AG, we have extracted the late-time temporal slope from the asymptotic power-law behaviour as given by Eqs. (4)-(6) of the cannonball model fits to the entire X-ray light-curve Moreover, since the late-time behaviour of the X-ray AG is independent of redshift, we have extended our fits to all the 315 X-ray light-curves that were reported in the Swift/XRT light-curve repository (Evans et al. 2007, 2009) before August 1, 2012, with or without known redshift, whose measured 0.3-10 keV X-ray AG extended beyond 1 day and the reported error in their inferred spectral index is . The typical error in the values of obtained from the CB model fits to the entire 0.3-10 keV light-curve of the X-ray AG of the Swift GRBs was much smaller than the typical error in the inferred value of that was reported in the Swift/XRT light-curve repository (Evans et al. 2007,2009).
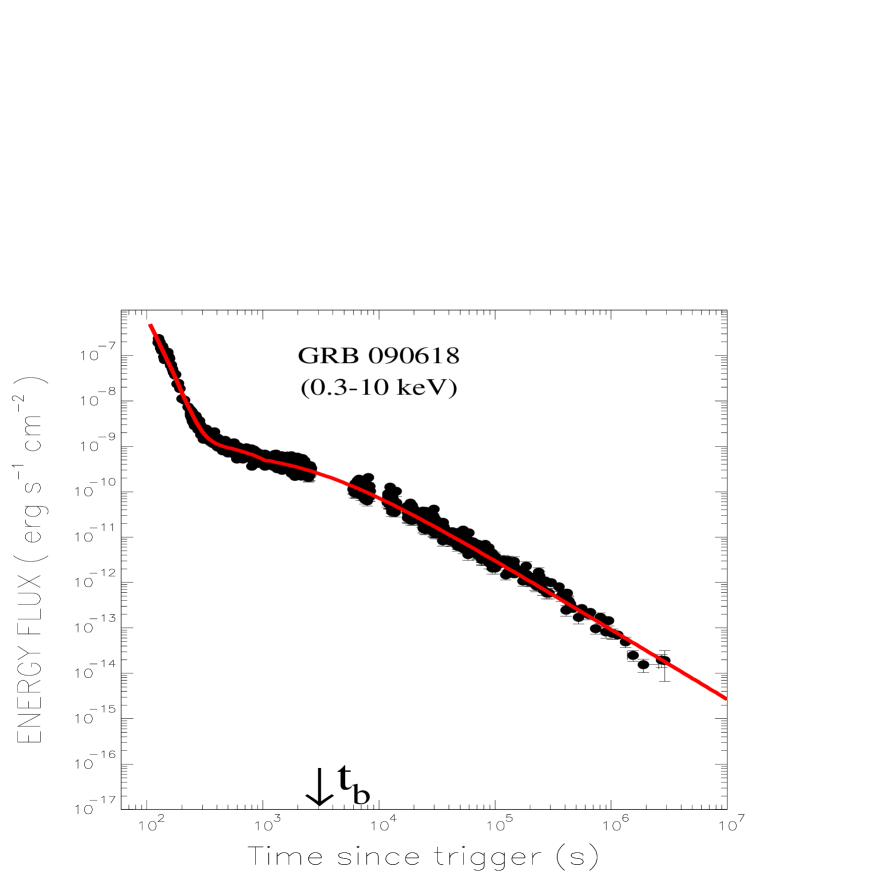
We caution that the values of the late-time that were obtained from the CB model best fit light-curves of the entire X-ray afterglow may differ significantly from those obtained from empirical parametrizations of the light-curves and arbitrary selection of time intervals. For instance, the CB model best fit light-curve of the smooth 0.3-10 keV light-curve of the X-ray afterglow of GRB 090618 that is shown in Figure 6, yielded , s and i.e., a late-time ( for dof=1301) while a smoothly broken power-law (Beuermann et al. 1999) fit yields , a break time d and a late-time (). The best fit spectral index of the unabsorbed 0.3-10 keV spectrum of the afterglow ( s) is . The CB model prediction is consistent with the value inferred from the CB model best fit light-curve of the 0.3-10 keV X-ray AG of GRB 090618 reported in the Swift/XRT light-curve repository (Evans et al. 2007, 2009), but is inconsistent with the value inferred from the smoothly broken power-law parametrization of the AG.
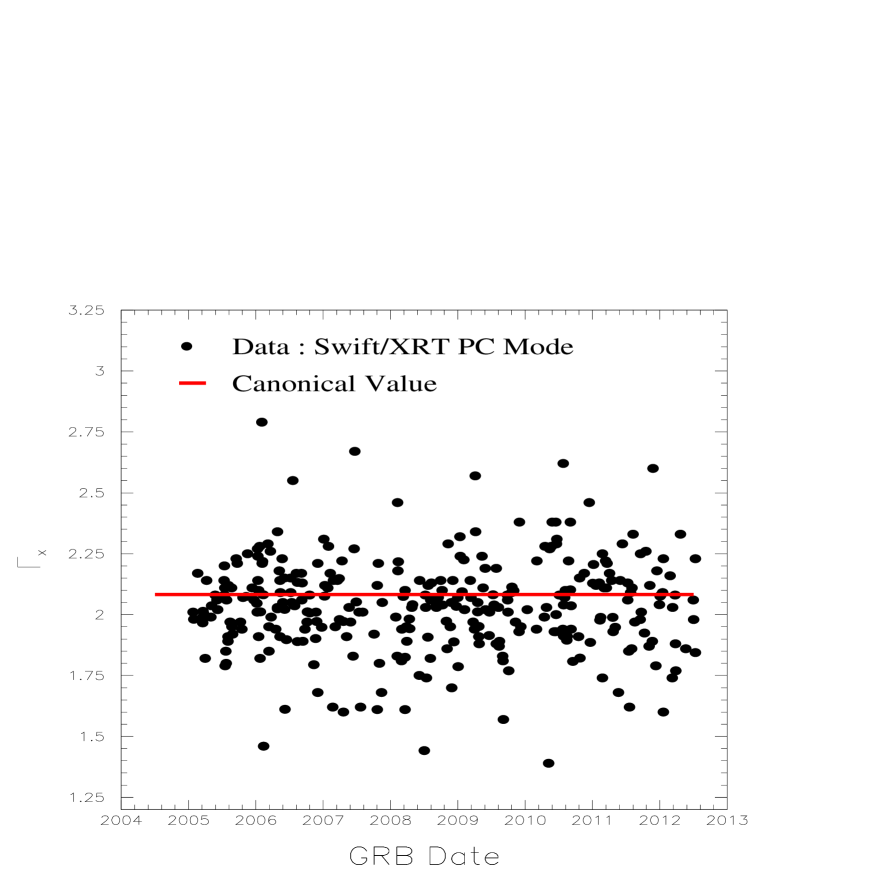
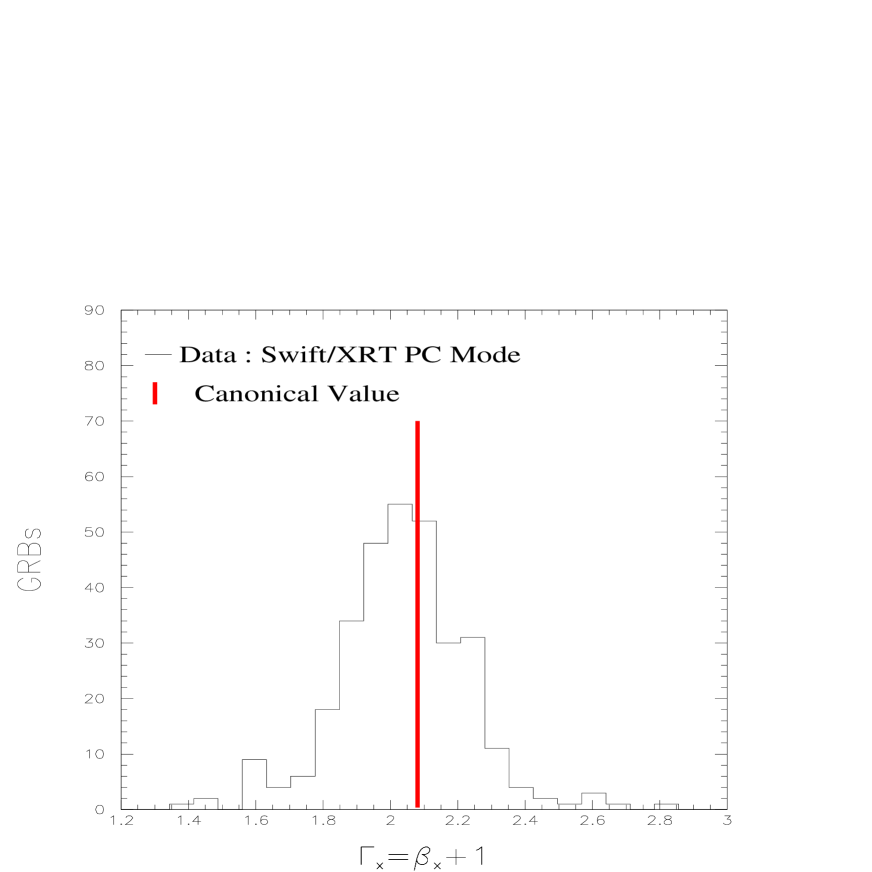
In Figure 7 we have plotted the values of of the time-integrated 0.3-10 keV X-ray AG of the 315 Swift GRBs, which were retrieved from the Swift/XRT light-curve repository. Their distribution is shown in Figure 8. As can be seen from Figures 7 and 8, their distribution peaks around the canonical value of the cannonball model, which is represented by the horizontal and vertical lines, respectively, in Figures 7 and 8.
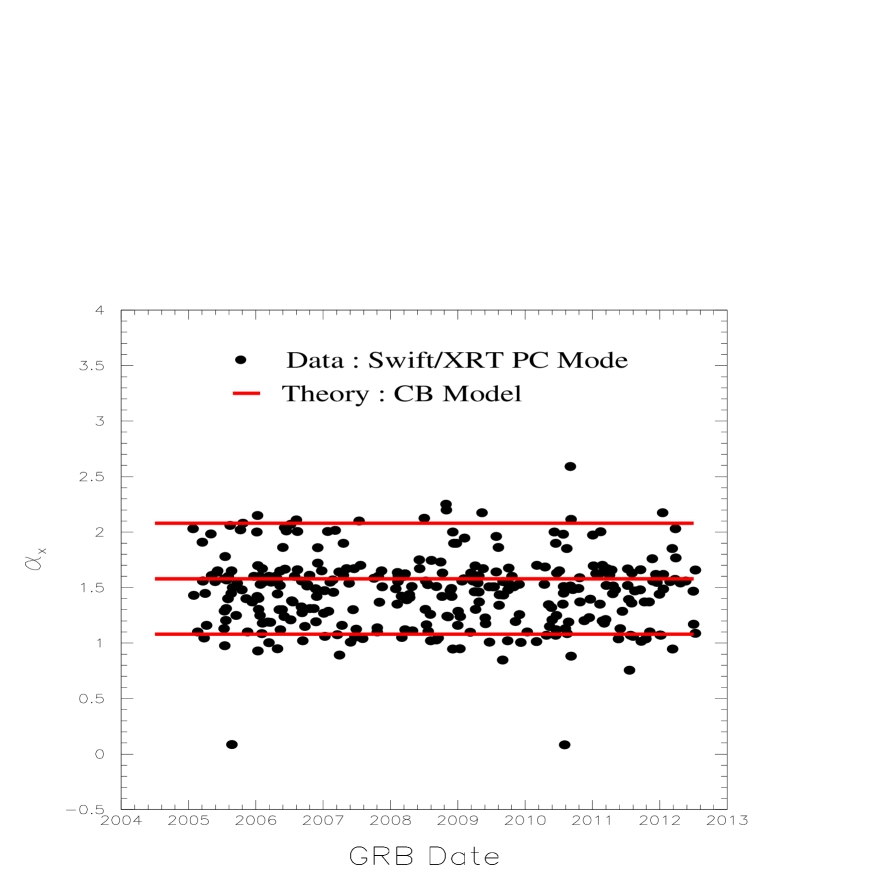
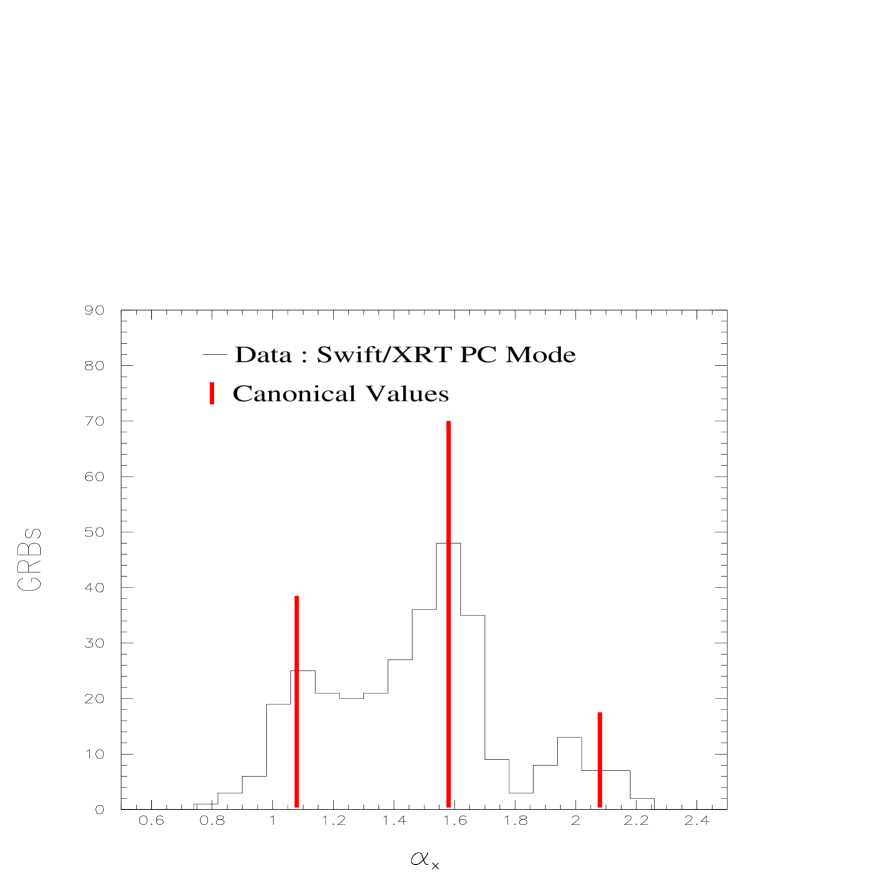
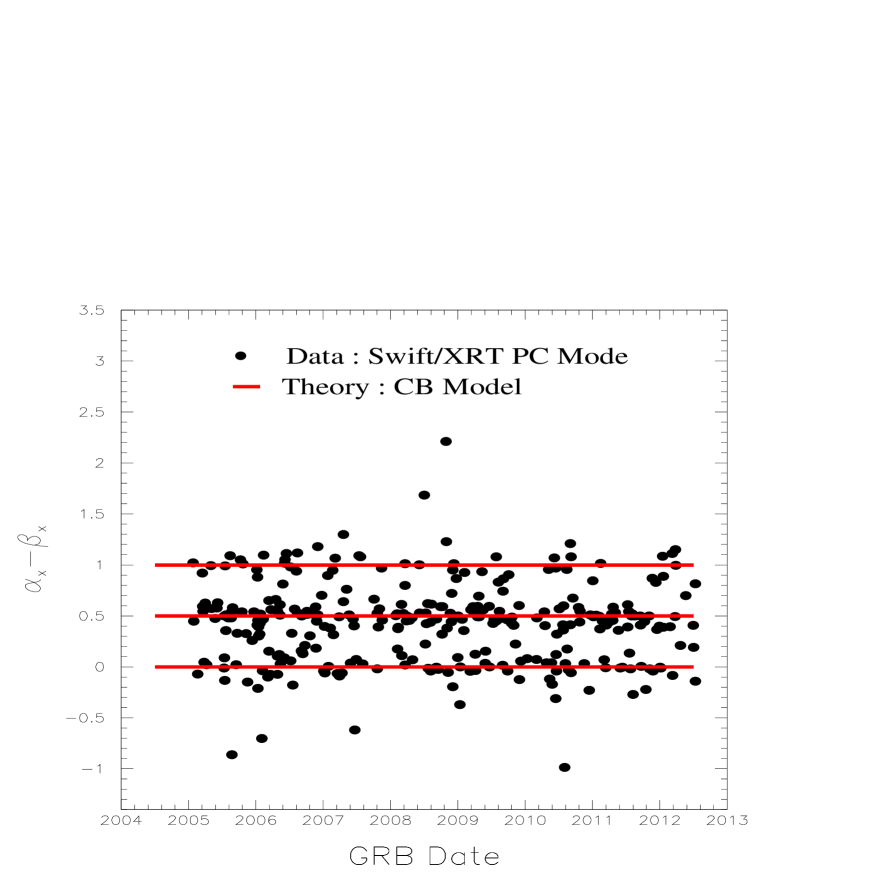
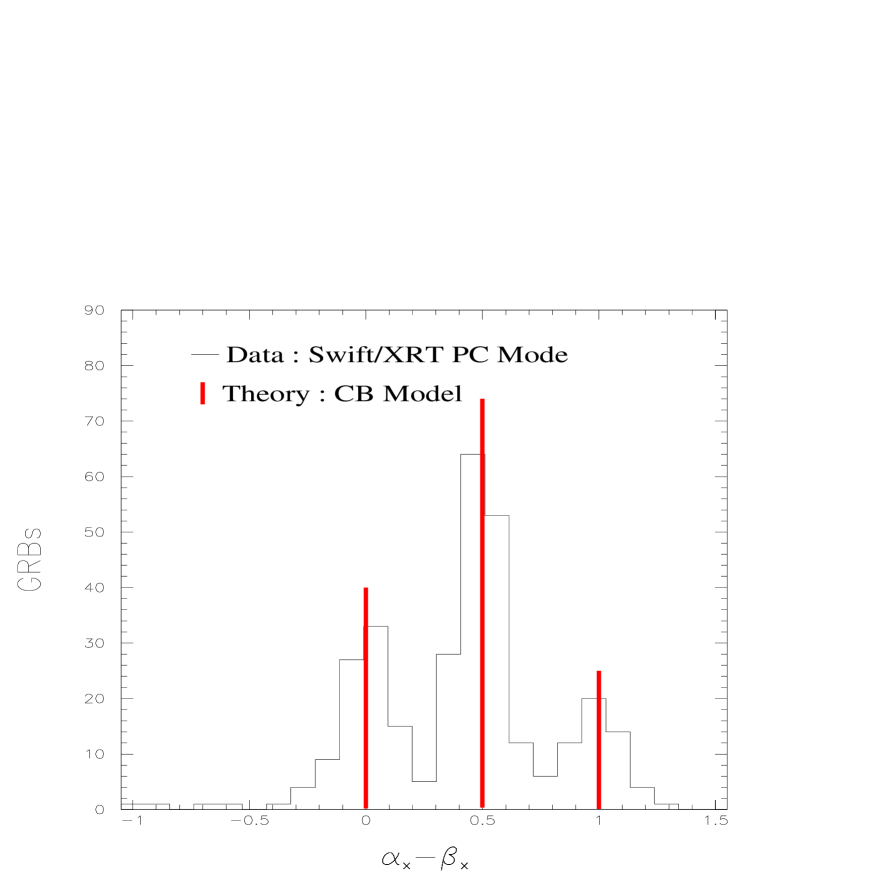
In Figure 9 we have plotted the values of late-time slope of the X-ray AG of the 315 GRBs plotted in Figures 7 and 8 that were obtained from the CB model best fit light-curves of the 0.3-10 keV X-ray AGs observed with the Swift XRT. These slopes seem to cluster around the canonical values 2.1, 1.6 and 1 of the CB model as is indicated by their distribution, which is plotted in Figure 10. This clustering is much more evident in Figures 11 and 12 where the values of and their distribution are shown for the 315 GRBs plotted in Figure 7. The horizontal and vertical lines in Figures 11 and 12, respectively, represent the CB model expectation , 1/2, or 1 for error-free measurements.
4 Conclusion
: The spectral energy density of the X-ray afterglow of 315 ordinary GRBs detected before August 1, 2012, which have a late-time X-ray AG that was well measured with the Swift/XRT, is well described by a simple power-law in time and frequency, . Their X-ray afterglows are well described by the CB model (e.g., Dado et al. 2009a). The distribution of the difference between the late-time temporal and spectral power-law indexes extracted from their CB model fits has a triple peak structure with peaks around 0, 1/2 and 1 of full widths at half maximum consistent with the measurement errors while the distribution of has only a single peak around 1.08. This behaviour is in good agreement with the CB-model prediction that the difference between the late-time temporal and spectral power-law indexes of GRBs is restricted to the values 0, 1/2 or 1, while such a behaviour challenges alternative GRB models.
Acknowledgement: The authors would like to thank an anonymous referee for useful comments and suggestions.
References
- Amati et al. (2002) Amati, L., et al. 2002, A&A 390, 81
- Beuermann et al. (1999) Beuermann, K., et al. 1999, A&A, 352, L26
- Cano et al. (2011) Cano, Z., et al. 2011, MNRAS, 413, 669
- Coburn and Boggs (2003) Coburn, W. & Boggs, S. E. 2003, Nature, 423, 415
- Costa et al. (1997) Costa, E., et al 1997, Nature, 387, 783
- Covino et al. (2006) Covino, S., et al. 2006, Nuovo Cimento, 121B, 1171
- Dado and Dar (2012) Dado, S., & Dar, A. 2012, arXiv:1203.5886
- Dado et al. (2002) Dado, S., Dar, A. & De Rújula, A. 2002, A&A, 388, 1079
- Dado et al. (2003) Dado, S., Dar, A. & De Rújula, A. 2003, ApJ, 594, L89 (arXiv:astro-ph/0304106)
- Dado et al. (2007) Dado, S., Dar, A. & De Rújula, A. 2007, ApJ, 663, 400
- Dado et al. (2008) Dado, S., Dar, A.& De Rujula, A. 2008, ApJ, 680, 517
- Dado et al. (2009a) Dado, S., Dar, A. & De Rújula, A. 2009a, ApJ, 696, 994
- Dado et al. (2009b) Dado, S., Dar, A. & De Rújula, A. 2009b, ApJ, 693, 311
- Dar (1998) Dar, A. 1998, ApJ, 500, L93
- Dar (1999) Dar, A. 1999, GCN Report 346
- Dar (2006) Dar, A., 2006, Chin. J. Astron. Astrophys. 6, 323, 206 (arXiv:astro-ph/0511622
- Dar and De Rújula (2000) Dar, A., & De Rújula, A. 2000, arXiv:astro-ph/0008474
- Dar and De Rújula (2004) Dar, A. & De Rújula, A. 2004, Phys. Rep. 405, 203
- Dar and De Rújula (2008) Dar, A. & De Rújula, A. 2008, Phys. Rep. 466, 179
- Dar et al. (1992) Dar, A., et al. 1992, ApJ, 388, 164
- Dar and Plaga (1999) Dar, A. & Plaga, R. 1999, A&A, 349, 259
- Evans et al. (2007) Evans P.A., et al., 2007, A&A, 469, 379
- Evans et al. (2009) Evans, P.A. et al. 2009, MNRAS, 397, 1177
- Frail and Kulkarni (1997) Frail, D. A., & Kulkarni, S. R. 1997, IAU Circ. No. 6662
- Goodman (1986) Goodman, J., 1986 ApJ, 308, L47
- Goodman et al. (1987) Goodman, J., Dar, A. & Nussinov, S. 1987, ApJ, 314, L7
- Gotz et al. (2009) Gotz, D., et al., 2009, ApJ, 695, L208
- Katz (1994) Katz, J., 1994, ApJ, 432, L107
- Margutti et al. (2012) Margutti, R., et al. 2012, arXiv:1203.1059
- McGlyn et al. (2007) McGlynn, S., et al. 2007, A&A, 466, 895
- Meszaros (2002) Meszaros, P. 2002, Ann. Rev. ARAA, 40, 137
- Meszaros and Rees (1997) Meszaros, P. & Rees, M. J. 1997, ApJ, 476, 232
- Nousek et al. (2005) Nousek, J. A., et al. 2006, ApJ, 642, 389
- Pacynski (1986) Paczynski, B. 1986, ApJ, 308, L43
- Pacynski and Roads (1993) Paczynski, B. & Rhoads, J. E. (1993), ApJ, 418, L5
- Piran (2004) Piran, T. 2004, Reviews of Modern Physics, 76, 1143
- Rutledge and Fox (2004) Rutledge, R. E. & Fox, D. B. 2004, MNRAS, 350, 1272
- Saqri et al. (1998) Sari R., Piran T. & Narayan R. 1998, ApJ, 497, L17
- Shaviv & Dar (1995) Shaviv, N. J. & Dar, A. 1995, ApJ, 447, 863
- van Paradijs et al. (1997) van Paradijs, J. et al. 1997, Nature 386, 686
- Wigger et al. (2004) Wigger, C., et al. 2004, ApJ, 613, 1088
- Willingale et al. (2007) Willingale R., et al. 2007, ApJ, 662, 1093
- Willis et al. (2005) Willis, D. R., et al. 2005, A&A, 439, 245
- Yonetoku et al. (2011) Yonetoku, D., et al. 2011, ApJ, 743, L30
- Zhang and Meszaros (2004) Zhang, B., & Meszaros, P. 2004, Int. J. Mod. Phys. A, 19, 2385
| GRB | [s] | [s] | , | ||||
|---|---|---|---|---|---|---|---|
| 060729 | 310 | 1.723 | 32876 | 2.096 | 1.39 | 1.548 | |
| 061007 | 40 | 0.908 | 135 | 2.052 | 1.00 | 1.526 | |
| 120422A | 276 | 1.203 | 84256 | 1.958 | 0.69 | 1.458 | |
| 060614 | 1.98 | 1.22 | 1.98 | ||||
| 110808A | 100 | Shotgun | 17692 | 2.195 | 1.04 | 1.09 | |
| 090618 | 310 | 0.708 | 2953 | 2.083 | 1.06 | 1.54 |