Solid flow drives surface nanopatterning by ion-beam irradiation
Abstract
Ion Beam Sputtering (IBS) is known to produce surface nanopatterns over macroscopic areas on a wide range of materials. However, in spite of the technological potential of this route to nanostructuring, the physical process by which these surfaces self-organize remains poorly understood. We have performed detailed experiments of IBS on Si substrates that validate dynamical and morphological predictions from a hydrodynamic description of the phenomenon. Our results elucidate flow of a nanoscopically thin and highly viscous surface layer, driven by the stress created by the ion-beam, as a description of the system. This type of slow relaxation is akin to flow of macroscopic solids like glaciers or lead pipes, that is driven by defect dynamics.
pacs:
79.20.Rf, 68.35.Ct, 81.16.Rf, 05.45.-aI Introduction
In the paper that historically coined the word “Nanotechnology” Taniguchi (1974), erosion of solid targets through ion-beam sputtering (IBS) was already put forward as the most promising technique to structure the surface of a wide range of materials. Indeed, for ion energies ranging from 100 eV to 100 keV, the procedure has shown a remarkable capability Facsko et al. (1999) to produce ordered nano-scale sized patterns (mostly ripples and dots) over large areas (up to tens of cm2) for a wide range of targets, including semiconductors, metals, and insulators Chan and Chason (2007); Muñoz-García et al. (2009). However, despite its large potential for technological applications Smirnov et al. (2003), the promise of IBS as a fully controlled method to tailor patterns with custom designed properties has turned elusive. This is not only due to the challenges that description of the dynamics of surfaces in times of order 1 s pose to multi-scale modeling Norris et al. (2011) when microscopic events take place in times of order 1 ps. Rather, it originates in the lack of a basic understanding of the physical nature of the mechanism that controls the pattern formation.
Classically, since the seminal work by Bradley and Harper (BH) Bradley and Harper (1988) the interplay between sputtering and surface diffusion had been identified as the key mechanism leading to pattern formation in IBS. Thus, a characteristic length scale would be selected Cross and Greenside (2009) from the competition between the morphologically unstable dependence of the sputtering yield with local surface curvature, and thermal surface diffusion that smooths out surface features Mullins (1957). However, thus far only partial qualitative agreement had been reached between this classical description and experiments Chan and Chason (2007). Only after the recent realization of the non-trivial role of impurities in the emergence of the pattern Ozaydin et al. (2005); Bradley and Shipman (2010) has the need arisen to dispose of the BH mechanism for the simplest case of monoelemental semiconductor targets like silicon, that are amorphized by the ion beam Gnaser (1999), as in recent experiments on Ar+ irradiation Madi et al. (2008); Macko et al. (2010). For instance, one of the most direct implications of the BH picture, that ripple formation should take place for any incidence angle between the ion beam and the normal to the uneroded target, has been experimentally disproved, there being a critical angle such that ripples appear only for . Incidentally, for ion energies between 10 and 40 keV, higher than in Madi et al. (2008); Macko et al. (2010), this fact was already noted by Carter and Vishnyakov (CV) Carter and Vishnyakov (1996), who explained it phenomenologically via a smoothing effect of momentum transfer from the ions to the target atoms.
To date, two main non-BH-type mechanisms have been proposed to explain formation or absence of patterns in IBS of monoelemental semiconductors Cuerno et al. (2011). Namely, mass redistribution Moseler et al. (2005); Madi et al. (2011); Norris et al. (2011); Hossain et al. (2011) and ion induced solid flow Castro and Cuerno (2012). The former employs results from Molecular Dynamics (MD) simulations in order to rephrase the CV effect as the influence of material (rather than momentum) displacement due to the beam, on the surface morphology. The latter proceeds, rather, through a continuum description of the surface flow that is driven by the surface confined stress due to the accumulated damage produced by irradiation. Remarkably, both descriptions agree with experiments with respect to e.g. the value of and the dependence of the pattern wavelength on Cuerno et al. (2011). Note that, as far as physical mechanisms are concerned, MD simulations Moseler et al. (2005); Madi et al. (2011); Norris et al. (2011); Hossain et al. (2011) are fundamentally limited in the IBS context, since they cannot probe the required macroscopic time scales at which non-trivial surface evolution takes place. This limitation has required e.g. the ad-hoc use of surface confined viscous flow Umbach et al. (2001) in Madi et al. (2011); Norris et al. (2011), in order to obtain the correct time scales for the description of the dynamics. What remains to be done is, rather, to prove if a physical description that incorporates viscous flow from the outset is indeed able to predict properties of the pattern that can be experimentally tested.
In this paper, we perform IBS experiments of Si in order to validate specific predictions from the hydrodynamic description put forward in Castro and Cuerno (2012), that stem from the assumption that the main driving field in the process is the ion-induced residual stress that builds up in the flowing layer. Consistency between experiments and theoretical predictions thus allows us to elucidate the physical mechanism through which pattern formation occurs in these non-equilibrium nanoscopic systems.
II Predictions of the theory
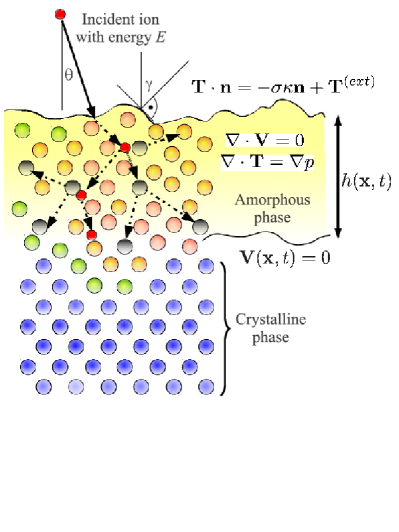
The main idea of the solid flow description of IBS Castro and Cuerno (2012) is that, as a consequence of the impact of the ions and the subsequent release of energy within the target, defects are created inside the material. These events occur in a few picoseconds after the impact. Relaxation of some defects leads to sputtering of target atoms, but also to the generation of a residual stress that is confined to a thin amorphous layer that builds up beneath the surface Kalyanasundaram et al. (2006) and reaches a stationary thickness. This ion-induced (compressive) stress is characterized by a slow time relaxation which involves a highly viscous flow of the amorphous layer, that will be assumed to be incompressible, in a nanometric analogue of the motion of glaciers or lead pipes Doake and Wolff (1985). The effect of these slow events can be cast into a hydrodynamical description Oron et al. (1997) of the form (see Fig. 1 for a schematic description of the system):
| (1) | |||||
| (2) | |||||
| (3) | |||||
| (4) |
where and are fluid velocity and pressure, is the stress tensor inside the amorphous layer, () is the unitary vector locally normal (tangent) to the interface, is the interface surface tension and its curvature. Equations (2) and (3) are evaluated at the surface and Eq. (4) at the amorphous-crystalline () interface Castro and Cuerno (2012). In our range of interest for ion energies (say, 300 to 1000 eV), the ripple wavelength (tens of nm) is much larger than the thickness of the amorphous layer (a few nm) Chan and Chason (2007); Muñoz-García et al. (2009). Introducing this fact into the analysis of Eqs. (1)-(4) amounts to taking the so-called shallow-water limit Oron et al. (1997). Using further a linear approximation in perturbations around a flat target profile, we obtain a real part for the linear dispersion relation (namely, the rate at which periodic perturbations with wave vector grow or decay Cross and Greenside (2009)) that is given by
| (5) |
where , is the average thickness of the amorphous layer, and is its (ion-induced) viscosity. The parameter can be understood as the gradient of residual stress induced by the ions across the amorphous layer, whose angular dependence is described through the function . Since this angular function needs to be prescribed, we take as the simplest geometrically motivated choice that shows good agreement Castro and Cuerno (2012) with previous experiments, as well as with the ones presented here.
Given and , we can extract testable predictions from the theory through the value of the ripple wavelength, , occuring to linear approximation of Eqs. (1)-(4),
| (6) |
The first prediction has to do with the angular dependence of the patterns. For [hence, ], we find a value for the critical angle . Moreover, this value does not depend on the ion energy, in good agreement with X-ray experiments Madi et al. (2011) and in contrast with an energy-dependent critical angle from MD simulations in Norris et al. (2011), from at eV to at eV 111This critical angle at can be also obtained Castro and Cuerno (2012) without assuming a specific functional form for and assuming that, instead of a body force created by the ion, there is an elastic stress confined at the surface for an incompressible material through in Eq. (3).. Note, experiments at low energies (e.g., eV) are difficult to perform reliably with a small dispersion.
Thus far, the analytical description is purely kinematic, in the sense that we have not made explicit which is the physical mechanism behind the stress. Experimentally, local measurements of stress in a nanoscopic amorphous layer is problematic if not unfeasible. Thus, a natural procedure is to detail the nature of stress generation in the theoretical description, relating it with relevant physical parameters of the experiment, such as average ion energy, , or flux, , and obtain testable predictions from such an assumption. In Davis (1993) a simple (experimentally validated) model was proposed based on knock-on implantation and stress relaxation by defect migration to the surface. This leads to a dependence of the stress that builds up throughout the amorphous layer, , on ion energy of the form
| (7) |
Here, and are the material Young’s and Poisson’s moduli, and , are other material-dependent constants (related to properties like the binding energy). From Eq. (7) it follows that, for low energies, , while for large energies (which depend on , but typically eV), . We also need a prescription for the dependence of the amorphous layer thickness on energy. It is customary to assume a power law dependence of the form , where is assumed to be in the range and can be determined approximately from TRIM simulations Ziberi et al. (2005). Thus, for a fixed angle, , and using (6) we find
| (8) |
with , namely, the dependence of the ripple wavelength with energy is roughly linear.
Another prediction can be obtained from Eq. (5), that allows to find the characteristic scale for the exponential growth of the pattern amplitude occurring at short times during with linear approximation holds. Thus,
| (9) |
with , , and we have used that Umbach et al. (2001). Notice that e.g. the surface roughness, , grows in the linear unstable regime as . This exponential behavior will eventually be interrupted by nonlinear mechanisms (coming, for instance, from stress Castro and Cuerno (2012) or from purely erosive effects Castro et al. (2005)) at sufficiently long times. Hence, the time duration of the validity of the linear approximation is also controlled by .
III Experiments
Si(100) targets (380 m thick, p-type, Ohm cm) were sputtered with Ar+ ions under different incidence angles within the eV energy range. The angle was adjusted by axial rotation of the sample in front of the ion gun with an overall resolution of . The ions were extracted from a commercial cm beam-diameter Kaufman-type ion gun (VEECO) located cm away from the target. In order to avoid metal contamination on the surface during irradiation, the sample holder was covered with a sacrificial Si wafer and the sample was attached to it with a double sided conductive vacuum tape. Prior to the process, the current density at the sample position in the plane parallel to the source grids () was set to A/cm2 with a Faraday cup located on a movable shutter that prevents, additionally, unwanted irradiation of the sample. The surface morphology of the irradiated surfaces was imaged ex-situ with a Nanoscope IIIa equipment (Bruker) operating in intermittent contact mode and using silicon cantilevers (Bruker) with a nominal radius of curvature of nm.
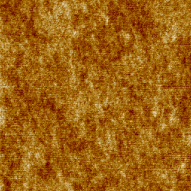
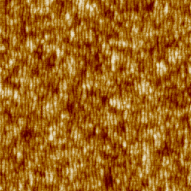
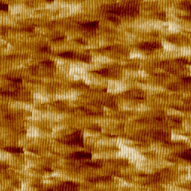
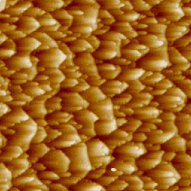
In Fig. 2 we show four AFM micrographs of Si (100) surfaces bombarded at eV and different incidence angles. The surface does not contain any visible pattern for (or for smaller angles, not shown). On the other hand, as seen in Fig. 3a, roughness values increase significantly above this critical angle Macko et al. (2010).
 |
 |
| (a) | (b) |
 |
 |
| (c) | (d) |
 |
|
| (a) | |
 |
 |
| (b) | (c) |
In order to compare experimental data with the model predictions derived above, we note that the linear regime is expected to have a duration that changes with experimental conditions, see Eq. (9). For instance, it is expected to last shorter for increasing angles of incidence (in a form reminiscent of critical slowing down for continuous phase transitions Cross and Greenside (2009); Cuerno et al. (2011)). Actually, Eq. (9) allows us to control the experimental times, in order to guarantee that the system is truly evolving within linear regime, given a fixed reference experiment in which such state can be unambiguously assessed. Thus, given a pair of angle-energy reference values, , we can extrapolate the value of for any other pair through
| (10) |
where is the flux used in a particular experiment at energy and angle , with being the flux at normal incidence. In our case, we choose and eV. Thus, from Eq. (10) we can extract the experimental times for different angles or energies which we define as intrinsic time scale, namely, the time at which experiments at different angles and/or energies are within linear regime.
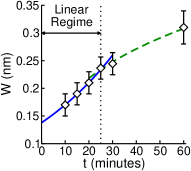
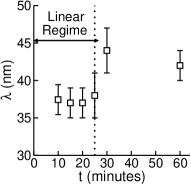
In Fig. 3 we show how the surface roughness depends on the conditions under which the experiments have been performed. Thus, we emphasize that doing the experiments at constant time (or fluence) may produce surfaces which are described by different regimes (linear or non-linear), depending on the value of . The morphologies in Fig. 2 correspond to the times obtained at constant dose in Fig. 3 where typical nonlinear motifs, like facets, are recognized, specially in Figs. 2c-d. Note how the onset of these effects correlates for different observables Muñoz-García et al. (2009) (power law growth of , coarsening of ) in Figs. 3b,c.
 |
 |
| (a) | (b) |
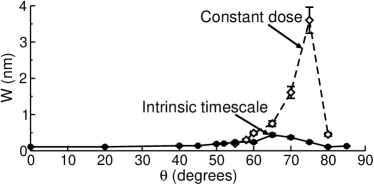
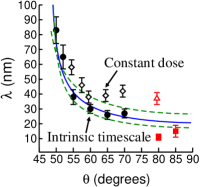
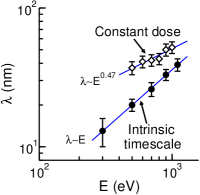
In addition, in Fig. 4a we show the dependence of the ripple wavelength on the incidence angle. The empty symbols stand for experiments performed at constant dose and the full ones are for experiments at the intrinsic timescale defined in Eq. (9) that guarantees linear behavior. The blue solid line corresponds to a fit to Eq. (6) using , and the green dashed lines are a similar fit taking into account a uncertainty in the experimental measurement of 222The fit can be further improved (not shown) if one also fits the critical angle as . These fits confirm the validity of Eq. (6). Moreover, in Fig. 4b we show the dependence of the wavelength on the ion energy. Again, the prediction of the theory that scales almost linearly with ion energy fits nicely, provided the experiments are performed at the intrinsic timescale, and not at (the customary) constant dose experiments. In general, agreement is not reached for the latter since those data points correspond to the nonlinear regime that sets in for times longer than the scale (9), at which predictions made from linear approximation break down. This fact proves the self-consistency of our present analysis and stresses the predictive power of the solid flow theory.
IV Discussion and conclusions
We have presented theoretical predictions based on ion induced residual stress and viscous flow as the main physical mechanism driving surface nanopattern formation by IBS, together with the experimental validation of such predictions. These results allow us to extract important consequences. Note that the predictions in terms of ion energy originate from the physical model in Davis (1993), in which direct knock-on implantation is assumed to produce stress that can be relaxed by defect migration to the free surface of the amorphous layer. When taken as an input of our hydrodynamic framework, this allows us to provide the scaling of different observables with energy. Thus, the ripple wavelength is predicted to scale roughly linearly with , in marked contrast with the classical scaling from BH theory Bradley and Harper (1988); Chan and Chason (2007); Muñoz-García et al. (2009). Other theoretical descriptions of the problem, both based on effective interface equations (see Cuerno et al. (2011) for an overview) or on atomistic simulations combined with multi-scale approximations, are based on mere superposition of mechanisms that actually operate at different time scales, rather than on a single framework that leads to a dynamic description as is the case here. As an example, in the original BH theory sputtering takes place in a few ps, while surface diffusion occurs in ns. One could actually expect contributions from sputtering to surface-confined transport Umbach et al. (2001); Castro et al. (2005), but adding them together ad-hoc, as is natural to a first approximation, will necessarily overlook them.
Finally, an important part of our analysis relates to the dependence of the linear or nonlinear behavior with experimental parameters and observation time. Thus, an essential requirement for experimental reproducibility and meaningful comparison with theory is to make sure that measurements made for different conditions (e.g. energy, angle, etc.) correspond to the proper dynamical regime. We expect that clarification of the physical basis of IBS allows to enhance experimental control over the technique, that finally brings it up to the well-founded high expectations expressed almost 40 years ago Taniguchi (1974).
Acknowledgements.
This work has been partially supported by grants FIS2009-12964-C05-01, FIS2009-12964-C05-03, FIS2009-12964-C05-04, and CSD2008-00023 (MICINN, Spain). J. M.-G. is supported by the Spanish MEC through the Juan de la Cierva program.References
- Taniguchi (1974) N. Taniguchi, in Proc. Intl. Conf. on Production Engineering (ICPE) (1974).
- Facsko et al. (1999) S. Facsko, T. Dekorsy, C. Koerdt, C. Trappe, H. Kurz, A. Vogt, and H. L. Hartnagel, Science 285, 1551 (1999).
- Chan and Chason (2007) W. L. Chan and E. Chason, J. Appl. Phys. 101, 121301 (2007).
- Muñoz-García et al. (2009) J. Muñoz-García, L. Vázquez, R. Cuerno, J. A. Sánchez-García, M. Castro, and R. Gago, in Toward Functional Nanomaterials, edited by Z. Wang (Springer, New York, 2009).
- Smirnov et al. (2003) V. K. Smirnov, D. S. Kibalov, O. M. Orlov, and V. V. Graboshnikov, Nanotechnology 14, 709 (2003).
- Norris et al. (2011) S. A. Norris, J. Samela, L. Bukonte, M. Backman, F. Djurabekova, K. Nordlund, C. S. Madi, M. P. Brenner, and M. J. Aziz, Nat. Commun. 2, 276 (2011).
- Bradley and Harper (1988) R. Bradley and J. Harper, J. Vac. Sci. Technol. A 6, 2390 (1988).
- Cross and Greenside (2009) M. Cross and H. Greenside, Pattern Formation and Dynamics in Nonequilibrium Systems (Cambridge University Press, Cambridge, England, 2009).
- Mullins (1957) W. W. Mullins, J. Appl. Phys. 28, 333 (1957).
- Ozaydin et al. (2005) G. Ozaydin, A. S. Özcan, Y. Wang, F. Ludwig, H. Zhou, R. L. Headrick, and D. P. Siddons, Appl. Phys. Lett. 87, 163104 (2005).
- Bradley and Shipman (2010) R. M. Bradley and P. D. Shipman, Phys. Rev. Lett. 105, 145501 (2010).
- Gnaser (1999) H. Gnaser, Low Energy Ion Irradiation of Solid Surfaces (Springer-Verlag New York, Inc, 1999).
- Madi et al. (2008) C. Madi, B. Davidovitch, H. George, S. Norris, M. Brenner, and M. Aziz, Phys. Rev. Lett. 101, 246102 (2008).
- Macko et al. (2010) S. Macko, F. Frost, B. Ziberi, D. F. Förster, and T. Michely, Nanotechnol. 21, 085301 (2010).
- Carter and Vishnyakov (1996) G. Carter and V. Vishnyakov, Phys. Rev. B 54, 17647 (1996).
- Cuerno et al. (2011) R. Cuerno, M. Castro, J. Muñoz-García, R. Gago, and L. Vázquez, Nucl. Instr. Meth. Phys. Res. B 269, 894 (2011).
- Moseler et al. (2005) M. Moseler, P. Gumbsch, C. Casiraghi, A. C. Ferrari, and J. Robertson, Science 309, 1545 (2005).
- Madi et al. (2011) C. Madi, E. Anzenberg, K. Ludwig Jr, and M. Aziz, Phys. Rev. Lett. 106, 66101 (2011).
- Hossain et al. (2011) M. Z. Hossain, K. Das, J. B. Freund, and H. T. Johnson, Appl. Phys. Lett. 99, 151913 (2011).
- Castro and Cuerno (2012) M. Castro and R. Cuerno, Appl. Surf. Sci. 258, 4171 (2012).
- Umbach et al. (2001) C. C. Umbach, R. L. Headrick, and K.-C. Chan, Phys. Rev. Lett. 87, 246104 (2001).
- Kalyanasundaram et al. (2006) N. Kalyanasundaram, M. C. Moore, J. B. Freund, and H. T. Johnson, Acta Mater. 54, 483 (2006).
- Doake and Wolff (1985) C. Doake and E. Wolff, Nature 314, 255 (1985).
- Oron et al. (1997) A. Oron, S. H. Davis, and S. G. Bankoff, Rev. Mod. Phys. 69, 931 (1997).
- Not (a) This critical angle at can be also obtained Castro and Cuerno (2012) without assuming a specific functional form for and assuming that, instead of a body force created by the ion, there is an elastic stress confined at the surface for an incompressible material through in Eq. (3).
- Davis (1993) C. A. Davis, Thin Solid Films 226, 30 (1993).
- Ziberi et al. (2005) B. Ziberi, F. Frost, T. Höche, and B. Rauschenbach, Phys. Rev. B 72, 235310 (2005).
- Castro et al. (2005) M. Castro, R. Cuerno, L. Vázquez, and R. Gago, Phys. Rev. Lett. 94, 016102 (2005).
- Not (b) The fit can be further improved (not shown) if one also fits the critical angle as .