Elemental abundances of intermediate age open cluster NGC 3680 ††thanks: Based on observations obtained at the European Southern observatory, Paranal, Chile (ESO programme 072.B-0331(B)).
Abstract
We present a new abundance analysis of the intermediate age Galactic open cluster NGC 3680, based on high resolution, high signal-to-noise VLT/UVES spectroscopic data. Several element abundances are presented for this cluster for the first time, but most notably we derive abundances for the light and heavy s-process elements Y, Ba, La, and Nd. The serendipitous measurement of the rare-earth r-process element Gd is also reported. This cluster exhibits a significant enhancement of Na in giants as compared to dwarfs, which may be a proxy for an O to Na anti-correlation as observed in Galactic globular clusters but not open clusters. We also observe a step-like enhancement of heavy s-process elements towards higher atomic number, contrary to expectations from AGB nucleosynthesis models, suggesting that the r-process played a significant role in the generation of both La and Nd in this cluster.
keywords:
Galaxy: open clusters – Open clusters: individual (NGC 3680) – stars: abundances.1 Introduction
Galactic open clusters (OCs) have long been established as important fossils of both the dynamical and chemical evolution of the Galaxy. They are numerous, enable reasonably accurate dating, and even though their lifetimes are typically thought to be very short (Janes et al., 1988), significant numbers of old OCs have been detected ranging back to the primordial Galaxy (Phelps et al., 1994; Liu & Chaboyer, 2000; Randich et al., 2009; Bragaglia et al., 2008; Sestito et al., 2008). Hence they provide a time-resolved sample, across a range of Galacto-centric radii, with which to probe the chemical evolution of the Galaxy (Friel et al., 2002). Typically, [Fe/H] abundances are used as tracers of chemical evolution across OCs, and there are a large number of clusters for which these values have been computed, but only a modest sample of studies go beyond this basic indicator (e.g., see Carrera & Pancino 2011), into the realm of the , r-, and s-process elements.
These elements are now recognized to be important generational indicators, and form a basis by which to piece together the primordial building blocks of the Galaxy (Freeman & Bland-Hawthorn, 2002). It has been demonstrated that their patterns, which become imprinted in the photospheres of cluster members when they are born, can be used to link dissolved associations to their natal environments (De Silva et al., 2006; De Silva et al., 2007; Bubar & King, 2010).
The nucleosynthesis of these elements is believed to happen in the very late phases of stellar evolution (Wallerstein et al., 1997); specifically, Asymptotic Giant Branch (AGB) phase stars are thought to be responsible for the enrichment of some s-process elements including Y, Ba, Nd, and La, while high mass stars () that are fated for death via core-collapse supernova (SN II) are responsible for a range of the -elements including Mg, Si, Ca, and Ti. Type Ia supernovae (SN Ia) generate large amounts of the Iron-peak elements including Fe, Ni, Cr, Co and Mn. Several authors have established trends for these elements amongst thin and thick Galactic disk field stars for a range of metallicities and ages (Bensby et al., 2005, 2003; Reddy et al., 2003), enabling them to make conjectures about the relative rates and timescales at which these types of events occurred.
NGC 3680, an intermediate age (1.5 Gyr) OC situated about 8 kpc from the Galactic center in the thin disk, has been extensively studied photometrically and to some extent spectroscopically. Nordstroem et al. (1997) established membership probabilities based on radial velocities (RVs) and proper motions, and though there has been some spread in the literature over cluster mean [Fe/H] values, from 0.17 dex to 0.09 dex (Nordstroem et al., 1997; Bruntt et al., 1999; Pasquini et al., 2001; Anthony-Twarog et al., 2009), the general consensus from recent studies is that this cluster is slightly metal poor at 0.08 dex. Most spectroscopic studies have been targeted at understanding the nature of the Li-dip observed in this and other clusters (Anthony-Twarog et al., 2009; Pasquini et al., 2001), and thus there is a lack of published abundances beyond Li and Fe, though Anthony-Twarog et al. (2009) derived Si, Ca, and Ni abundances for their program stars, and Pace et al. (2008) reported several metal abundances for two dwarf stars.
In this paper we present an abundance analysis of 8 giants and 3 dwarfs based on high resolution spectroscopic data, covering 14 elements, including several s-process and one rare-earth r-process element, Gadolinium. In Section 2 we describe our program targets and observations and describe the methods used in determining differential abundances and uncertainties. In Section 3 we discuss membership, general characteristics and abundance trends of NGC 3680, and finally in Section 4 we summarise our findings.
2 Observations & Analysis
The targets in this study were selected from the catalog of Nordstroem et al. (1997), as members of NGC 3680, using the membership determination criteria therein. Observations were carried out using the FLAMES multi-object fibre system feeding the UVES spectrograph (R45,000) at the VLT as a part of service program 072.B-0331B over 9 nights in 2004. Table 1 gives details of the targets in the study, including stellar parameters as determined below, where the top part shows giants and the bottom part dwarfs. Individual objects were observed at several distinct times; all spectroscopic analyses herein were performed on exposure-weighted averages of all available spectra for each object. Care was taken to ensure matching of the wavelength scale for the different epochs observed before combining. Typical signal-to-noise (S/N) was 130 for the giants and 90 for the dwarfs (star Nos. 5, 24, 35).
| No. | RA | Dec | Vmag | Teff | log g | |
|---|---|---|---|---|---|---|
| (h:m:s) | (d:m:s) | (K) | (cm s-2) | (km/s) | ||
| 11 | 11:25:29.2 | 43:15:48.0 | 10.88 | 5100 | 3.1 | 1.60 |
| 13 | 11:25:16.1 | 43:14:24.3 | 10.78 | 4950 | 3.0 | 1.69 |
| 20 | 11:25:26.2 | 43:11:24.2 | 10.10 | 5200 | 3.2 | 1.61 |
| 26 | 11:25:38.0 | 43:16:06.4 | 10.92 | 5100 | 3.3 | 1.73 |
| 27 | 11:25:41.9 | 43:17:07.0 | 10.73 | 5050 | 3.1 | 1.78 |
| 34 | 11:25:38.6 | 43:13:58.9 | 10.60 | 5100 | 2.9 | 0.94 |
| 41 | 11:25:48.4 | 43:09:52.7 | 10.88 | 5100 | 3.2 | 1.76 |
| 44 | 11:25:49.8 | 43:12:16.0 | 9.98 | 4800 | 2.6 | 2.10 |
| 24 | 11:25:34.3 | 43:15:21.6 | 13.77 | 6650 | 4.8 | 2.13 |
| 35 | 11:25:38.1 | 43:13:27.3 | 13.07 | 6800 | 4.4 | 2.20 |
| 5 | 11:25:18.4 | 43:16:25.0 | 12.83 | 7100 | 4.1 | 2.20 |
2.1 Equivalent width measurements
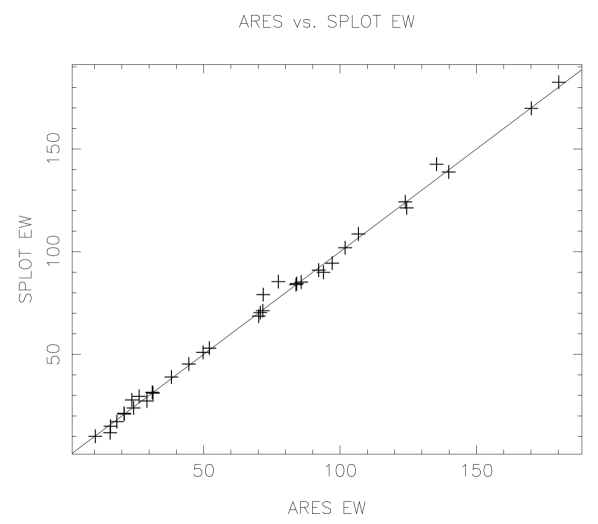
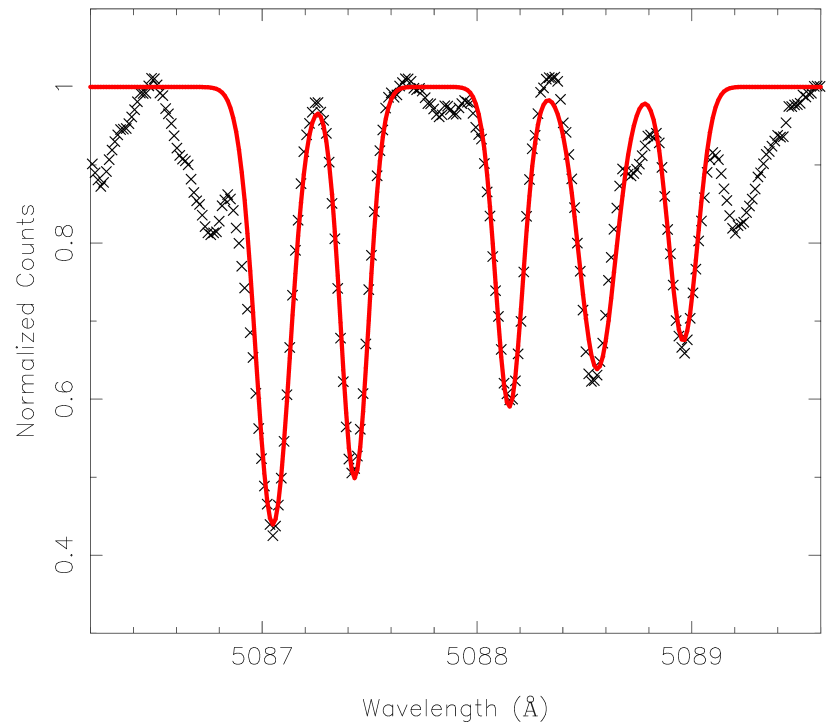
Absorption line equivalent widths (EWs) were measured using the ARES111http://www.astro.up.pt/~sousasag/ares/ code (Sousa et al., 2007) for automatic equivalent width measurements. Briefly, the code works by first determining the continuum level using an iterative point rejection technique, normalising the data, locating separate absorption features by looking for crossings in the third differential of the data and then fitting Gaussian profiles to these features. There are several input parameters, the optimal values of which were determined by comparing hand measurements of EWs in a typical spectrum using the splot function in IRAF222http://iraf.noao.edu/ until the best agreement was achieved. Figure 1 illustrates the performance of the ARES code on these high resolution data. The results of EW measurement were further checked by reviewing plots of the continuum and Gaussian profile fits for each line in each target. Where there were anomalous measurements (e.g. continuum contaminated by a spurious cosmic ray) the ARES measurements were replaced by hand measurements of those features. Table 2 lists the atomic parameters , EP, and log gf for each species along with measured EWs for each star.
| ion | EP | log gf | 11 | 13 | 20 | 26 | 27 | 34 | 41 | 44 | 24 | 35 | 5 | |
|---|---|---|---|---|---|---|---|---|---|---|---|---|---|---|
| Å | mÅ | |||||||||||||
| 4799.41 | Fe I | 3.64 | 2.23 | 68.25 | 75.40 | 67.43 | 74.30 | 73.38 | 49.78 | 74.28 | 85.48 | 19.58 | 12.63 | 7.30 |
| 4802.88 | Fe I | 3.64 | 1.51 | 88.31 | 92.50 | 88.08 | 91.32 | 92.29 | 64.86 | 93.29 | 94.64 | 47.72 | 40.99 | 28.40 |
| 4808.15 | Fe I | 3.25 | 2.79 | 62.40 | 70.62 | 58.60 | 66.12 | 68.93 | 49.96 | 62.75 | 73.66 | 15.20 | 4.51 | |
| 4809.94 | Fe I | 3.57 | 2.72 | 45.76 | 52.83 | 45.26 | 53.19 | 50.75 | 39.79 | 48.97 | 57.12 | 10.84 | ||
| 4835.87 | Fe I | 4.10 | 1.50 | 102.19 | 113.20 | 100.48 | 113.92 | 111.55 | 83.96 | 59.23 | 102.64 | 36.46 | 25.23 | 19.81 |
2.2 Stellar parameter determinations
The stellar parameters log g, Teff, and microturbulent velocity , form the basis required to translate EWs to abundances or to fit synthetic spectra, based on assumed abundances, to observed spectra. We determined these parameters using spectroscopic methods and a grid of ATLAS9 (Castelli & Kurucz, 2004) model atmospheres interpolated to give a resolution of 50K in Teff and 0.1 in log g. Using the MOOG333http://www.as.utexas.edu/~chris/moog.html (Sneden, 1973) driver abfind to force-fit abundances to our measured EWs, stellar parameters were determined by hand for each star in the typical way: Teff by balancing Fe i abundances against excitation potential, by balancing Fe i abundances against reduced EW, and finally log g by requiring ionization balance between Fe i and Fe ii. On average across our eleven targets 120 Fe i lines and 11 Fe ii lines were used in the determination of stellar parameters.
2.3 Abundance Analysis
The atomic line data for Fe and the other EW species are a subset of those used by Bensby et al. (2003), Ba data were taken from McWilliam (1998) while La, Nd and Gd were obtained via the VALD database444http://vald.astro.univie.ac.at/~vald/ (Kupka et al., 1999). Abundances for the elements, Fe, Zn, Ca, Na, Mg, Cr, Ni, Ti, Si, and Al were then force-fit using abfind to all measured EWs for a given species. Values relative to solar (i.e., [X/Fe], solar values derived as described below) are shown in Table 4, along with separate cluster means for giants (top) and dwarfs (bottom).
For the species Ba, La, Nd, Gd, whose lines were too blended or for which the effects of hyperfine splitting preclude simple EW measurements, synthetic spectra were generated and compared to observations using the MOOG driver synth. A range of abundance values were selected and compared by eye until a suitable fit was identified. Spectrum synthesis was not performed on the three dwarfs because of the lower S/N. The results of synthesis are reported together with other abundances in Table 4.
Recent work by Santos et al. (2009) derived spectral parameters for 3 giants in common with those in this study using VLT UVES data at R50,000. The Teff, log g, and values obtained from our analysis are systematically higher by, on average, 250K, 0.4, and 0.3 km/s, respectively. To address any possible systematics in terms of atomic parameters, we repeated our stellar parameter determination using Fe atomic data from the same line list (Sousa et al., 2008) as in Santos et al. (2009). Given the differing spectral range in our data, we were only able to utilize 181/263 Fe i lines and 24/36 Fe ii lines. With this analysis we came out with parameters compatible with our previous measurements. To further test our Fe atomic parameters, in the same manner as in Santos et al. (2009), we derived stellar parameters for the HARPS solar spectrum “Ganymede” again with the same procedure followed above, obtaining very close to expected values (Teff585050, log g4.40.1, 0.970.1, [Fe/H]0.020.08). Therefore, the differences in stellar parameters are likely due to differences in data and code used to derive the them.
Systematic errors affecting one’s ability to compare abundance results from different studies come from a variety of sources, including choices of model atmosphere grids, atomic data and more subtle effects such as automated algorithms for continuum determination. In order to minimise the contribution of such systematics, all abundance values presented here are reported relative compared to solar measurements as described above, using the “Ganymede” spectrum. We derive solar values via EWs for Fe, Na, Mg, Al, Si, Ca, Ti, Cr, Ni, Zn, and Y of 7.54, 6.43, 7.79, 6.52, 7.53, 6.42, 4.92, 5.73, 6.28, 4.69, and 2.17, respectively. For the synthesised elements Ba, La, and Nd, our computed values are 2.23, 1.12, and 1.45.
2.4 Errors and Uncertainties
The sources of uncertainty in abundance values are related to the measurement of EWs (including the automatic continuum determination), the atomic parameters (including excitation potential and log gf), and the determination of stellar parameters (which in turn are derived from Fe EW measurements, atomic parameters and choice of atmospheric model).
Uncertainties for EWs were estimated via a Monte-Carlo method, by inducing variations in the most sensitive ARES parameter, rejt (as noted by Sousa et al. 2007), between reasonable values, (0.990,0.999) for giants and (0.885,0.995) for dwarfs (the difference in mean rejt values between dwarfs and giants being a function of S/N). We collated measurement differences from the mean across all lines in a given species for all stars. The resulting distribution was approximately Gaussian with the zero point being the EW used in analysis; the 90% limit of this distribution (i.e., 90% of all differences lie within this value) was then used in determining the abundance sensitivity for each species for a representative giant and dwarf.
Uncertainties were conservatively assumed to be at the measurement resolution for Teff and log g, 50K and 0.1 respectively, and the uncertainty in was taken to be 0.1 km/s. Abundance sensitivities are reported in Table 3 for all identified sources of error, where L and T are the uncertainty on log g and Teff respectively. The quadrature sum of all these sources is reported as the total uncertainty. Due to the marked difference in quality of spectra for our giants and dwarfs, we have computed the uncertainties for each separately.
| Fe | Na | Mg | Al | Si | Ca | Ti | Cr | Ni | Zn | Y | Ba | La | Nd | Gd | |
|---|---|---|---|---|---|---|---|---|---|---|---|---|---|---|---|
| L0.1 | 0.01 | 0.05 | 0.01 | 0.01 | 0.02 | 0.01 | 0.02 | 0.01 | 0.01 | 0.03 | 0.01 | 0.05 | 0.04 | 0.04 | 0.04 |
| T50 | 0.04 | 0.04 | 0.03 | 0.03 | 0.01 | 0.04 | 0.04 | 0.04 | 0.03 | 0.01 | 0.06 | 0.01 | 0.01 | 0.01 | 0.01 |
| 0.1 | 0.04 | 0.03 | 0.03 | 0.01 | 0.01 | 0.04 | 0.03 | 0.02 | 0.04 | 0.06 | 0.07 | 0.03 | 0.02 | 0.04 | 0.03 |
| EW | 0.06 | 0.09 | 0.06 | 0.06 | 0.07 | 0.07 | 0.03 | 0.05 | 0.06 | 0.00 | 0.03 | 0.04 | 0.04 | 0.06 | 0.06 |
| Totgiant | 0.08 | 0.11 | 0.07 | 0.07 | 0.08 | 0.09 | 0.06 | 0.07 | 0.08 | 0.06 | 0.10 | 0.07 | 0.06 | 0.08 | 0.08 |
| L0.1 | 0.00 | 0.01 | 0.01 | 0.00 | 0.01 | 0.00 | 0.00 | 0.00 | 0.01 | 0.01 | |||||
| T50 | 0.03 | 0.02 | 0.02 | 0.01 | 0.03 | 0.04 | 0.03 | 0.03 | 0.03 | 0.04 | |||||
| 0.1 | 0.01 | 0.01 | 0.01 | 0.01 | 0.01 | 0.01 | 0.00 | 0.01 | 0.01 | 0.01 | |||||
| EW | 0.07 | 0.12 | 0.04 | 0.07 | 0.06 | 0.06 | 0.16 | 0.07 | 0.00 | 0.01 | |||||
| Totdwarf | 0.07 | 0.12 | 0.05 | 0.08 | 0.06 | 0.07 | 0.17 | 0.07 | 0.03 | 0.04 |
| No. | [Fe/H] | Na | Mg | Al | Si | Ca | Ti | Cr | Ni | Zn | Y | Ba | La | Nd | Gd |
| 11 | 0.04 | 0.05 | 0.05 | 0.06 | 0.04 | 0.15 | 0.18 | 0.01 | 0.07 | 0.34 | 0.25 | 0.16 | 0.36 | 0.56 | 0.39 |
| 13 | 0.01 | 0.13 | 0.00 | 0.12 | 0.07 | 0.09 | 0.22 | 0.09 | 0.01 | 0.38 | 0.23 | 0.16 | 0.31 | 0.56 | 0.34 |
| 20 | 0.06 | 0.22 | 0.14 | 0.08 | 0.10 | 0.09 | 0.24 | 0.04 | 0.05 | 0.31 | 0.10 | 0.18 | 0.24 | 0.44 | 0.46 |
| 26 | 0.09 | 0.12 | 0.01 | 0.16 | 0.01 | 0.03 | 0.29 | 0.11 | 0.03 | 0.43 | 0.13 | 0.12 | 0.29 | 0.51 | 0.49 |
| 27 | 0.04 | 0.16 | 0.01 | 0.10 | 0.02 | 0.11 | 0.21 | 0.10 | 0.10 | 0.50 | 0.09 | 0.06 | 0.26 | 0.56 | 0.34 |
| 34 | 0.11 | 0.04 | 0.15 | 0.02 | 0.03 | 0.09 | 0.07 | 0.07 | 0.04 | 0.48 | 0.19 | 0.21 | 0.21 | 0.64 | |
| 41 | 0.03 | 0.11 | 0.01 | 0.18 | 0.03 | 0.06 | 0.25 | 0.12 | 0.00 | 0.42 | 0.11 | 0.13 | 0.27 | 0.55 | 0.43 |
| 44 | 0.13 | 0.18 | 0.05 | 0.27 | 0.15 | 0.03 | 0.21 | 0.14 | 0.03 | 0.49 | 0.24 | 0.03 | 0.43 | 1.09 | 0.49 |
| Mean | 0.00 | 0.13 | 0.04 | 0.11 | 0.04 | 0.08 | 0.21 | 0.09 | 0.04 | 0.42 | 0.17 | 0.13 | 0.31 | 0.56 | 0.45 |
| 24 | 0.07 | 0.16 | 0.16 | 0.00 | 0.05 | 0.15 | 0.04 | 0.03 | 0.29 | 0.11 | |||||
| 35 | 0.15 | 0.06 | 0.11 | 0.01 | 0.04 | 0.07 | 0.07 | 0.10 | 0.23 | 0.12 | |||||
| 5 | 0.17 | 0.15 | 0.11 | 0.01 | 0.01 | 0.11 | 0.16 | 0.09 | 0.16 | 0.11 | |||||
| Mean | 0.16 | 0.10 | 0.11 | 0.01 | 0.03 | 0.09 | 0.12 | 0.10 | 0.20 | 0.12 |
3 Discussion
3.1 Cluster membership and properties
Although cluster membership has already been established for our target sample, it is prudent to confirm this, and in doing so also confirm our determination of stellar parameters. To this end, we performed a least squares fit to a set of Yale-Yonsei (Y2) (Demarque et al., 2004) isochrones against Teff and log g. Figure 3 shows the best fit isochrone, which yields a cluster age of 1.4 Gyr, in good agreement with photometrically determined ages in previous studies of between 1.45 and 1.75 Gyr (Nordstroem et al., 1997; Anthony-Twarog et al., 2009)
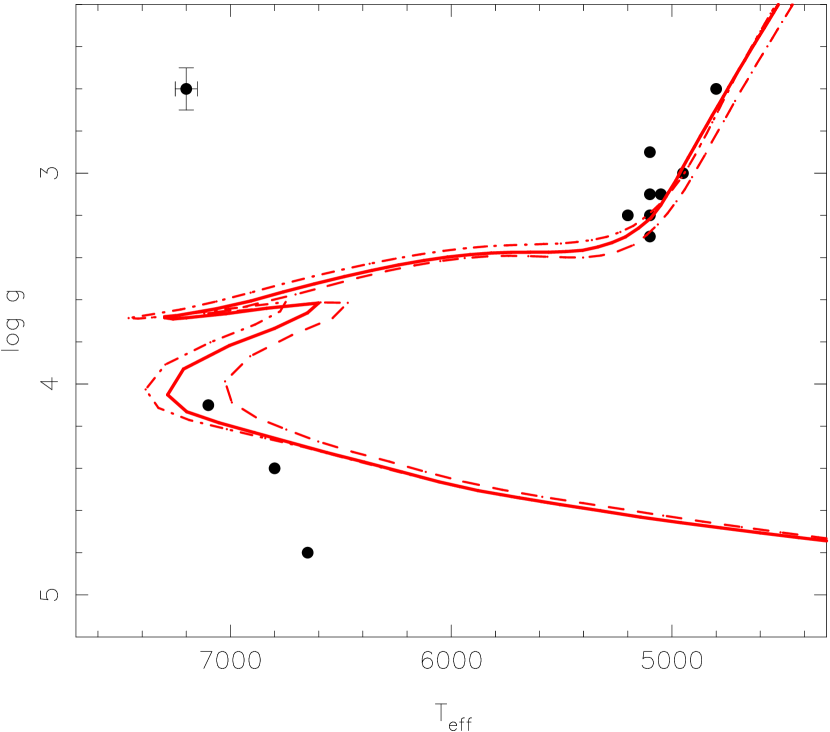
There is a clear outlier in Figure 3, the coolest of the dwarf stars (target No. 24), which has an anomalously high log g. The [Fe/H] for this star, though within the limits of the typical spread amongst all targets, is clearly deviant from the other dwarf stars. A review of the Fe lines used in determining the log g value revealed no unusual trends. The radial velocity for this target, at 2.44 km/s from the cluster mean, is on the outer envelope of those considered members (Nordstroem et al., 1997), raising the possibility that it has been erroneously classified as a member. We cannot dismiss the possibility that the isochrone placement of this target is due to binarity; Nordstroem et al. (1997) marked it as a single line binary (“SB1” in their Table 1), however we find no such indications in our spectra, which consist of 8 epochs observed over 16 days. Given its position in the isochrone, along with the slight extremity of its radial velocity, we are led to reject it as a non-member based on our spectroscopic analysis.
On examination of Table 4, we see two giants that strongly deviate in [Fe/H] from the rest of the giant population, specifically Nos. 34 and 44 at 0.15 dex below the mean. Both of these stars also exhibit proportionally low Ba abundances, while star No. 44 appears to have anomalously high Nd, and enhancement in several other elements (Mg, Al, Si, and La). This contrasts starkly with star No. 34’s relative deficiency in Nd, Gd, Mg, Na and Ti.
These two targets are squarely within the radial velocity criteria for membership and both have high membership probabilities based on proper motion (Nordstroem et al., 1997). Both likewise do not appear anomalous on inspection of Figure 3, so it is unlikely the unusual abundance patterns are explained by mistaken membership assignment. Binarity for No. 34 has been suggested based on a blue excess in photometric data (Mermilliod et al., 1995), but it exhibits no indication of binarity in its spectrum. No. 44 is not a known binary system, however we note that the binary fraction in this cluster is fairly high (Nordstroem et al., 1997). Indeed, of the 11 targets in this study five (Nos 11, 20, 27, 24, and 5) are considered spectroscopic binaries, though they all clump quite tightly in Figure 3.
3.2 Metallicity
Ignoring the previously mentioned probable non-member, star No. 24, and averaging between both dwarfs and giants as a single group, we obtain a cluster metallicity of [Fe/H]0.030.02. If we treat dwarfs and giants as two separate but equally significant groups, we obtain the slightly lower value of [Fe/H]0.080.03. Anthony-Twarog et al. (2009), using a weighting scheme based on standard errors, report the cluster mean [Fe/H]0.080.02, in perfect agreement with the second value above and only slightly poorer than the first. A perplexing result is that the relation between group means of giants and dwarfs, if considered separately, is reversed in our analysis as compared to that in Anthony-Twarog et al. (2009). Where we compute [Fe/H]G0.000.03, they obtain [Fe/H]G0.170.08, and while our dwarfs have [Fe/H]D0.160.05, theirs have [Fe/H]D0.040.11, differences of 0.16 and 0.12 dex respectively in opposite directions. It is important to note that these mean abundances for dwarfs are actually compatible within uncertainties, and that our value is based on only two dwarfs as compared to their thirteen. It is possible that the discrepancy between giants in our analyses can be attributed to differences in stellar parameter determination as described in Anthony-Twarog et al. (2009); here we use ionisation balance, while they use photometric methods. Referring to Table 3, had we adopted the stellar parameters of Santos et al. (2009), the mean cluster metalicity would increase by 0.12 dex to [Fe/H]0.04.
In spite of the differences in analysis mentioned above, and noting the paucity of abundances in the literature for this cluster, we now attempt to make comparisons of other element abundances. Anthony-Twarog et al. (2009) were able to derive abundances of Si and Ni for both giants and dwarfs, and additionally Ca for their dwarfs. Between our studies for giants, Ni is compatible at close to solar values, yet Si in their analysis is significantly enhanced compared to ours, at [Si/Fe]G0.220.14, though this could be explained by the difference in numbers of lines used (their one line versus ten in the present analysis). For the dwarfs, both Si and Ni are at similar levels while Ca is 0.10 dex below our mean but still within uncertainties. Another study, Pace et al. (2008), derived abundances based on two dwarfs for Na, Al, Si, Ca, Ti, Cr and Ni obtaining 0.010.08, 0.080.04, 0.010.04, 0.040.06, 0.040.08, 0.010.04, and 0.050.03 respectively. With the exception of Na and Cr, which seem at odds, we see no major differences amongst dwarf stars. Both Na and Cr for dwarfs exhibit the largest uncertainties amongst our entire stellar sample.
3.3 Gadolinium
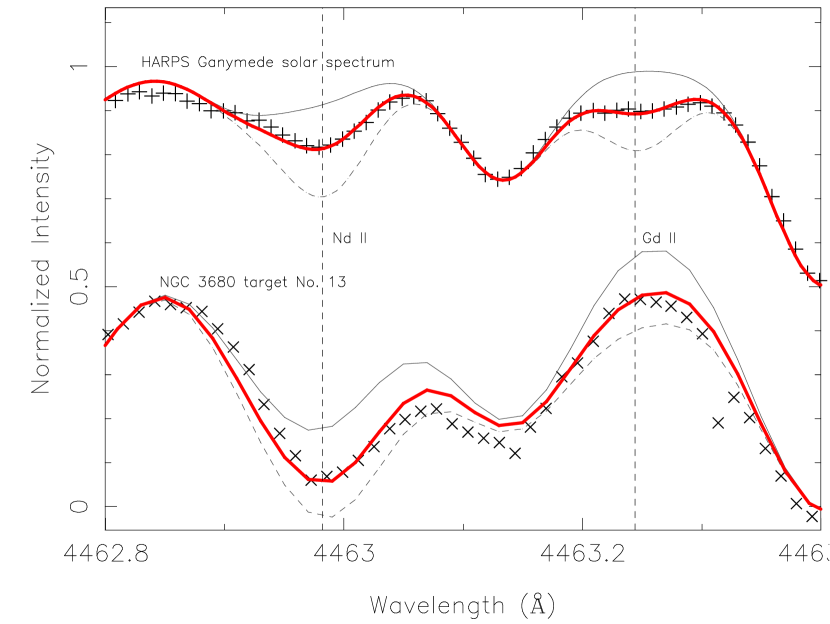
While synthesizing Nd we noticed a feature in the spectra that could only be properly reproduced by modulating the abundance levels of the r-process element Gadolinium. This feature also appears and is well fit with our atomic data in the solar spectrum. To our knowledge, there exist no abundance measurements of Gd in open clusters in the literature. Sneden & Parthasarathy (1983), using several Gd features at 3549Å and 3768Å in the spectrum of HD 122563, obtained a similarly deficient abundance of [Gd/Fe]0.50, and Den Hartog et al. (2006) addressed the lack of measurements by improving abundance measurements of the Sun and deriving abundances for three metal poor giants obtaining values of 0.14, 0.42, and 1.08 respectively. Unfortunately, as these are not known cluster members and were selected for their low metal abundances, it is difficult to place those results in the context of the current study. Our measurements are based on a single line at 4463Å, which is evident in the solar spectrum and likewise can be fit in the NGC 3680 giant spectra.
Figure 4 shows synthesis results for Nd and Gd for both the Ganymede solar spectrum and a representative giant spectrum from our analysis; note the difference in line shape between the giant star and the Sun, which is likely caused by broader profiles of the Fe features on either side. Our computed solar abundance of Gd, using line data obtained from VALD, is 2.77 which is well above that computed by Den Hartog et al. (2006) of 1.11. Effects such as hyper-fine structure or isotopic ratios may effect the computations significantly and were not included in our synthesis, as we are not aware of any analysis specifically involving the line at 4463Å. With the cluster giants at near solar metallicity, the robustness of our differential values seems enhanced; however effects due to temperature and log g (i.e., comparing giants and dwarfs) may play a significant role in the shaping the Gd profile, making such comparison difficult.
Eu synthesis proved to be too difficult for this cluster so Gd is the only pure r-process element we were able to measure. Gd may act as a proxy for the trends of other rare earth abundances in this cluster; however given the lack of specific knowledge of this species, in addition to our measured solar value well beyond literature solar values, our reported abundance must be taken with caution.
3.4 Na enhancement in giants vs. dwarfs
There is a clear divide between giants and dwarfs in terms of [Na/Fe] abundances, of order 0.25 dex, as seen in Table 4. Assuming that the stars in this cluster formed out of a well mixed common natal environment (e.g. Freeman & Bland-Hawthorn 2002), it is possible that the initial abundances of Na in RGB phase stars are modified and enhanced via the Ne-Na cycle, after which deep convection brings the newly formed Na to the photosphere (Salaris et al., 2002). It is unclear whether the temperatures required for the Ne-Na cycle are reached in these stars, and thus a primordial explanation may be required. The commonly observed O-Na anti-correlation in Galactic Globular Clusters (GCs) may be related to this action, as the CNO cycle is thought to require the same temperatures/depths as the Ne-Na cycle, and is responsible for the depletion of O. Again, whether this observation is explained by stellar evolution or primordial abundance variations is still an open question. It is interesting to note, though, that the same anti-correlation has not been observed in OCs in the Galaxy (De Silva et al., 2009).
It is also possible that the abundance differences between dwarfs and giants are the result of non-LTE effects and no intrinsic differences exist. Na is particularly sensitive to non-LTE effects, though the most notable corrections are required at extremely low metallicities (Andrievsky et al., 2007; Baumueller et al., 1998). Even after computing Na abundances using non-LTE models, Andrievsky et al. (2007) observe a Na enhancement in giants, also present in their LTE analysis, which they attribute to a mixing mechanism as above.
3.5 The s-process element abundances
Due to the lack of a range of s-process abundance measurements for NGC 3680 in the literature, we take this opportunity to discuss abundance trends for the elements Y, Ba, La, and Nd specifically. Figure 5 places the heavy element abundances of NGC 3680 within the context of other OCs and Galactic field stars where possible. The thick and thin disk samples were taken from Bensby et al. (2005) while the cluster sample was compiled from references within Carrera & Pancino (2011), using the mean abundance value from available high resolution studies for a given cluster. NGC 3680 exhibits higher than average La and Nd abundances, although several other clusters show more enhanced abundances for these two species. IC 4756 and NGC 2420 exhibit higher Nd abundances while NGC 2141 and Tombaugh 2 are more enhanced in La. NGC 2420 has both the lowest La and highest Y in the sample, and is additionally the most metal-poor cluster considered here.
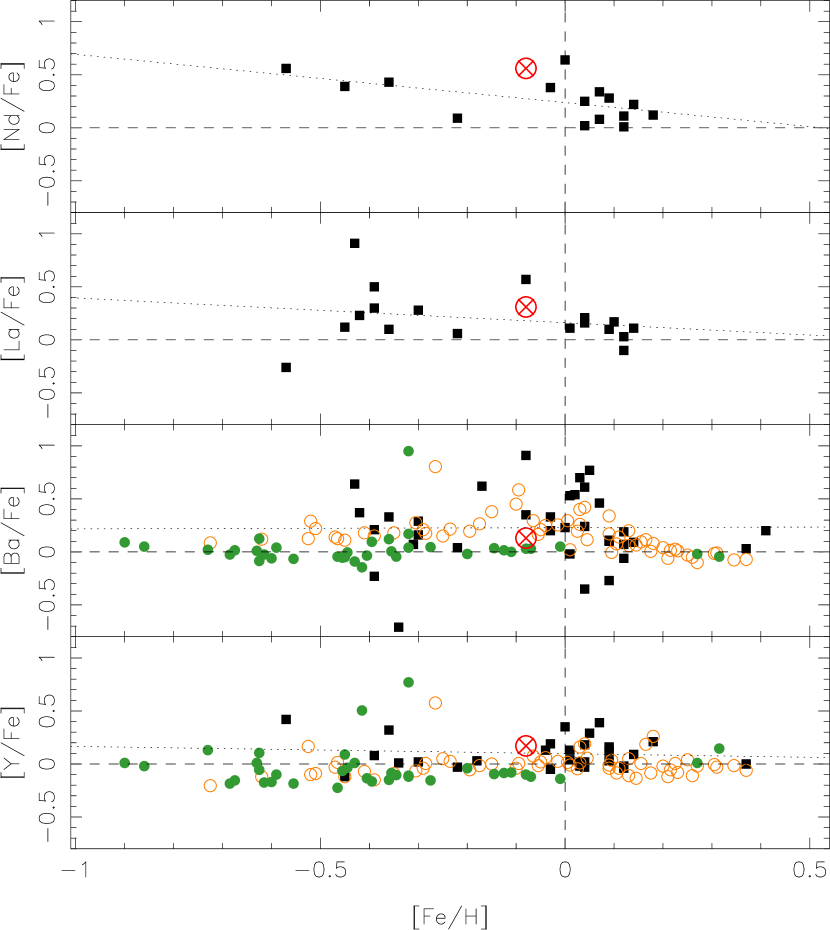
The two heavy s-process elements, La and Nd, appear to be more enhanced with respect to Fe as metallicity decreases amongst the cluster population. This trend is broadly consistent with that predicted in AGB stars due the the increase in neutron exposure with a decrease of the iron seed nuclei (e.g. see Busso et al. 2001). Ba does not seem to exhibit such a trend, though the cluster abundance scatter is quite high. D’Orazi et al. (2009) also find no correlation in [Ba/Fe] with metallicity amongst clusters, but notice a significant anti-correlation with age, which they argue is evidence of a greater extra-mixing efficiency for lower mass stars producing the 13C neutron source. NGC 3680, in our analysis, falls roughly 0.06 dex below the group of intermediate age clusters shown in Figure 2 of D’Orazi et al. (2009) roughly 0.06 dex below the group of intermediate ages, but still quite clearly within the uncertainties and thus does not challenge the age-Ba anti-correlation observed.
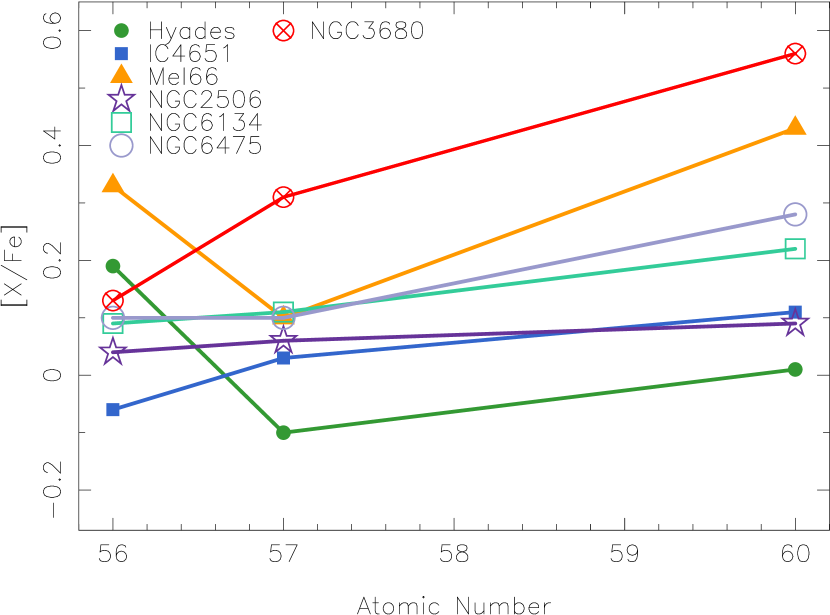
The heavy s-process elements Ba, La, and Nd in the giant population of NGC 3680 have increasing abundances with increasing atomic number, by roughly 0.2 dex at each step. Other OCs exhibit a similar monotonically increasing trend, as seen in Figure 6, which plots atomic number vs. mean cluster abundance for a sample of clusters from Figure 5 which had measurements for all three elements, though none with a slope as consistently high as NGC 3680. Since the s-process alone from models of AGB stars yields a clear peak at Ba resulting in lower abundances for the other heavy s-process elements (Busso et al., 1999) across a range of metallicity and mass, another process is needed to explain the observed enhancements. The most likely such process is the rapid neutron capture (r-) process, which quickly builds very large nuclei that decay over time to the stable isotopes beyond atomic numbers of around 55. This process is thought to require high neutron densities, likely only available in the shocks of core-collapse supernovae. The Ba peak from AGB models is observed in solar photospheric and meteoritic data (e.g. see Asplund et al. 2009), implying a higher ratio of high-mass stars (those fated for the SN II) in the cluster’s progenitor population, as compared to that of the Sun. Other clusters exemplify the Ba-peak (e.g. see Figure 2 of De Silva et al. 2009), indicating a range of formation scenarios that can be explored using abundance trends within the s-process elements.
The sample in Figure 6 has a limited range in [Fe/H], owing in part to the limited availability of literature abundances for these heavy elements. Both the r- and s-processes have a dependence on metallicity due to the seeding nature of the Fe nuclei; more data are clearly needed at a range of metallicities lower than [Fe/H] 0.5 to explore this effect in more detail.
4 Conclusions
We have performed a detailed spectroscopic abundance analysis on the intermediate aged open cluster NGC 3680, obtaining differential abundances of Na, Mg, Si, Ca, Ti, Cr, Ni, Zn, and Y for 8 giant and 3 dwarf stars, and Al, Ba, La, Nd, and Gd for the 8 giant stars. We find a combined metallicity of [Fe/H]0.03 dex, and for the giants in this study [Fe/H]0.08 dex in good agreement with literature values. Based on our analysis, we propose that the membership assignment of a single star (No. 24 in this study) be rejected both due to its position on the CMD and its anomalous metallicity.
The serendipitous measurement of Gd in this cluster represents the only measurement of a pure r-process element for this cluster, and likewise the only measurement of Gd for an open cluster that we are aware of. This may have important implications with respect to the progenitor population of NGC 3680, however due to measurement uncertainties it is difficult to comment on its value.
A significant divide in [Na/Fe] abundances between dwarfs and giants is observed. This may be due to non-LTE effects which are difficult to quantify, but there is also the possibility that convection in the giants is bringing fresh Na to the photosphere, thus enhancing the [Na/Fe] abundance. If that is the case, this action may be related to the O-Na anti-correlation observed in Galactic GCs, but not OCs, though the mechanism responsible for this is still not well understood.
An important result of this analysis is the measurement of a range of s-process elements (Y, Ba, La, Nd), for which measurements in open clusters remain limited in the literature. Comparing these abundances with available open cluster data, we find that NGC 3680 fits within the typical spread, with La and Nd having above average values. The Ba abundance from our analysis is consistent within uncertainties, though somewhat low for the cluster’s age, in the context of the recent finding by D’Orazi et al. (2009) of an anti-correlation of [Ba/Fe] with age.
We observe a step-like enhancement within the heavy s-process peak elements in this and other clusters. We argue that this observed trend indicates a substantial amount of r-processing contributed to the generation of La and Nd, likely in core-collapse supernovae in the progenitor populations of these clusters.
Acknowledgments
The authors would like to acknowledge Yuan-Sen Ting for providing the table of abundance data compiled from the references within Carrera & Pancino (2011). We thank Valentina D’Orazi for helpful advice on spectrum synthesis. Finally, we would like to thank our anonymous referee for helpful suggestions in strengthening this work.
References
- Andrievsky et al. (2007) Andrievsky S. M., Spite M., Korotin S. A., Spite F., Bonifacio P., Cayrel R., Hill V., François P., 2007, A&A, 464, 1081
- Anthony-Twarog et al. (2009) Anthony-Twarog B. J., Deliyannis C. P., Twarog B. A., Croxall K. V., Cummings J. D., 2009, AJ, 138, 1171
- Asplund et al. (2009) Asplund M., Grevesse N., Sauval A. J., Scott P., 2009, ARA&A, 47, 481
- Baumueller et al. (1998) Baumueller D., Butler K., Gehren T., 1998, A&A, 338, 637
- Bensby et al. (2003) Bensby T., Feltzing S., Lundström I., 2003, A&A, 410, 527
- Bensby et al. (2005) Bensby T., Feltzing S., Lundström I., Ilyin I., 2005, A&A, 433, 185
- Bragaglia et al. (2008) Bragaglia A., Sestito P., Villanova S., Carretta E., Randich S., Tosi M., 2008, A&A, 480, 79
- Bruntt et al. (1999) Bruntt H., Frandsen S., Kjeldsen H., Andersen M. I., 1999, A&AS, 140, 135
- Bubar & King (2010) Bubar E. J., King J. R., 2010, AJ, 140, 293
- Busso et al. (2001) Busso M., Gallino R., Lambert D. L., Travaglio C., Smith V. V., 2001, ApJ, 557, 802
- Busso et al. (1999) Busso M., Gallino R., Wasserburg G. J., 1999, ARA&A, 37, 239
- Carrera & Pancino (2011) Carrera R., Pancino E., 2011, ArXiv e-prints
- Castelli & Kurucz (2004) Castelli F., Kurucz R. L., 2004, ArXiv Astrophysics e-prints
- De Silva et al. (2009) De Silva G. M., Freeman K. C., Bland-Hawthorn J., 2009, PASA, 26, 11
- De Silva et al. (2007) De Silva G. M., Freeman K. C., Bland-Hawthorn J., Asplund M., Bessell M. S., 2007, AJ, 133, 694
- De Silva et al. (2009) De Silva G. M., Gibson B. K., Lattanzio J., Asplund M., 2009, A&A, 500, L25
- De Silva et al. (2006) De Silva G. M., Sneden C., Paulson D. B., Asplund M., Bland-Hawthorn J., Bessell M. S., Freeman K. C., 2006, AJ, 131, 455
- Demarque et al. (2004) Demarque P., Woo J.-H., Kim Y.-C., Yi S. K., 2004, ApJS, 155, 667
- Den Hartog et al. (2006) Den Hartog E. A., Lawler J. E., Sneden C., Cowan J. J., 2006, ApJS, 167, 292
- D’Orazi et al. (2009) D’Orazi V., Magrini L., Randich S., Galli D., Busso M., Sestito P., 2009, ApJ, 693, L31
- Freeman & Bland-Hawthorn (2002) Freeman K., Bland-Hawthorn J., 2002, ARA&A, 40, 487
- Friel et al. (2002) Friel E. D., Janes K. A., Tavarez M., Scott J., Katsanis R., Lotz J., Hong L., Miller N., 2002, AJ, 124, 2693
- Janes et al. (1988) Janes K. A., Tilley C., Lynga G., 1988, AJ, 95, 771
- Kupka et al. (1999) Kupka F., Piskunov N., Ryabchikova T. A., Stempels H. C., Weiss W. W., 1999, A&AS, 138, 119
- Liu & Chaboyer (2000) Liu W. M., Chaboyer B., 2000, ApJ, 544, 818
- McWilliam (1998) McWilliam A., 1998, AJ, 115, 1640
- Mermilliod et al. (1995) Mermilliod J.-C., Andersen J., Nordstroem B., Mayor M., 1995, A&A, 299, 53
- Nordstroem et al. (1997) Nordstroem B., Andersen J., Andersen M. I., 1997, A&A, 322, 460
- Pace et al. (2008) Pace G., Pasquini L., François P., 2008, A&A, 489, 403
- Pasquini et al. (2001) Pasquini L., Randich S., Pallavicini R., 2001, A&A, 374, 1017
- Phelps et al. (1994) Phelps R. L., Janes K. A., Montgomery K. A., 1994, AJ, 107, 1079
- Randich et al. (2009) Randich S., Pace G., Pastori L., Bragaglia A., 2009, A&A, 496, 441
- Reddy et al. (2003) Reddy B. E., Tomkin J., Lambert D. L., Allende Prieto C., 2003, MNRAS, 340, 304
- Salaris et al. (2002) Salaris M., Cassisi S., Weiss A., 2002, PASP, 114, 375
- Santos et al. (2009) Santos N. C., Lovis C., Pace G., Melendez J., Naef D., 2009, A&A, 493, 309
- Sestito et al. (2008) Sestito P., Bragaglia A., Randich S., Pallavicini R., Andrievsky S. M., Korotin S. A., 2008, A&A, 488, 943
- Sneden & Parthasarathy (1983) Sneden C., Parthasarathy M., 1983, ApJ, 267, 757
- Sneden (1973) Sneden C. A., 1973, PhD thesis, THE UNIVERSITY OF TEXAS AT AUSTIN.
- Sousa et al. (2007) Sousa S. G., Santos N. C., Israelian G., Mayor M., Monteiro M. J. P. F. G., 2007, A&A, 469, 783
- Sousa et al. (2008) Sousa S. G., Santos N. C., Mayor M., Udry S., Casagrande L., Israelian G., Pepe F., Queloz D., Monteiro M. J. P. F. G., 2008, A&A, 487, 373
- Wallerstein et al. (1997) Wallerstein G., Iben J., Parker P., Boesgaard A. M., Hale G. M., Champagne A. E., Barnes C. A., Käppeler F., Smith V. V., Hoffman R. D., Timmes F. X., Sneden C., Boyd R. N., Meyer B. S., Lambert D. L., 1997, Reviews of Modern Physics, 69, 995