789\Yearpublication2006\Yearsubmission2005\Month11\Volume999\Issue88
later
Charge-exchange emission in the starburst galaxies M82 and NGC3256††thanks: Based on observations obtained with XMM-Newton, an ESA science mission with instruments and contributions directly funded by ESA Member States and NASA.
Abstract
Charge-exchange (CE) emission produces features which are detectable with the current X-ray instrumentation in the brightest near galaxies. We describe these aspects in the observed X-ray spectra of the star forming galaxies M82 and NGC 3256, from the Suzaku and XMM-Newton telescopes. Emission from both ions (O, C) and neutrals (Mg, Si) is recognised. We also describe how microcalorimeter instrumentation on future missions will improve CE observations.
keywords:
X-ray: galaxies — galaxies: individual (M82, NGC 3256) — ISM: lines and bands — atomic processes — instrumentation: detectors1 Introduction
Charge-exchange emission (CE) has long been known to occur in optical nebular spectra (Chamberlain 1956). In the X-ray domain, it was proposed for the first time to account for emission from the comet Hyakutake (Cravens 1997). Thereafter, it was invoked to explain X-ray features from the solar system planets (e.g., Mars and Jupiter: Dennerl et al. 2006; Branduardi-Raymont et al. 2007). It has been suggested that it might play a non-negligible role in explaining the emission from galactic winds interacting with dense clouds (Lallement 2004).
In the CE framework, ions from the wind diffuse into the cold gas; at the interface, electrons are transferred from the neutrals to the ions. The resulting ions can be highly excited, and re-arrange their electrons by emitting photons in the extreme ultraviolet and X-ray domains. This process results only in line emission and not in continuum. The photon emission rate is proportional to the wind ion flux.
In external galaxies, CE might occur at the interface between the hot wind (Heckman et al. 1990) and the clouds of cold neutral gas within the galaxy itself. Most of the emission is expected to come from ions of the most abundant and light species present in galactic winds (O, C, N; see R. Smith, this volume). It is also expected, if dust grains are present and participate with the neutrals on their surface to the CE process, that emission from the dust neutrals should be present; considering olivine and pyroxene grains in the cold clouds, this would resunt in lines from neutral Mg and Si (Djurić et al. 2005). Also, broad H emission could be detectable due to the CE providing thermal balancing between protons in the superwind and neutral H atoms (J. Raymond, this volume).
2 Charge-exchange in M82
The nearby galaxy \objectM82 is often considered as the prototype starburst in the local universe. (Rieke et al. 1980). At a distance of 3.63 Mpc (Freedman et al. 1994), it has a luminosity of erg s-1 in the far infrared and erg s-1 in the X-ray domain, from which a Star Formation Rate (SFR) of M⊙ yr-1 can be estimated. The starburst is mainly located in the central regions of the galaxy, and it is the origin of a large outflow perpendicular to the plane of the galaxy and several kpc long (Heckman et al. 1990). The outflow is visible at multiple wavelengths, such as the radio (Seaquist & Odegard 1991), infrared (Alton et al. 1999; Engelbracht et al. 2006; Kaneda et al. 2010), H and X-rays (Lehnert et al. 1999). The observations in the X-ray domain with the Chandra, XMM-Newton and Suzaku observatories are reported in Griffiths et al. (2000), Read & Stevens (2002), Origlia et al. (2004), Strickland & Heckman (2007), Tsuru et al. (2007) and Ranalli et al. (2008). Thanks to the small inclination of the galaxy disc, M82 lies almost edge-on, thus allowing a good perspective on the outflow.
The CE was observed in M82 by both Suzaku (Tsuru et al. 2007) and XMM-Newton (Liu et al. 2011; Ranalli et al. 2008).
2.1 Suzaku observation
Tsuru et al. (2007) found a marginal detection of the C VI line at 0.459 keV with the XIS detector in the “Cap” region of M82. The Cap is an area of extended X-ray emission, lying 11.6 kpc to the north of the centre of M82, in the direction of the outflow. Lehnert et al. (1999) suggested that it be the result of shock heating associated with an encounter between the starburst-driven galactic superwind and a large photoionized cloud in the halo of M82. The detected line, resulting from a transition, was attributed to CE interaction of C ions with neutrals.
An upper limit to the contribution from CE to O line emission could be drawn by considering the density of the H I cloud in the Cap and the cross-section of CE between an O ion and an H atom. Under the hypothesis that all O ions undergo the CE with H I and emit O K lines, the CE photon flux is estimated as photons s-1 cm-2, to be compared with an observed flux of photons s-1 cm-2. This allows the CE to be a contributor to the O lines. By the same logic, the observed flux of C VI is also consistent with a CE origin.
Altough they are not discussed in Tsuru et al. (2007), lines from neutral Mg and Si (see Sect. 2.2) were also detected in the spectrum (T. Tsuru, priv. comm.), and indeed they are visible as residuals when the Cap spectrum is fitted with a thermal model: either a collisional ionization equilibrium one or a non-equilibrium one (Figs. 4 and 6 in Tsuru et al. 2007).
2.2 XMM-Newton observations
Ranalli et al. (2008) analyzed the X-ray spectra of several regions of the M82 outflow, as part of a project to compare X-ray and stellar-based chemical abundances (Origlia et al. 2004). The observation exposure was 100 ks (73 ks after lightcurve cleaning); here we only discuss data from the Reflection Grating Spectrometer (RGS). The RGS line spread function (LSF) depends on the source shape and on the energy; because of absorption, M82 has a different shape at the shorter wavelengths (6–18 Å) with respect to the longer ones ( Å). Thus it is not possible to fit all the spectrum at once, but it must be divided in chunks according to the LSF shape (see Ranalli et al. 2008, for details). Also, our analysis was done on all the RGS data, which cover a few arcmin around the M82 centre. A study of the spatial variation of the O line intensities was attempted by Liu et al. (2011, see also this volume), to whose paper we refer for details.

Oxygen lines
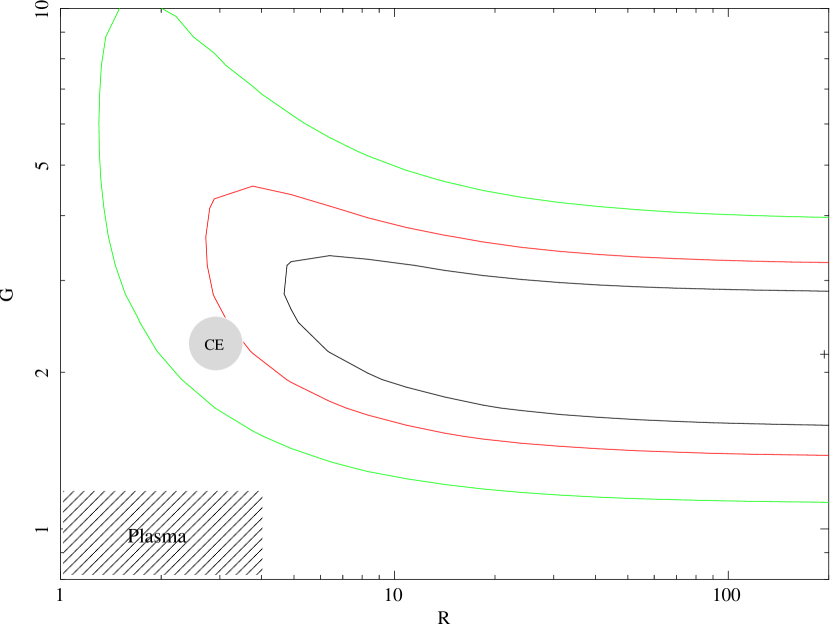
The O VII triplet was observed at high spectral resolution ( at 1 keV for point sources ) with the RGS spectrometer (Fig. 1, left panel). The triplet centroid was found to be shifted towards the forbidden line, hinting for CE-like line ratios. Altough the resolution is degraded by the large extent of M82 and the lines are blended, the line ratios could still be derived. By fitting the triplet with three narrow Gaussian lines, the and parameters (Gabriel & Jordan 1972) could be constrained to and (Fig. 1, right panel). For comparison, laboratory measurements of CE line strength resulted in and (Beiersdorfer et al. 2003); however, the allowed values of could be much larger () because of the smaller energy involved in the laboratory experiments with respect to the what expected in astrophysical situations (V. Krasnopolsky, priv. comm.). Conversely, the values expected for ionization equilibrium, thermal emission are much different (, ; Lallement 2004) and at odds with the RGS data. However, it is also possible that over-ionized non-equilibrium plasma produce similar ratios. Although Ranalli et al. (2008) could not find an acceptable fit to the whole spectrum with non-equilibrium plasma models, non-equilibrium might still play a smaller role in a restricted part of the spetrum. Overall, it is plausible that the processes of thermal and CE emission contribute at similar levels.
Two O VIII lines (at 16 Å and 19 Å) are strong enough to be fitted individually in the RGS spectrum. The energies and profiles of both lines can be modeled by thermal emission with the APEC model (Smith et al. 2001), after considering the appropriate line spread functions (LSF). The MEKAL model (Mewe et al. 1995) leaves some residuals in the 15.8–16 Å region, probably due to an incomplete modeling of the Fe XVIII lines at 15.4, 15.6 and 15.8 Å. By excluding one line from the fit, O abundances can be derived from the other one, and viceversa, thus allowing one to compare the abundances derived from one single line. The abundances derived in this way are at odds with each other: O/O for the 16 Å line, O/O for the 19 Å line (APEC model; in the Solar scale by Grevesse & Sauval 1998). The origin of this discrepancy is not clear, basically because of potential systematic errors stemming from the uncertainties in the modeling of the LSF, which for the RGS is both energy- and source shape-dependent (see Ranalli et al. 2008, for details). If taken at their face values, the larger abundance of the 19 Å line might suggest the possibility of a substantial contribution to its flux by CE. However, any verification of this latter hypothesis, will likely have to wait for new telescopes featuring microcalorimeter detectors (Astro-H, Athena), which will not suffer by the LSF systematics that currently affect the RGS (see Sect. 4).
Lines from neutral Mg and Si
Ranalli et al. (2008) report the detection of two lines at 7.2 and 10 Å with the RGS instrument (with equivalent widths of 12 and 43 eV) and of the 7.2 Å line only with the EPIC instrument (equivalent width in the 7–22 eV interval). The significance of the line detections was assessed through Montecarlo simulations, which resulted in the , 99.8% and confidence levels for the 7.2 and 10 Å line in the RGS, and the 7.2 Å line in the EPIC, respectively.
These lines were identified with emission from neutral Mg at 9.92 Å and neutral Si at 7.17 Å. This interpretation is consistent with the presence of olivine and pyroxene grains in the cold clouds (Djurić et al. 2005), and is reinforced by the detection of infrared dust emission in the M82 outflow (Kaneda et al. 2010).
2.3 Discussion
The evidence for CE phenomena in M82 relies on three observations: i) non-thermal and line ratios in the O VII RGS spectrum; ii) lines from neutral Mg and Si in RGS and EPIC; iii) marginal detection of C VI in the Cap spectrum with Suzaku. The strongest claim for CE here is probably in the first one — though the evidence for CE is not yet univoque. The other two claims should be rather regarded as further evidence in the framework where the O VII line ratios have been attributed to CE. More work is needed, both on the theoretical side (more reliable predictions of the line ratios) and on the observational side (higher resolution data), before these observations can be regarded as a proof of CE.
3 Charge-exchange in NGC 3256
NGC 3256 is a luminous dusty merger remnant, with a SFR about 10 times larger than M82. In antithesis to M82, NGC 3256 lies face-on, so that the galactic outflow points towards us and is superimposed on the galactic disc. The 3 and 6 cm radio maps (Norris & Forbes 1995) reveal two distinct, resolved (FWHM ) nuclei and some fainter diffuse radio emission. Separated by in declination, the two cores dominate the radio emission, the northern one being slightly (15%) brighter. The northern core is also the brightest spot in X-rays, while the southern one lies behind a dust lane and is only visible at energies keV. Several point-sources and bright diffuse emission are also present (Ranalli et al. 2003; Lira et al. 2002).

NGC 3256 was observed by XMM-Newton for 130 ks, with 103 ks remaining after cleaning for background flares. The spectrum was modeled as thermal emission plus a power-law to account for the X-ray binaries. The LSF for NGC 3256 is narrower and less energy-dependent than for M82, because of the smaller source extent of the former. Thus it was possible to fit the whole RGS spectrum together. We considered a multi-temperature thermal model for the plasma, plus a power-law for the X-ray binaries. This fitted well the observed spectrum, including the O VIII lines, but it underestimated the O VII triplet at Å. Thus, a set of three narrow Gaussian lines at the O VII energies was added. The resulting parameters for the line intensity ratios are shown in Fig. 2: they show that a CE component is detected on top of the thermal emission, notwithstanding the uncertainties on the parameter.
Some residuals are visible at the energies of the neutral Mg and Si lines, though a proper analysis of their significance has not yet been made. A paper is in preparation on this subject.
4 Microcalorimeters in future missions
Significant advances in the study of CE emission in external galaxies are expected with the future X-ray missions which will feature microcalorimeter detections: both the JAXA-led Astro-H, with a launch date set for year 2013, and Athena, currently under discussion at ESA. This technology was briefly demonstrated with the Suzaku/XRS instrument. On orbit, the XRS achieved a 7 eV resolution at 6 keV (Kelley et al. 2007) when observing the on-board calibration source. However, its cryostat failed just two weeks after the launch, rendering the XRS unusable for astronomical observations.
Microcalorimeters provide a resolution, at energies keV which are of interest for CE phenomena, of the same order of the nominal one of the XMM-Newton RGS for point sources, but without any complication due to the slitless nature of the grating spectrometers such as the RGS, or the Chandra LETGS and HETGS (note, if comparing with Fig. 1, that for M82 the RGS resolution is severely degraded by its large dimensions on the sky). Microcalorimeters also provide spatial resolution, allowing one, for example, to remove detected binaries.
A simulation of the M82 spectrum as observed with the SXS microcalorimeter which is part of the Astro-H instruments is shown in Fig. 3. For simplicity, the model is thermal, with no contribution from CE; this is noticeable from the O VII line shape. The simulated exposure time is 300 ks.
Astro-H, however, has a very large PSF ( arcmin) and will not be able to remove X-ray binaries. Athena, with a planned PSF of arcsec, should be able to remove at least the brightest ones, such as M82-X1 (see Fig.1 in Ranalli et al. 2008), thus enhancing the signal/background ratio for the plasma component of the spectrum.

Acknowledgements.
We warmly thank the Institut d’Astrophysique de Paris (IAP) for support, and T. Montmerle for his kind hospitality. Financial contribution from the agreement ASI-INAF I/009/10/0 is acknowledged.References
- Alton et al. (1999) Alton, P. B., Davies, J. I., & Bianchi, S. 1999, A&A, 343, 51
- Beiersdorfer et al. (2003) Beiersdorfer, P., Boyce, K. R., Brown, G. V., et al. 2003, Science, 300, 1558
- Branduardi-Raymont et al. (2007) Branduardi-Raymont, G., Bhardwaj, A., Elsner, R. F., et al. 2007, A&A, 463, 761
- Chamberlain (1956) Chamberlain, J. W. 1956, ApJ, 124, 390
- Cravens (1997) Cravens, T. E. 1997, Geophys. Res. Lett., 24, 105
- Dennerl et al. (2006) Dennerl, K., Lisse, C. M., Bhardwaj, A., et al. 2006, A&A, 451, 709
- Djurić et al. (2005) Djurić, N., Lozano, J. A., Smith, S. J., & Chutjian, A. 2005, ApJ, 635, 718
- Engelbracht et al. (2006) Engelbracht, C. W., Kundurthy, P., Gordon, K. D., et al. 2006, ApJ, 642, L127
- Freedman et al. (1994) Freedman, W. L., Hughes, S. M., Madore, B. F., et al. 1994, ApJ, 427, 628
- Gabriel & Jordan (1972) Gabriel, A. H. & Jordan, C. 1972, in Case studies in atomic collision physics, ed. McDaniel & McDowell No. 2, 209
- Grevesse & Sauval (1998) Grevesse, N. & Sauval, A. J. 1998, Space Science Reviews, 85, 161
- Griffiths et al. (2000) Griffiths, R. E., Ptak, A., Feigelson, E. D., et al. 2000, Science, 290, 1325
- Heckman et al. (1990) Heckman, T. M., Armus, L., & Miley, G. K. 1990, ApJS, 74, 833
- Kaneda et al. (2010) Kaneda, H., Ishihara, D., Suzuki, T., et al. 2010, A&A, 514, A14
- Kelley et al. (2007) Kelley, R. L., Mitsuda, K., Allen, C. A., et al. 2007, PASJ, 59, 77
- Lallement (2004) Lallement, R. 2004, A&A, 422, 391
- Lehnert et al. (1999) Lehnert, M. D., Heckman, T. M., & Weaver, K. A. 1999, ApJ, 523, 575
- Lira et al. (2002) Lira, P., Ward, M., Zezas, A., Alonso-Herrero, A., & Ueno, S. 2002, MNRAS, 330, 259
- Liu et al. (2011) Liu, J., Mao, S., & Wang, Q. D. 2011, MNRAS, 415, L64
- Mewe et al. (1995) Mewe, R., Kaastra, J. S., & Liedahl, D. A. 1995, ApJ, 6
- Norris & Forbes (1995) Norris, R. P. & Forbes, D. A. 1995, ApJ, 446, 594
- Origlia et al. (2004) Origlia, L., Ranalli, P., Comastri, A., & Maiolino, R. 2004, ApJ, 606, 862
- Ranalli et al. (2008) Ranalli, P., Comastri, A., Origlia, L., & Maiolino, R. 2008, MNRAS, 386, 1464
- Ranalli et al. (2003) Ranalli, P., Comastri, A., & Setti, G. 2003, A&A, 399, 39
- Read & Stevens (2002) Read, A. M. & Stevens, I. R. 2002, MNRAS, 335, L36
- Rieke et al. (1980) Rieke, G. H., Lebofsky, M. J., Thompson, R. I., Low, F. J., & Tokunaga, A. T. 1980, ApJ, 238, 24
- Seaquist & Odegard (1991) Seaquist, E. R. & Odegard, N. 1991, ApJ, 369, 320
- Smith et al. (2001) Smith, R. K., Brickhouse, N. S., Liedahl, D. A., & Raymond, J. C. 2001, ApJ, 556, L91
- Strickland & Heckman (2007) Strickland, D. K. & Heckman, T. M. 2007, ApJ, 658, 258
- Tsuru et al. (2007) Tsuru, T. G., Ozawa, M., Hyodo, Y., et al. 2007, PASJ, 59, 269