Emergence of Plasmaronic Structure in the Near Field Optical Response of Graphene
Abstract
The finite momentum optical response of graphene can be probed with the innovative technique of infrared nanoscopy where mid-infrared radiation is confined by an atomic force microscope cantilever tip. In contrast to conventional optical absorption which primarily involves Dirac fermions with momentum near the Fermi momentum, , for finite , has the potential to provide information on many body renormalizations and collective phenomena which have been found at small near the Dirac point in electron-doped graphene. For electron-electron interactions, the low energy excitation spectrum characterizing the incoherent part of the quasiparticle spectral function of Dirac electrons with consists of a flat, small amplitude background which scales with chemical potential and Fermi momentum. However, probing of the states with near will reveal plasmarons, a collective state of a charge carrier and a plasmon. These collective modes in graphene have recently been seen in angle-resolved photoemission spectroscopy and here we describe how they manifest in near field optics.
pacs:
78.67.Wj,73.22.Pr,73.20.MfI Introduction
Since its discovery, graphene continues to provide a rich trove of exotic phenomena arising out of novel charge dynamics which map onto a Hamiltonian for massless Dirac fermions, providing a low energy bandstructure of two linear bands which touch and cross at a so-called Dirac point. Using angular resolved photoemission spectroscopy (ARPES) Bostwick at al. Bostwick et al. (2010) have recently observed, in samples of graphene grown epitaxially on a H-SiC substrate, that the Dirac point splits into two at momentum . A plasmaron ring is observed between the two Dirac points which has its origin in electron-electron interactions (EEI)Hwang and Das Sarma (2008); Polini et al. (2008); Sensarma et al. (2011) and consequently is not part of the bare band description. In metals, the long range nature of the Coulomb interactions provides the mechanism for the formation of long-lived collective charge density oscillations or plasmons. These also exist in grapheneHwang and Das Sarma (2007); Sensarma et al. (2010) although with an altered dispersion relation, i.e., in the long wavelength limit () there is a square root dependence on . As recognized by LundquistLundqvist (1967), charged quasiparticles can interact with the plasmons to form a composite state, termed a plasmaron. It is these composite excitations that provide an understanding of the ARPES data in the region around near the split Dirac point. Other evidence of plasmarons in graphene might be found in the tunneling conductance. The observedZhang et al. (2008); Brar et al. (2010) lifting of the node in the bare band density of quasiparticle states provides evidence of the presence of many-body effectsNicol and Carbotte (2009); Carbotte et al. (2010); LeBlanc et al. (2011); Principi et al. (2011), moreover plasmaronic structures in this region, which scale with chemical potential,LeBlanc et al. (2011); Principi et al. (2011), may underlie the EEI-type features identifiedBrar et al. (2010) in tunneling experiments. Aside from graphene, the elusive plasmaron has been observed in other systems Shay et al. (1971) such as elemental Bi semimetals.Tediosi et al. (2007); Armitage et al. (2010)
Optical spectroscopy provides useful information on charge carrier dynamics and has widely been used to probe the nature of the Dirac quasiparticles in graphene. Many experimental results are reviewed in the paper of Orlita and Potemski.Orlita and Potemski (2010) While most of the observations can be understood qualitatively and even quantitatively with bare bands, some cannot. A prominent example is the absorption spectrum of graphene as described by the real part of its AC conductivity at , . Theory predicts a Drude peak centered about zero photon energy () followed by a region of near zero absorption before a rapid rise to the universal value of at , where is the chemical potential.Gusynin et al. (2007, 2009); Peres et al. (2008) This background remains nearly constant over a large energy range above . The Drude piece comes from intraband absorption [see lefthand side of Fig. 1(b)] and its width is set by the residual scattering rate assumed to be much smaller than . The interband optical transitions, which provide the universal background, begin only at because of Pauli blocking, i.e., Pauli exclusion blocks vertical transitions for photon absorption below this energy due to an occupied final state for [Fig. 1(b), ]. One aspect of this bare band picture is not confirmed in experiment. The conductivity never falls below about in the Pauli-blocked region of the spectrum where it would be expected to be almost zero.Li et al. (2008) This has been widely interpreted as evidence for the importance of Coulomb correlations and the electron-phonon interaction which provides phonon-assisted Holstein sidebandsCarbotte et al. (2010); Stauber and Peres (2008) to the main Drude peak. A second contribution comes from equivalent sidebands associated with the rise of the interband optical transitions at .Carbotte et al. (2010)
In this letter, we address the issue of how plasmaronic structures present themselves in the optical conductivity of graphene. Conventional experiments measure the , long wavelength limit, of the AC conductivity . For this case the intraband transitions mainly involve the quasiparticle states at and near momentum in the top Dirac cone, while the interband transitions involve for both upper and lower Dirac cones [lefthand side of Fig. 1(b)]. Consequently, the plasmaron region found around (as we have described) is not directly probed and one does not expect to see a significant signature of the plasmarons in the AC conductivity. However, this is not the case for the finite conductivity.
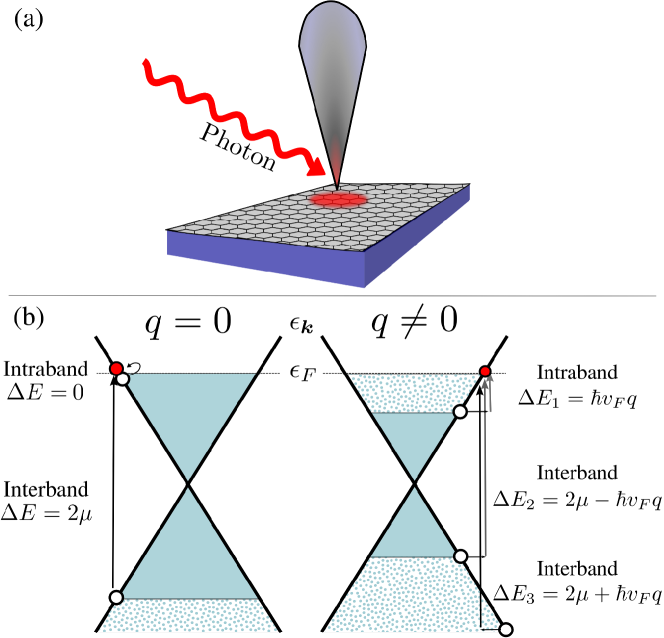
There have been significant advances in infrared nanoscopy which effectively allow for the measurement of the finite optical conductivity as a function of . A cantilever tip of an atomic force microscope (AFM) operating in a tapping mode (as depicted in Fig. 1(a)) allows for the acquisition of near field data containing information on the finite conductivity. In the paper by Fei et al. Fei et al. (2011) a confinement region of nm is achieved providing a distribution of values which peaks around cm-1. As described by these authors, a super sharp silicon tip might reduce the confinement to 10 nm and tips based on carbon nano-tubes to perhaps 1 nm. As an example, one sees from the ARPES data presented in Fig. 2(b) of Bostwick et al.Bostwick et al. (2010) [and shown theoretically here in Fig. 2(a)] that the Fermi momentum, Å-1, for of roughly meV. The plasmaron region falls between 500 and 800 meV and corresponds to a momentum region about of roughly Å-1. To access this region a of order Å-1 is required which is beyond the reach of the tip used by Fei et al.Fei et al. (2011) but in the range that could be achieved with a carbon nanotube tip. However, reducing the doping to obtain a chemical potential of meV would bring the presently available close to the plasmaron region. Indeed, previous optical experimentsLi et al. (2008) were performed on samples on SiO2 substrates with meV. The scaling of the plasmaron feature with implies that the current range of values might already be able to access the plasmaron ring region.
The Kubo formula for the real part of the finite optical conductivity is given in terms of the universal background conductivity by
| (1) |
where is the spectral function of the Dirac fermions and . Here , where and is the angle between and . Note here that differs from that associated with the polarization function, , wherein . While for bare bands with , as seen in Ref. Wunsch et al. (2006), at finite and with interactions this relation does not hold. For graphene, the spectral function can be written in terms of the self-energy for the cones, , as
| (2) |
where the bare band energies are given by . In this work we use the standard G0W-RPA approximationLeBlanc et al. (2011) for the self-energy arising from Coulomb interactions (EEI). We have set and will also set the Fermi velocity when discussing energy transfer. In Fig. 1(b) we show the Dirac cones for finite chemical potential . The plasmaron region which we would like to access falls near and extends to as shown in Fig. 2(a). A crossing occurs between a plasmaron band and a Dirac quasiparticle band in this region. The plasmaron structure in Fig. 2 scales with the value of the chemical potential , and Fermi momentum, , and applies to any . Returning to Fig. 1(b)(right), finite optical transitions are shown in which a hole, depicted as an open circle is created by the light with the excited final state electron at , shown as a solid (red) circle. It is clear from this picture that these new intraband and interband transitions sample states in the Dirac cone down to which approaches the Dirac point at as approaches the Fermi momentum. To be close to, or even inside of, the plasmaron ring region, a momentum of is needed. The overall effect of finite probing is to shrink the Pauli-blocked region towards the Dirac point, thus uncovering the region of -space where plasmarons are most prominent.
Plasmaronic modes and dressed Dirac quasiparticles are found in solutions of the equation
| (3) |
The former are introduced through the interactions and represent new collective modes (or scattering resonance) of a charge carrier plus a plasmon. The contours along which Eq. (3) is satisfied are indicated by the complicated structure shown in Fig. 2(b) with the upper conical region representing the renormalized Dirac quasiparticle branch and the lower cone, the plasmaronic one.Bostwick et al. (2010) This has been probed in detail in ARPES work of Bostwick et al.Bostwick et al. (2010) who also confirm that G0W-RPA theory provides a good description of the spectral function of the Dirac fermions in graphene. A color plot of our own results for the spectral density, , is shown in Fig. 2(a) with emphasis on the region near . One of the motivations of this work is to encourage confirmation of the ARPES results using optical methods.
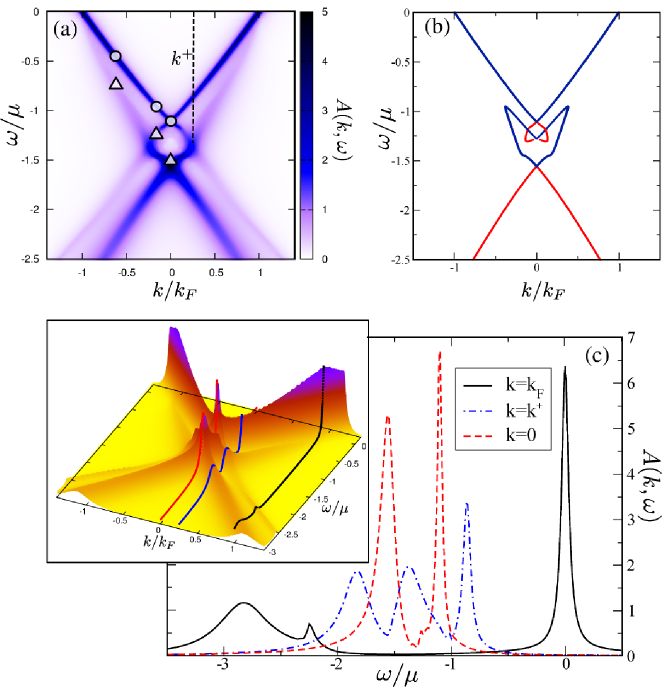
Another representation of the plasmaron structure is shown in the bottom frame of Fig. 2 where we provide in the inset a three dimensional plot of the Dirac carrier spectral density. Around we see a sharp quasiparticle peak with a very diffuse incoherent sideband extending to large energy but always flat and small in amplitude for , as is made clearer in the solid (black) curve of Fig. 2(c). Below there is a plasmaron peak around with a small sideband from Dirac quasiparticles but this appears at large negative energies well within the region of the universal background in optics therefore not of primary interest here. As is reduced the plasmaron structure becomes more prominent in the energy window of interest and the dash-dotted (blue) curve for shows three peaks: the main quasiparticle peak near , a plasmaron peak at and a peak related to the plasmaron ring (the crossing of the plasmaron and main quasiparticle bands) in between. By , two peaks of almost equal magnitude remain in the dashed (red) curve, the upper one marks the quasiparticle Dirac point crossing and the lower, the plasmaron Dirac point. It is this rich structure from towards which would be exciting to access with optics. However, there does not exist a sharp transition in the evolution of as a function of at , but rather the transition is gradual and important structure representative of electron-electron correlations comes into play before and at energies larger than and this is also of great interest.
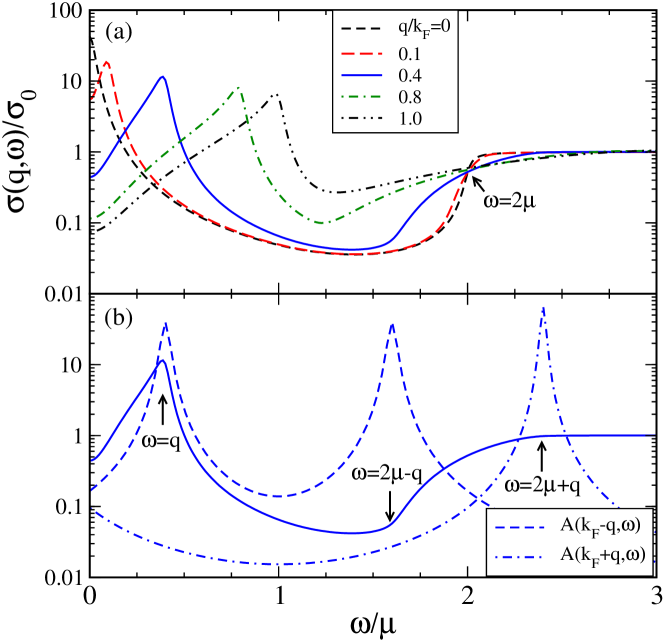
In Fig. 3, we present our results for the finite optical conductivity vs for five values of , 0.1, 0.4, 0.8 and 1.0. The curves are for the case of no EEI. In the numerical work, we have used a constant residual scattering rate, of . The solid black curve for is well known. It has a Drude peak centered about which decays rapidly according to the value of . The region of near zero conductivity is followed with a sharp rise towards the universal value at . As is increased shows a new peak at (recall, here) corresponding to an average of displaced oscillators with which has a maximum value of . This is followed by a drop in the conductivity which becomes progressively less as is increased. There is a point of inflection at , the energy at which the interband transitions begin [see Fig. 1(c)]. Finite provides absorption in the region which would be Pauli-blocked for and this increases with increasing . Another important energy scale is above which the universal plateau shows no depletion and below which there is some reduction. All the curves meet at a single point and this crossing could be used to identify the chemical potential. The first peaks in each of the curves for vs is correlated directly with the quasiparticle peak in the spectral density, (dashed blue curve) of Fig. 3(b). The spectral density is the sum of contributions from the top and bottom Dirac cones so that there are two peaks in . The second peak at high frequency correlates with the onset of the interband transitions. The dashed-dotted curve is and this peak is at where there is a kink in the conductivity. These curves are to be compared with those in Fig. 4(a) which have the same format as the bare band results but include the EEI in Eq. (2). Each curve displays a clear quasiparticle peak displaced from the bare case as a result of the appearance of the real part of the self-energy in Eq. (3). More importantly, new structure (identified by arrows) appears in , not seen in the bare band case and are due to correlation. While such effects are, in principle, also present in the case, they provide only a small modulationsHwang et al. (2012) on the shape of the intraband Drude peak which depends only on electrons with . As seen in the inset of Fig. 2(c), correlation sidebands are very weak for these electrons. But EEI structure is sufficiently sharp to show clearly in the curve. This comes from the plasmaron sideband shown in Fig. 2(a) which grows in amplitude and sharpens as is reduced from to . The optical conductivity for indeed samples the bands converging to the two split Dirac points at and in this case the first peak around is the Dirac point from the main quasiparticle bands (shifted slightly from by the renormalizations) and the second hump around is due to the plasmaron band Dirac crossing. To make our point clear we plot the positions of the peaks in Fig. 4(a) for each on the band structure of Fig. 2(a) using and . These are shown as open triangles (circles) and track the plasmaron (quasiparticle) band. This demonstrates how measurements from optics could be used to trace the renormalized band structure. In Fig. 4(b), the dashed green curve is reproduced from Fig. 3(a) and is shown for easy comparison with the solid green curve for the same which includes EEI. Not only is the quasiparticle peak shifted and a plasmaron shoulder seen, but interactions have filled in the large dip present in the case of the bare bands
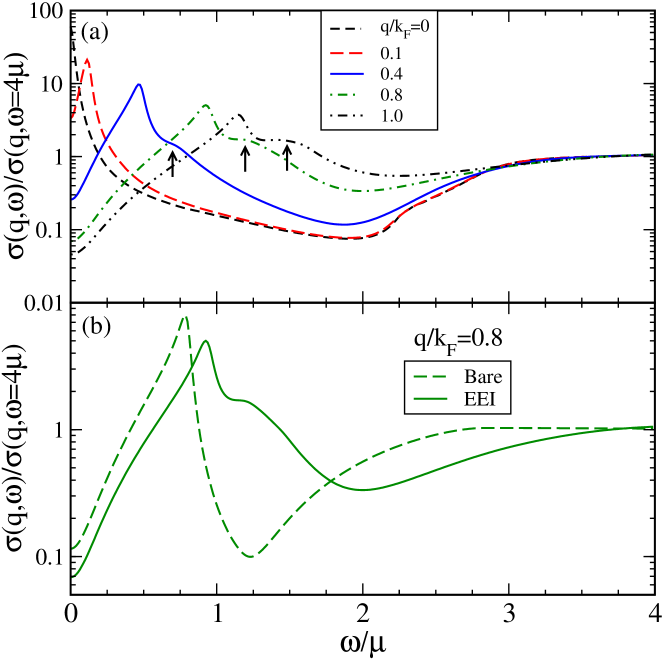
In summary, for the bare bands the intraband optical transitions, which provided a Drude peak in for , are now, for finite values, distributed over an energy range with the dominant peak moved to . This fills the Pauli blocked region of the case. Furthermore, the interband transitions now start at rather than , and the universal background shows some depletion up to . Electron-electron interactions shift the bare band peak at to higher energies, reflecting quasiparticle energy renormalizations. They also provide further filling of the Pauli-blocked region and show easily identifiable new shoulder-like structures which have their origin in the plasmaronic side bands of the Dirac fermion spectral density, . The signature of these modes becomes progressively more prominent as the region about is sampled.
Acknowledgements.
We thank D. N. Basov for helpful discussion. This research was supported in part by NSERC, CIFAR and the NSF under Grant No. NSF PHY05-51164.References
- Bostwick et al. (2010) A. Bostwick, F. Speck, T. Seyller, K. Horn, M. Polini, R. Asgari, A. H. Macdonald, and E. Rotenberg, Science 328, 999 (2010).
- Hwang and Das Sarma (2008) E. H. Hwang and S. Das Sarma, Phys. Rev. B 77, 081412(R) (2008).
- Polini et al. (2008) M. Polini, R. Asgari, G. Borghi, Y. Barlas, T. Pereg-Barnea, and A. H. MacDonald, Phys. Rev. B 77, 081411(R) (2008).
- Sensarma et al. (2011) R. Sensarma, E. H. Hwang, and S. Das Sarma, Phys. Rev. B 84, 041408(R) (2011).
- Hwang and Das Sarma (2007) E. H. Hwang and S. Das Sarma, Phys. Rev. B 75, 205418 (2007).
- Sensarma et al. (2010) R. Sensarma, E. H. Hwang, and S. Das Sarma, Phys. Rev. B 82, 195428 (2010).
- Lundqvist (1967) B. Lundqvist, Phys. Kondens. Materie 6, 193 (1967).
- Zhang et al. (2008) Y. Zhang, V. W. Brar, F. Wang, C. Girit, Y. Yayon, M. Panlasigui, A. Zettl, and M. F. Crommie, Nature Physics 4, 627 (2008).
- Brar et al. (2010) V. W. Brar, S. Wickenburg, M. Panlasigui, C.-H. Park, T. O. Wehling, Y. Zhang, R. Decker, Çağlar Girit, A. V. Balatsky, S. G. Louie, et al., Phys. Rev. Lett. 104, 036805 (2010).
- Nicol and Carbotte (2009) E. J. Nicol and J. P. Carbotte, Phys. Rev. B 80, 081415(R) (2009).
- Carbotte et al. (2010) J. P. Carbotte, E. J. Nicol, and S. G. Sharapov, Phys. Rev. B 81, 045419 (2010).
- LeBlanc et al. (2011) J. P. F. LeBlanc, J. P. Carbotte, and E. J. Nicol, Phys. Rev. B 84, 165448 (2011).
- Principi et al. (2011) A. Principi, M. Polini, R. Asgari, and A. H. MacDonald, arXiv:cond-mat p. 1111.3822v1 (2011).
- Shay et al. (1971) J. L. Shay, W. D. Johnston, Jr., E. Buehler, and J. H. Wernick, Phys. Rev. Lett. 27, 711 (1971).
- Tediosi et al. (2007) R. Tediosi, N. P. Armitage, E. Giannini, and D. van der Marel, Phys. Rev. Lett. 99, 016406 (2007).
- Armitage et al. (2010) N. P. Armitage, R. Tediosi, F. Lévy, E. Giannini, L. Forro, and D. van der Marel, Phys. Rev. Lett. 104, 237401 (2010).
- Orlita and Potemski (2010) M. Orlita and M. Potemski, Semiconductor Science Technology 25, 063001 (2010).
- Gusynin et al. (2007) V. P. Gusynin, S. G. Sharapov, and J. P. Carbotte, Phys. Rev. Lett. 98, 157402 (2007).
- Gusynin et al. (2009) V. P. Gusynin, S. G. Sharapov, and J. P. Carbotte, New Journal of Physics 11, 095013 (2009).
- Peres et al. (2008) N. M. R. Peres, T. Stauber, and A. H. Castro Neto, EPL 84, 38002 (2008).
- Li et al. (2008) Z. Li, E. A. Henriksen, Z. Jiang, Z. Hao, M. C. Martin, P. Kim, H. L. Stormer, and D. N. Basov, Nat. Phys. 4, 532 (2008).
- Stauber and Peres (2008) T. Stauber and N. M. R. Peres, J. Phys.: Condens. Matter 20, 055002 (2008).
- Fei et al. (2011) Z. Fei, G. O. Andreev, W. Bao, L. M. Zhang, A. S. McLeod, C. Wang, M. K. Stewart, Z. Zhao, G. Dominguez, M. Thiemens, et al., Nano Letters 11, 4701 (2011).
- Wunsch et al. (2006) B. Wunsch, T. Stauber, F. Sols, and F. Guinea, New Journal of Physics 8, 318 (2006).
- Hwang et al. (2012) J. Hwang, J. P. F. LeBlanc, and J. P. Carbotte, arXiv:cond-mat p. 1202.1059v1 (2012).