Suppression of inelastic electron-electron scattering in Anderson Insulators
Abstract
We report on measurements of absorption from applied ac fields in Anderson-localized indium-oxide films. The absorption shows a roll-off at a frequency that is much smaller than the electron-electron scattering rate measured at the same temperature in diffusive samples of this material. These results are interpreted as evidence for discreteness of the energy spectrum.
pacs:
72.15.Rn 72.15.Lh 72.20.Ee 73.20.FzInelastic scatterings of electrons play an important role in the properties of Fermi gas systems. The most frequently encountered types of such events are electron-electron (e-e) and electron-phonon (e-ph) scatterings. Energy-exchange via efficient e-e scattering is vital for establishing the Fermi-Dirac distribution, which defines the electron temperature. The electron-phonon inelastic collisions is needed to maintain steady-state situations, and in particular, are responsible for the validity of Ohms law. Either process may lead to de-coherence of the electrons and thus control the quantum effects exhibited by the system.
Both, the e-e inelastic-rate and the e-ph inelastic-rate , are temperature dependent. The specific form of these rates (typically a power-law of the temperature , depend on system dimensionality, temperature range, and the type and degree of disorder. In the thermodynamic limit of diffusive systems however, and at low, yet experimentally accessible, temperatures, is usually larger than 1 .
In this Letter we report on measurements of the energy absorbed by the charge-carriers in Anderson localized indium-oxide films from electric fields as function of frequency . The technique used in this work utilizes a unique property of electron-glasses 2 ; the excess-conductance produced by a non-Ohmic field reflects the energy absorbed by the charge carriers. This technique allows a measurement on systems with very small volume, sensitive enough to allow for weak absorption from electric fields, and most important for this work - can be carried over a large frequency range.
The measurements described below suggest that in the electron-glass is dramatically suppressed relative to its value at the diffusive regime of the same material, and thermalization of the electronic system is presumably governed by . These results may be relevant for testing many-body localization models 3 ; 4 .
The electron-glass samples used in this study were thin films of crystalline indium-oxide (InO) e-gun evaporated on glass substrates. Lateral size of the samples used here were 2 mm long and 1 mm wide. Their thickness (52 Å) and stoichiometry (fine-tuned by UV-treatment 5 ) were chosen such that at the measurement temperatures, the samples had sheet resistance R□ in the range 6 M-12 M. Conductivity of the samples was measured using a two terminal ac technique employing a 1211-ITHACO current preamplifier and a PAR-124A lock-in amplifier. The measurements were performed with the samples immersed in liquid helium at =4.11 K held by a 100 liters storage-dewar. This made it possible to perform measurements of samples while maintaining a stable bath-temperature over the very long period required for the type of experiments described below. Fuller details of sample preparation, characterization, and measurements techniques are given elsewhere 6 ; 7 .
Several sources were used for exciting the system by non-Ohmic fields; the internal oscillator of the PAR124A (up to 2 kHz and 10 Vrms) (Fluke PM5138A (dc and up to 10 MHz and 40 Vpp), and Tabor WS8101 (up to 100 MHz and 16 Vpp).
The main technique used in this study is the ‘stress-protocol’ previously used in aging experiments 8 . The procedure is composed of the following stages: After the sample is equilibrated at the measuring temperature (typically for 20 hours), its conductance versus time is recorded while keeping the electric field = small enough to be as close to the Ohmic regime as possible. This defines a baseline ‘equilibrium’ conductance . Next, is switched to a non-Ohmic which causes the conductance to increase by a predetermined . is kept on the sample for a time , then the field is switched back to and the conductance is continued to be measured for 5. This last stage is depicted in figure 1 as a relaxation of towards the equilibrium with a logarithmic law characteristic of relaxation processes of electron-glasses 2 . A measure of the magnitude of the excess conductance that results from the stress is , defined by extrapolating to 1 second as illustrated in the inset to Fig. 1. is where the origin of time is taken as +1 (i.e., 1 second after is reset to ).
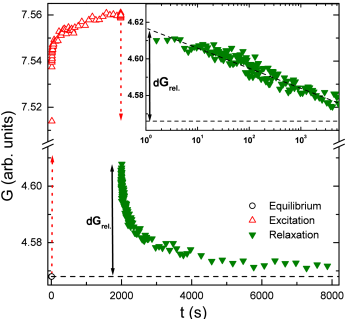
The relaxation of reflects the release of excess energy accumulated during through Joule-heating produced by the field; While is on, the energy absorbed by the electronic system gives rise to an excess phonons within the sample, making it somewhat ‘hotter’ than the bath. A steady-state is established by the flow of energy from the sample-phonons into the thermal-bath. The increased density of high energy phonons (over the phonon population in equilibrium at the bath temperature), randomizes the charge configuration of the electron-glass in a similar vein that raising the bath-temperature would 9 . This is reflected in the sluggish conductance increase during and to the ensuing after the stress is relieved (Fig.1). is used here as a relative measure of the energy absorbed by the electronic system from the stress field (i.e., no quantitative value is assigned to this measure, which, as will be clear below, does not affect our conclusions).
The intriguing finding of this work is the non-trivial dependence of on the frequency of the stress field. In these experiments, the stress-protocol is repeated using fields of different frequencies as described next.
For a meaningful comparison between results of different frequencies, is applied for the same and its amplitude chosen such as to affect the same for each . This procedure then requires a pre-knowledge of the amplitude that achieves the target . This is obtained from plots of taken independently at each frequency to be measured. Examples of plots measured at different frequencies are shown in figure 2.
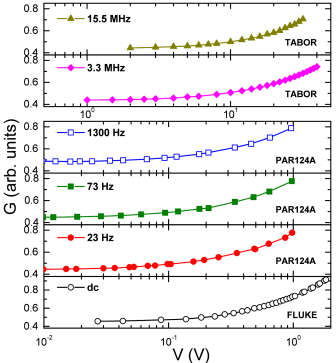
These plots were used in the first series of the stress-protocol experiments where was set to be 0.750.2 at all frequencies using a sample with Ohmic conduction (per-square) =8.3310. Note that the functional dependence of these curves is only weakly dependent on the frequency of the measurement. The that results from the stress protocol at these frequencies, on the other hand, is frequency dependent (figure 3): It is essentially constant (actually, starting from dc which cannot be explicitly shown on Fig. 3) up to some frequency, then it gradually rolls-off, and tends to vanish for 10Hz. Note that this is consistent with the lack of absorption at the microwaves frequencies reported previously 7 .
Also shown in Fig. 3 are the respective results of another sample with Ohmic conduction (per-square at 4.1K) =1.6410. This sample was obtained from the first by UV-treatment, which amounts to a small change of stoichiometry 5 . The two samples have therefore identical geometry, and crystallites-size. They differ in their in their localization length (c.f., Fig. 4 below), and in that G(0)/G0 was set to be 0.650.2 for the second sample. To achieve the targeted G(0)/G the applied voltages during (140010 for both samples), were 1 V(rms) and 0.5 V(rms) for the first and second samples respectively.
The linearity of with was ascertained by measuring at half and twice of the nominal of the series and for both: =23 Hz and =0.8 MHz. It should also be noted that to achieve a constant higher frequencies the field amplitudes across the sample were, if anything, somewhat larger than at low frequencies. Therefore the vanishing values of at high frequencies cannot be due to spurious effects; the sample and its environment (substrate etc.) are the same at all stress frequencies. Also, at the higher frequencies, where of is diminishing with , the electrons are subjected to as large or even larger field amplitudes than used at low frequencies to get the same .
The roll-off frequency of turns out to be of the order of the rate by which energy acquired from the field is dissipated into the bath (presumably, ); Under a bias voltage (dc or low enough ), acting on resistance the following expression may be used to estimate the rate of dissipated energy in a steady state:
| (1) |
Here is the electronic heat-capacity, is the temperature difference between the electronic system and the phonons, and is the rate of energy dissipation. We shall use the free-electron expression: for where210Jm is the thermodynamic density of states at the Fermi energy for InO[5], and is the sample volume ( 1.04 m for our samples). To get a rough estimate for we neglect the difference in temperature between the system and the phonons of the thermal bath, and assume that the conductance of the sample versus temperature (measured under near-Ohmic conditions), reflects the electron temperature 10 . The temperature dependence of is shown in figure 4 for the two samples. Using these data gives for =0.71K for the first sample, and =0.74K for the second sample, which from Eq. 1 we get =3.510 and 7.110 Hz respectively. These rates are somewhat under-estimated for two reasons; disregarding the elevated temperature of the system-phonons, and assuming that the only source for is ‘heating’ (i.e., neglecting the field-assisted hopping contribution 11 ). These omissions overestimate and thus lead to an underestimated rates by about an order of magnitude 12 , still within the region where decays which extends over nearly four decades, presumably reflecting the distribution of . By comparison, the excess conductance in these electron-glasses has been observed to relax over at least six decades in time, and the logarithmic law of this relaxation is suggestive of a wide rate-distribution. Wide rate-distributions are ubiquitous in condensed matter systems, and invariably the underlying reason is disorder. This is a natural occurrence in hopping conductivity; in a realistic system the localization length is distributed over a range determined by the strength (and type) of the quenched disorder. Electronic transition probabilities depend on wave-function overlap, and even on a single-particle level, a mildly wide -distribution may translate into an exponentially wide distribution. This complication may be ignored when dealing with the macroscopic conductance due to its percolative nature but it should be evident in energy relaxation processes.
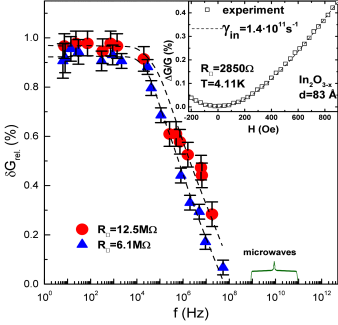
The inability of the electrons to absorb energy from the field is expected when the drive frequency exceeds the maximum rate of their energy-exchange with any available sub-system. In the diffusive regime, is the electron-electron inelastic rate which at low temperatures, is much larger than the electron-phonon inelastic rate . This, in particular, holds true for InOthat has uncommonly high Debye temperature (1050-1100 K 13 ) and thus relatively low in line with the above estimate of 10 at 4 K. The e-e inelastic rate in a two-dimensional (2D) InOfilm with 10 at 4K is of the order of 10. This is based on magneto-conductance measurements and a fit to the weak-localization theory 14 . An example is shown in the inset to Fig. 3. The dephasing rate 1.410, that results from the fit to the theory, is consistent with the Abrahams et al model for e-e inelastic rate 15 . In the diffusive regime and for thin films the theory anticipates that should only increase with disorder . Our experiments suggest that, for sufficiently strong disorder, this trend has been reversed; in both films is smaller than its value in the 3 k sample by at least three orders of magnitude: Note that the technique used here can only put an upper bound on the inelastic rate; it cannot determine the actual which might in fact be much smaller than estimated from the roll-off in Fig. 3.
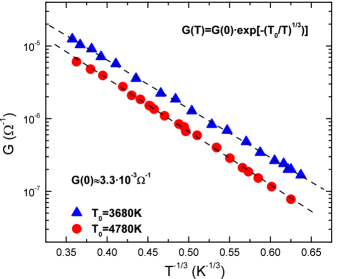
This dramatic suppression in of the same material at 4 K is presumably related to the change in the transport mechanism, which in 2D InOfilms with is diffusive while sample with exhibit variable-range-hopping (VRH). The samples studied here obey Mott’s VRH in 2D, given by where T[] (Fig. 4). Over the temperature range relevant for our experiments the thermal energy is much smaller than the mean level-spacing []. In a non-interacting picture, the inherent discreteness of the energy-spectrum of the system should be evident in the transport when but it is washed-out due to life-time broadening in the limit where the inelastic diffusion length is smaller than . Discreteness is indeed the key to the orders-of-magnitude change in and this may be understood in the following way:
In the simplest scenario, of independent set of electronic states localized over regions with spatial extent the problem is reduced to that of a quantum dot with volume . This case has been studied 16 with the result that is exponentially suppressed once For our samples is about three orders of magnitude larger than the temperature of the measurements, and therefore, should be vanishingly small. Energy exchange between electrons and their thermalization hinge on the existence of another sub-system with a continuous spectrum, e.g., the phonons bath. This single-particle scenario seems to be consistent with our data.
However, an Anderson insulator is not an independent set of quantum dots, and Coulomb interactions cannot be ignored in such a disordered medium with its impaired screening. The samples studied here are electron-glasses, and electron-electron interactions manifestly play a crucial role in their transport properties 17 .
A fundamental question in this context is whether many-body excitations could de-localize the system and render the energy spectrum continuous. These issues were considered by Anderson 18 , Fleishman and Anderson 19 , and recently by Gornyi et al 3 , and Basko et al 4 . For short range interactions (and in a 2D system, lacking a mobility edge) the spectrum is expected to be discrete and thus, at low temperatures, electron can exchange energy among themselves only by virtue of the phonons bath (or another sub-system with a continuous spectrum). In other words, the rate of energy exchange between electrons is effectively limited by the electron-phonon inelastic rate . Our results are also consistent with this, many-body scenario, which is physically more relevant for electron-glasses.
A corollary of many-body-localization is that, at low temperatures, the energy needed for an electron to hop from localized site to localized site must be supplied by a continuous bath. Hopping models traditionally assumed that it is the electron-phonon interaction that is involved. However the magnitude of the pre-exponential factor of (see, e.g., Fig. 4) and its weak temperature dependence have yet to be accounted for by a model based on a phonon-bath. Identifying the nature of the bath that meets the constraints implied by the many experiments published over the last four decades, as well as the one presented here, is a challenge for theory.
This research was supported by a grant administered by the US Israel Binational Science Foundation and by the Israeli Foundation for Sciences and Humanities.
References
- (1) A. Mittal, Quantum Transport in Submicron Structures, Advanced NATO Proceedings Kluwer Academic, Dordrecht, (1996).
- (2) J. H. Davies et al, Phys. Rev. Lett, 49, 758 (1982); M. Grünewald B. Pohlman, L. Schweitzer, and D. Würtz,, J. Phys. C, 15, L1153 (1982); M. Pollak and M. Ortuño, Sol. Energy Mater., 8, 81 (1982); M. Pollak, Phil. Mag. B 50, 265 (1984); G. Vignale, Phys. Rev. B 36, 8192 (1987); M. Müller and L. B. Ioffe, Phys. Rev. Lett. 93, 256403 (2004); C. C. Yu, Phys. Rev. Lett., 82, 4074 (1999); Vikas Malik and Deepak Kumar, Phys. Rev. B 69, 153103 (2004); D. R. Grempel, Europhys. Lett., 66, 854 (2004); Eran Lebanon, and Markus Müller, Phys. Rev. B 72, 174202 (2005); A. Amir, Y. Oreg, and Y. Imry, Annu. Rev. Condens. Matter Phys. 2, 235 (2011).
- (3) I. V. Gornyi, A. D. Mirlin, and D. G. Polyakov, Phys. Rev. Lett. 95, 206603 (2005).
- (4) D. M. Basko, I. L. Aleiner, and B. L. Altshuler, Ann. Phys. (N.Y.) 321, 1126 (2006).
- (5) Z. Ovadyahu, J. Phys. C: Solid State Phys., 19, 5187 (1986); V. Chandrasekhar and R. A. Webb, J. Low Temp. Phys. 97, 9 (1994).
- (6) A. Vaknin, Z. Ovadyahu, and M. Pollak, Phys. Rev. B 65, 134208 (2002).
- (7) V. Orlyanchik A Vaknin, and Z. Ovadyahu, Phys. Stat. Sol., B 230, 67 (2002); V. Orlyanchik, and Z. Ovadyahu, Phys. Rev. Lett., 92, 066801 (2004).
- (8) Z. Ovadyahu, Phys. Rev. B 83, 235126 (2011).
- (9) Z. Ovadyahu, Phys. Rev. Lett., 102, 206601 (2009).
- (10) S. Marnieros, L. Berge, A. Juillard, and L. Dumoulin, Phys. Rev. Lett. 84, 2469 (2000).
- (11) R. M. Hill, Philos. Mag. 24, 1307 (1971); N. Apsley and H. P. Hughes, Philos. Mag. 31, 1327 (1975); B. I. Shklovskii, Fiz. Tekh. Poluprovodn. 6, 2335 (1972) [Sov.Phys. Semicond. 6, 1964 (1973)]; M. Pollak and I. Riess, J. Phys. C9, 2339 (1976).
- (12) This estimate is based on comparison methods used in: Z. Ovadyahu Phys. Rev. B 73, 214208 (2006).
- (13) I. Schwartz S. Shaft, A. Moalem and Z. Ovadyahu, Phil. Mag. B 50, 221 (1984); X. D. Liu E. Y. Jiang, and D. X. Zhang, J. Appl. Phys. 104, 073711 (2008).
- (14) S. Hikami A. I. Larkin, and Y. Nagaoka, Prog. Theor. Phys. 63, 707 (1980).
- (15) Elihu Abrahams P.W. Anderson, P. A. Lee, Phys. Rev. B 24, 6783 (1981).
- (16) Ya. M. Blanter, Phys. Rev. B 54, 12807 (1996).
- (17) A. Vaknin Z. Ovadyahu, and M. Pollak, Phys. Rev. Lett., 81, 669 (1998).
- (18) P. W. Anderson, Phys. Rev. 109, 1492 (1958).
- (19) L. Fleishman and P. W. Anderson, Phys. Rev. B 21, 2366 (1980).