Warm Debris Disks Candidates in Transiting Planets Systems
We have bandmerged candidate transiting planetary systems (from the Kepler satellite) and confirmed transiting planetary systems (from the literature) with the recent Wide-field Infrared Survey Explorer (WISE) preliminary release catalog. We have found 13 stars showing infrared excesses at either 12 m and/or 22 m. Without longer wavelength observations it is not possible to conclusively determine the nature of the excesses, although we argue that they are likely due to debris disks around the stars. If confirmed, our sample doubles the number of currently known warm excess disks around old main sequence stars. The ratios between the measured fluxes and the stellar photospheres are generally larger than expected for Gyr-old stars, such as these planetary hosts. Assuming temperature limits for the dust and emission from large dust particles, we derive estimates for the disk radii. These values are comparable to the planet’s semi-major axis, suggesting that the planets may be stirring the planetesimals in the system.
Key Words.:
planetary systems:planet-disk interactions - stars: planetary systems1 INTRODUCTION
Debris disks are the remnant of the planet formation process. The small detected amounts of dust are produced by collisions among, or evaporation of, planetesimals (e.g. Wyatt, 2008). The dust generated by these processes is easier to detect than the planetesimals themselves.
Debris disks are not rare. According to Trilling et al. (2008), 16% of main-sequence FGK stars have debris disks. The infrared (IR) Spectral Energy Distributions (SEDs) of most stars with debris disks have peaks at 70-100 m, suggesting the presence of relatively cold dust (brightness temperatures 50 K).
Overall, only 4% of solar-type stars have m excess flux, as seen with the Spitzer Space Observatory (Trilling et al., 2008). In most cases, the excess flux represents the Wien edge of longer-wavelength dust emission. However, a few systems (e.g. HD 23514, BD+20307, HD 69830, and Corvi) posses real warm debris disks, and stand out above the envelope of 24m excess flux versus age (Siegler et al., 2007).
The presence of such large 24 m excess at ages above the 100 Myr is problematic since neither the terrestrial-planet formation models by Kenyon & Bromley (2005) nor the steady state asteroid belt planetesimal grinding model by Wyatt et al. (2007), can explain them. Their interpretation requires the warm dust to be very transient in nature. Such stochasticity could be due to dust input from a recent collision of planetesimals or from a recent dynamical instability that essentially launched objects from the outer disks into the inner disks (Absil et al., 2006; Wyatt, 2008). Planets at distances at few AUs of their host star will have a strong impact in their asteroid belts but so far very few host stars with both planets and warm excesses have been found (see Wyatt 2008 for a review on the subject).
In the spring of 2009, the Kepler Mission commenced high-precision photometry on over 150,000 stars, to determine the frequency and characteristics of transiting exoplanets. The target stars are determined by the Kepler Input Catalog (KIC, Latham et al., 2005; Batalha et al., 2010). These are mostly main-sequence G type field dwarfs. On 2011 February, the Kepler Science Team released a list of 1235 candidate planetary systems orbiting around 997 host stars. The age of these stars is uncertain, although their low activity and low rotation velocities suggest Gyr ages (Brown et al., 2011; Muirhead et al., 2011).
The sample of planetary candidates is comprised mostly of objects with periods less than 1 yr. and a wide range of sizes. Analyses by Morton & Johnson (2011) suggest that 90 to 95% of these candidates represent true planetary transits. This large sample of candidates provide us with a unique opportunity to study the incidence of debris disks around a homogeneous sample of planet-hosting candidate stars.
Within this context, on 2011 April the Science Team from Wide-field Infrared Survey Explorer (WISE) released the Preliminary Release Catalog (PRC)111http://wise2.ipac.caltech.edu/docs/release/prelim/ covering 57% of the sky and half of the Kepler field. WISE surveyed the whole sky at 3.4, 4.6, 12, and 22 m (hereafter, W1, W2, W3 and W4).
These two data releases allow us to explore the connection between warm debris disks and transiting planets. In this paper we present the results of a search for warm debris disks, primarily around Kepler transiting planet candidates. Krivov et al. (2011) have presented a similar study using pre-Kepler confirmed transiting systems, and in order to compare our technique with theirs we also include previously known transiting systems 222http://var2.astro.cz/ETD/index.php as described in Poddaný et al. (2010).
This first work aims at identifying bona-fide warm debris disk candidates that can afterwards be confirmed with deeper mid-IR imaging, either from the ground or from space.
2 CANDIDATE SELECTION
2.1 Catalog Matching
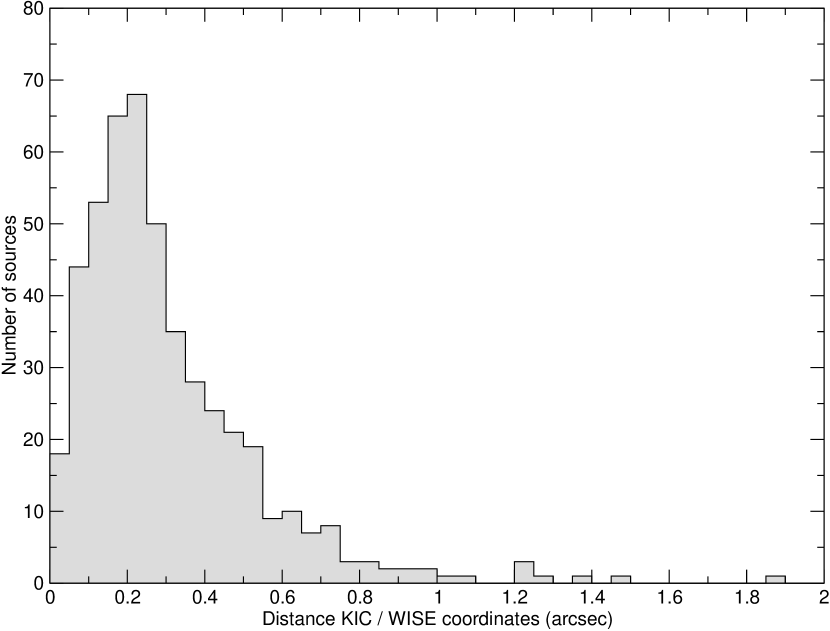
We searched the WISE catalog for counterparts to the 997 Kepler candidates planetary hosts and to the 131 known transiting planet host stars by November 2011 (Poddaný et al., 2010). Figure 1 shows the distribution of separation between the KIC sources and their closest match in the WISE catalogue within 10″. It appears to be roughly normal at short distances with a peak around 0.2″and a standard deviation of 0.2″, which is consistent with the astrometric accuracy of the WISE PRC. Allowing a large search radius greatly increases the probability of spurious matches, but limiting the search radius to a small value would prevent us from detecting real high proper motion objects. As a compromise, we limit the search to within 1″, corresponding to with respect to the peak in the separation distribution. With this process, 546 matches are obtained (468 from the KIC and 78 from the known transiting planets catalog).
Starting from a sample of 93 confirmed transiting hosts from exoplanets.org, Krivov et al. (2011) found 53 counterparts in the WISE sample. They do not describe the details of their matching protocol, but our detection fractions for non-Kepler objects are comparable to theirs, suggesting techniques with similar efficiencies.
2.2 SED Fitting
| Name | Quality | ||
|---|---|---|---|
| KIC 2853093 | 6.1 | 2.2 | 1 - ✓ |
| KIC 9703198 | 4.2 | … | 1 - ✓ |
| KIC 6422367 | 4.0 | … | 1 - ✓ |
| KIC 4918309 | 2.2 | … | 1 - ✓ |
| KIC 6924203 | 2.2 | … | 1 - ✓ |
| KIC 9008220 | 2.2 | … | 1 - ✓ |
| KIC 10526549 | 2.1 | … | 1 - ✓ |
| WASP-46 | 3.2 | … | 2 - Nearby sources in W3 |
| KIC 3732821 | 2.6 | … | 2 - Nearby source in W3 |
| KIC 4545187 | 2.6 | … | 2 - Slight offset in W3 |
| KIC 6665695 | 0.8 | 2.2 | 2 - Nearby sources in W3 and W4 |
| KIC 3547091 | 2.2 | … | 2 - Slight offset in W3 |
| KIC 8414716 | 2.2 | … | 2 - Slight offset in W3 |
| KIC 11288505 | 3.8 | … | 3 - Extended in W3 |
| KIC 6266741 | 3.4 | … | 3 - Extended in W3 |
| KIC 9513865 | 3.3 | 2.5 | 3 - Extended in W3 and W4 |
| KIC 5184584 | 2.2 | 3.1 | 3 - Offset in W3; Extended in W4 |
| KIC 7031517 | 3.0 | … | 3 - Extended in W3 |
| KIC 2309719 | 0.6 | 2.8 | 3 - Extended in W4 |
| KIC 9007866 | … | 2.8 | 3 - Offset in W3 |
| KIC 10963242 | 2.5 | … | 3 - Offset in W3 |
| CoRoT-14 | 2.5 | … | 3 - Artifact in W3 |
| KIC 3833007 | … | 2.4 | 3 - Offset in W3; Extended in W4 |
| KIC 4544670 | 2.4 | … | 3- Extended in W3 |
| KIC 7663405 | 2.3 | … | 3 - Offset in W3 |
| KIC 9214942 | 0.9 | 2.3 | 3 - Offset in W3; Extended in W4 |
| KIC 3642741 | 2.2 | … | 3 - Extended in W3 |
| KIC 9757613 | 1.9 | 2.1 | 3 - Extended in W4 |
| KIC 11446443 | 0.8 | 2.1 | 3 - Offset in W4; TrES-2 |
| HAT-P-5 | 0.6 | 2.1 | 3 - Offset in W4 |
| KIC 6692833 | 1.9 | 2.0 | 3 - Extended in W3 and W4 |
| KIC 9391506 | … | 2.0 | 3 - Offset in W3 and W4 |
| CoRoT-8 | -1.4 | 2.0 | 3 - Offset in W4 |
In order to obtain predictions for the photospheric values, we compared the observed SED in the optical and near IR with stellar models, using the VO SED Analyzer (VOSA, Bayo et al., 2008). VOSA is a tool designed to query VO-compliant theoretical model spectra, calculate the synthetic photometry in any given filter set, and then perform minimization to determine a best fit to the data. We chose to compare the observed SEDs with the grid of Kurucz ATLAS9 models (Castelli et al., 1997) using effective temperatures in the range 3500 9250 K, covering exactly the range of estimated effective temperature in our targets. For all sources, the broadband photometry given as input to VOSA included at least , and from 2MASS (Skrutskie et al., 2006), and the associated WISE photometry. In the case of the Kepler sources, we added the photometry. For the other sources, we added SDSS(Abazajian et al., 2009) and/or Tycho (Høg et al., 2000) photometry for sources within a radius of 1″.
VOSA use as inputs all the photometry available plus an estimate of the interstellar extinction for each source to perform an optimal fit of the photometry to a stellar atmosphere model. We used as input the value of the extinction provided in the KIC, with the extinction law by Cardelli et al. (1989). For the non-Kepler sources, we have assumed =0.0 mag, a good approximation to the actual extinctions, as found by Krivov et al. (2011) in the objects in common.
The fit of the optical and near-IR photospheres is degenerated in the (, Teff) plane. Higher effective temperature stars with higher extinction effectively have a similar observed SED than lower temperature stellar photospheres with less extinction. However, by allowing the extinction to vary as a free parameter, we find typical ranges of 200 K and mags, where the SED fits result in similar values. The best-fit effective temperatures and values computed by VOSA in this way are in excellent agreement with those provided by the KIC, with a scatter smaller than 10%. This confirms that the stellar SED fits are sound and good enough for the purposes of this analysis.
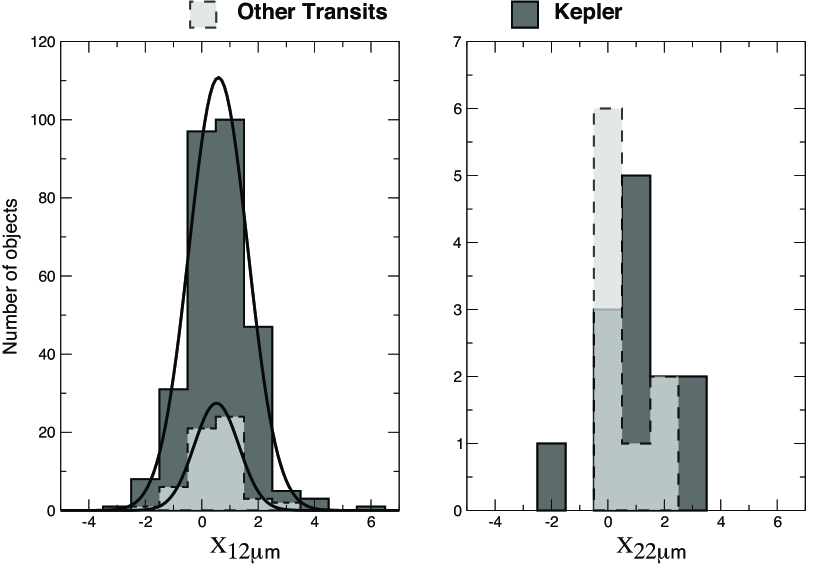
To identify the excess sources, we selected those objects not flagged as extended in the WISE catalog, with signal-to-noise ratios (S/N) 3 at W3, and for which . Here is the detected, de-redenned flux at W3 or W4 band, is the corresponding synthetic flux value obtained from photospheric modeling, and represents the total uncertainty computed as , being the measurement uncertainty in the corresponding band, and the absolute calibration uncertainty of the WISE instrument (2.4, 2.8, 4.5 and 5.7% for W1, W2, W3 and W4 bands respectively as indicated in the Explanatory Supplement to the WISE Preliminary Data Release Products333http://wise2.ipac.caltech.edu/docs/release/prelim/expsup/). The error associated to the fit done by VOSA was estimated by comparing the results obtained using the 5 best fits. The variations of the photospheric synthetic fluxes in the WISE bands were found to be negligible and were therefore not considered. This result in consistent with the negligible values for such uncertainty found by Krivov et al. (2011). The distributions for W3 and W4 are shown in figure 2. We found 33 candidates with in one or both bands.
Given the steep decline of the interstellar extinction law towards the mid-infrared, variations in up to 1 mag in will only raise the WISE fluxes by 6, 5, 7 and 3%, at the W1, W2, W3 and W4 bands, respectively, and therefore cannot dominate the final uncertainty budget. In fact, the intrinsic uncertainties in the and Teff from the SED fitting allow variations of smaller than 0.2 and 0.02 at W3 and W4 bands, respectively. In other words, no reasonable combination of Teff and will make these excesses disappear.
Figure 2 shows the distributions. Both are centred around 0.5, and have a standard deviation of 1. We choose to set a threshold of , corresponding to 1.5 , or a 87 % confidence level, to conservatively define good excesses in both bands. The analysis of the origin of this shift in the excess significance distribution would be premature given the early status of the release of the WISE PRC. It must be noted in any case that the value of our threshold to define an excess has been set arbitrarily to allow us to identify bona-fide excess targets which can then be confirmed by longer wavelength and/or deeper mid-IR ground-based observations. The process will certainly be repeated once the final WISE catalog will be released with the latest updates on calibration and covering the whole Kepler field.
The analysis also identifies excesses at the W1 and W2 bands in KIC 2853093 and KIC 3547091. The interpretation of these as very hot dust emission is problematic, given that Spitzer did not detect large populations of very hot debris disks at the analogous bands (IRAC1 and IRAC2). We do not consider these excess further in our study. We will revisit the issue once the final WISE catalog, with the final photometric reprocessing, is made public.
2.3 Image Inspection
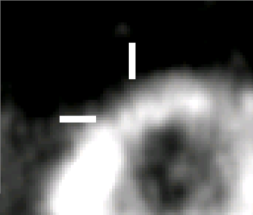
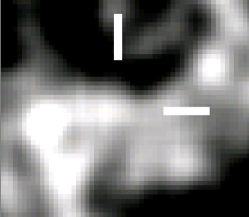
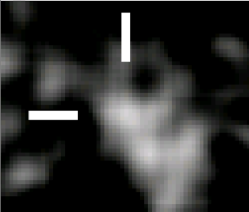
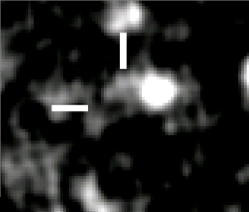
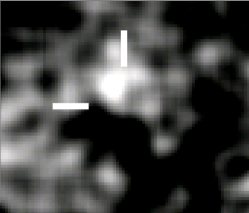
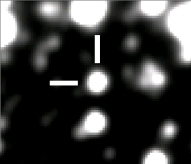
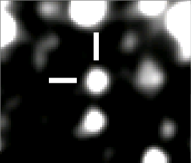
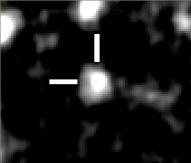
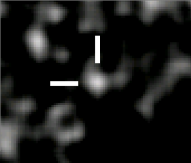
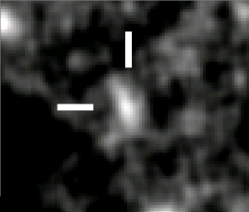
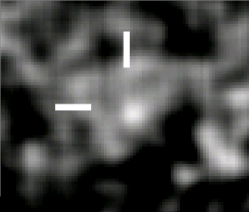
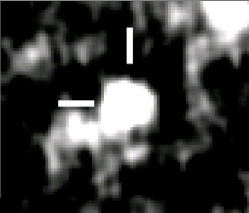
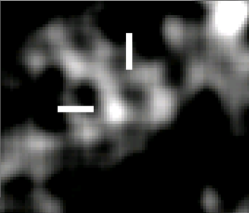
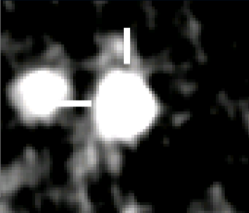
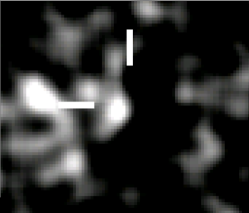
Table 1 lists the 33 host stars with candidate excesses. We examined the WISE images at the bands in which the excesses were present and assigned a quality flag to each candidate as follows: (1) Good, relatively isolated PSF in the band(s) at which the excess is detected; (2) Slight offsets with respect to shorter wavelengths, or slight PSF extension, in the band(s) at which the excess is detected; (3) Rejected: fundamental problems with the band(s) at which the excess is detected. We reject targets based on three issues (see Figure 3):
-
•
Artifacts: This affects only CoRoT-14 (see Fig. 3).
-
•
Offsets: The position of the photocenter changes at the band where excess is found compared to its position at W1 or W2 bands.
-
•
”Extended” PSFs: The photocenter at the band where the excess is found does not appear as a single PSF. This may be because the source is extended, because additional sources are present nearby at the same flux level, or because the source is faint enough that significant noise can contribute to the detection.
In total, we identify 7 objects with quality flag (1) and 6 objects with quality flag (2). Of both sets, twelve objects show IR excesses with at W3, and two sources have at W4 (See Figure 4).
For KIC 9008220, KIC 4918309, and KIC 3547091, the WISE catalog flags the photometry in the W1 and W2 bands as affected by halo features, the outer wings of the PSF around nearby bright stars. Likewise the same bands in KIC 8414714 are flagged as affected by diffraction spikes. None of these issues is apparent in the actual images nor in the SEDs (see below). For KIC 9703198, KIC 8414716, and KIC 2853093 the W4 band is flagged as having 1% of saturated pixels. This does not affect that band’s fluxes and will not affect our analysis.
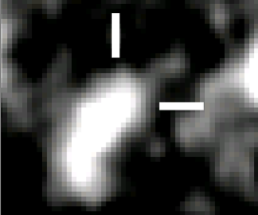
By performing an analogous analysis, Krivov et al. (2011) selected HAT-P-5, and CoRoT-8 as candidate sources with excesses in W4 and TrES-2 and XO-5 as candidates sources with excesses at W3 and W4. However, we do not confirm any of these as excess sources. For TrES-2 (KIC 11446443) we do not detect excess in W3 with high enough significance. The SDSS optical photometry coupled with the VOSA analysis confirms the lower effective temperature reported by O’Donovan et al. (2006) as compared with the higher best-fit temperature found by Krivov et al. (2011). That makes the observed W3 flux not so different from the photospheric value () and therefore we conclude that the excess is not significant. For TrES-2, HAT-P-5, and CoRoT-8 we detect excess in W4 but direct inspection of the WISE images shows that the photocenter is offset with respect to shorter wavelengths (see Figure 5). In the case of XO-5 we do not detect excesses at any band: For W4 we set a more stringent cut-off of 2 and for W3 we again use the SDSS optical photometry, which results in no excess being predicted in the IR. In general, we note that the fits presented by Krivov et al. (2011) yield systematically higher best-fit effective temperatures than published values and poorer fits to the stellar models than the ones we obtained with our Tycho/SDSS photometry and VOSA. Unfortunately, those authors do not report the best-fit extinction values nor explain whether they computed synthetic photometry by convolving the stellar models with the filter passbands. In summary, we cannot confirm any of the objects mentioned in Krivov et al. (2011) as having excesses in the WISE bands.
| Name | ||||||||||
| Quality flag (1) - Single isolated clean PSF | ||||||||||
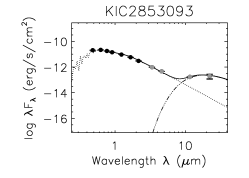
| KIC~2853093 / KOI~1099 | G6 | 0.573 | 1300 | 7.11.0 | 6.1 | 58.728.2 | 2.2 | 200 | 1.0 | 6.5 |
| KIC~4918309 / KOI~1582 | G9 | 0.626 | 1020 | 2.70.7 | 2.2 | … | ||||
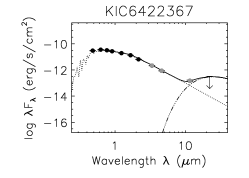
| KIC~6422367 / KOI~559 | K0 | 0.052 | 660 | 2.50.4 | 4.0 | … | ||||
| KIC~6924203 / KOI~1370 | G8 | 0.071 | 910 | 2.10.6 | 2.2 | … | ||||
| KIC~9008220 / KOI~466 | G1 | 0.087 | 1100 | 2.10.5 | 2.2 | … | ||||
| KIC~9703198 / KOI~469 | G0 | 0.095 | 1200 | 3.20.5 | 4.2 | … | ||||
| KIC~10526549 / KOI~746 | K3 | 0.080 | 570 | 1.70.4 | 2.1 | … | ||||
| Quality flag (2) - Possible source confusion or weak detection at W3 or W4 | ||||||||||
| WASP-46 | G6 | 0.024 | 520 | 1.50.3 | 3.3 | … | ||||
| KIC~3547091 / KOI~1177 | G9 | 0.043 | 1080 | 2.90.9 | 2.2 | … | ||||
| KIC~3732821 / KOI~1207 | K1 | 0.111 | 720 | 2.40.6 | 2.6 | … | ||||
| KIC~4545187 / KOI~223 | K0 | 0.041, 0.226 | 600 | 1.90.3 | 2.6 | … | ||||
| KIC~6665695 / KOI~561 | K1 | 0.058 | 430 | 1.10.2 | 0.8 | 12.85.7 | 2.2 | 100 | 4.8 | 1.9 |
| KIC~8414716 / KOI~910 | K1 | 0.057 | 850 | 2.50.7 | 2.2 | … | ||||

3 POSSIBLE EXPLANATIONS FOR THE INFRARED EXCESS
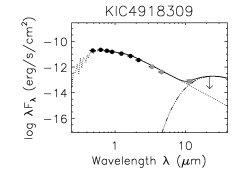
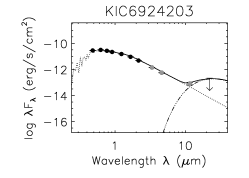
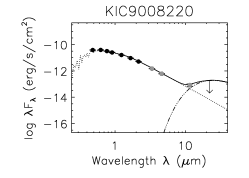
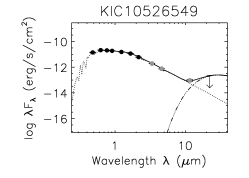
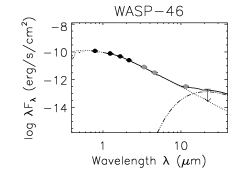
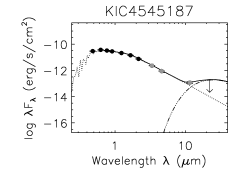
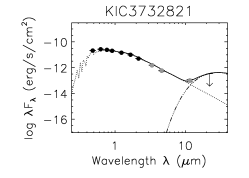
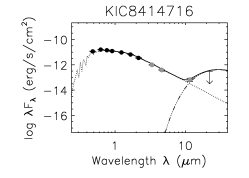
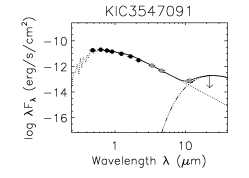
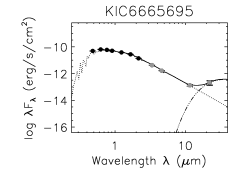
As shown in Fig. 6, the IR portion of the SEDs cannot be fitted by a pure photosphere. We characterize the excess by the color temperature obtained when fitting a single blackbody function that reproduces the excesses at W3 and the detections or upper limits in W4 (see Tab. 2). Lack of substantial excesses at W2 or shorter wavelengths implies upper limits to the dust color temperatures of 500 K. We explicitly refrain from including in our analysis the potential excesses found in two sources at W1 and W2 bands until the final WISE catalog has been released and there is a better understanding of the uncertainties at those bands for these sources.
The observed IR excess could be due to: (1) The contribution of a cool companion; (2) The random alignment with a foreground object; (3) A background galaxy; (4) Interaction between the host star and an interstellar medium (ISM) cloud; (5) A Debris Disk. We now examine each of these possibilities.
To reproduce the color temperature, a cool companion would need to be a Y-dwarf like the recently discovered WISE 1541-2250 (Kirkpatrick et al., 2011). With an effective temperature of 300-450 K, such an object would produce excess in the W3 and W4 bands, as observed. Using WISE 1541-2250 as template, its W4 magnitude at 430 pc (the distance to the closest candidate) would be 19 mags. From the WISE PRC, the 5 limit at W4 is 8 mags444http://wise2.ipac.caltech.edu/docs/release/prelim/. Therefore, any such cool companion would have to be anomalously bright to contribute to the excess in the IR if bound or happen to be co-aligned with the stars at a distance from the Sun smaller than 45 pc, both of which scenarios are relatively unlikely.
WISE 1541-2250 has an observed W3 magnitude of 12.1 mags, implying dex at 12 m. As shown in Fig. 6 this is comparable to the excess fluxes we detect. The work by Kirkpatrick et al. (2011) used all-sky WISE data to search for Y-dwarfs and found 6 confirmed objects. Assuming they are uniformly distributed in the sky, the probability of finding one within 100 squared-arcseconds of one of our targets is a few parts in a million. Therefore we consider this explanation to be very unlikely as well.
In principle, a background galaxy could be responsible for the IR excess. We searched the NASA Extragalactic Database (NED) for any galaxy within 10” of the candidates and found none. Furthermore, Spitzer’s MIPS galaxy counts at 24 m indicate that we can expect infrared luminous galaxies brighter than 5 mJy at 24 m on average within 10” of any of our sources (Papovich et al., 2004). As in the previous cases, this scenario is found to be too improbable to explain the IR excesses.
The interaction with an ISM cloud is a more realistic possibility. Given that the candidates are located beyond the Local Bubble, the IR excess may be due to the so-called Pleiades Effect, the random alignment between a clump of interstellar medium and a star (Kalas et al., 2002). The role of this effect is difficult to estimate a-priori, as dust maps do not have the required spatial resolution. Kalas et al. (2002) have shown that the ISM dust would emit mostly at longer wavelengths, although populations of very small particles may result in shorter wavelength emission. Mid-IR spectroscopic observations will clarify the particle size of the dust responsible for the excess, and longer wavelength observations may help rule out the role of ISM altogether. With the data at hand, it is not possible to rule out this phenomenon.
4 DEBRIS DISKS IN THE TRANSITING PLANET SAMPLE
By assuming that the IR excess is due to the presence of a debris disk made up of large particles, we derive distances between the star and the dust using its conection with the luminosity of the host star given by equation 3 in (Wyatt, 2008). The distances we obtain are comparable to the planetary semi-major axis (see Tab. 2).
These distance estimates depend critically on the assumed particle size. For 0.2 m grains, the typical size of the radiation pressure blow-out limit for a G0 star (Krivov et al., 2011), a dust ring 8 AU in radius would have a temperature of 150 K, assuming typical silicate emissivities (see Beichman et al., 2006, and references therein). A better handle on the dust distance can then be obtained by modeling mid-IR spectra of the dust, which will provide estimates of typical grain sizes.
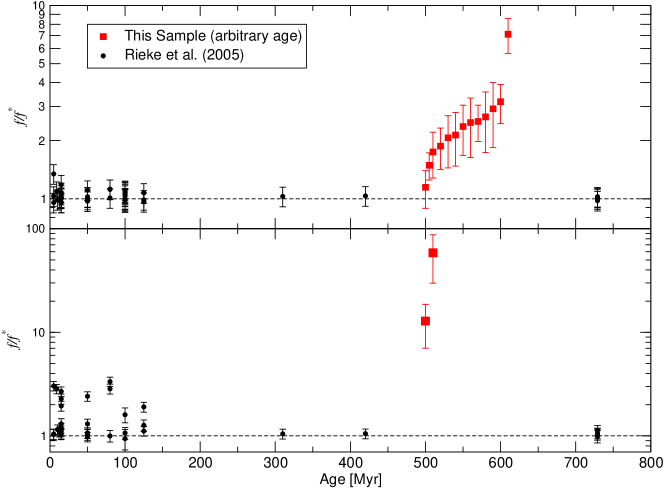
About 2% of the 546 objects considered here show IR excess consistent with the presence of a debris disk. We note however, that the sample is biased by the sensitivity levels of the WISE spacecraft, and therefore this excess fraction cannot be compared to the 4% figure found by Trilling et al. (2008) at m in a volume-limited sample. Furthermore, in most of the objects from that work the m excess represents the short wavelength side of the emission, which peaks at longer wavelengths. In contrast, for the candidates presented here, the excess at 12 m plus the detection or the upper limit at 22 m, allow us to definitely conclude that we are observing warm dust.
The existence of warm IR excess is correlated with age, appearing at a greater frequency for young stars (Rieke et al., 2005; Siegler et al., 2007; Trilling et al., 2008). However, the KIC sample was explicitly selected to contain only low-activity, large surface gravity (dwarf and sub-giant) stars (Batalha et al., 2010). WASP-46 has an estimated age of 1.4 Gyr (Anderson et al., 2011). At these ages, most stars do not present excess at 24 m (e.g. Siegler et al., 2007). In order to present a preliminary comparison of the WISE results presented here with the literature on debris disk decay, we performed a search for WISE counterparts to the Spitzer 24m objects from Rieke et al. (2005). Following the same procedure mentioned above for the transiting planet sample, we obtained excesses at 12 and 22 m for the Rieke et al. (2005) targets. As shown in Figure 7 the excesses for the WISE targets are well above the expected excesses due to debris disks of comparable ages.
We note here that this is a preliminary comparison, based on the small sample of Spitzer objects with excesses at the WISE wavelengths and the photometry from the WISE PRC. However, it is remarkable that we should find such large excesses in the transiting planet sample. The objects presented here seem to be analogous, in terms of Fλ/F∗, to objects like Corvi (Lisse et al., 2011), HD 69830, BD+20307, and HD 23514 (Wyatt, 2008).
However, the values of as listed in Table 2 are small compared to those from other hot disks like Corvi () or HD 69830 (). Wyatt et al. (2007) provide an estimate for the maximum fractional excess that one could expect as a function of age (see their equation 21). For a 1 Gyr-old star, this number varies between for dust at 1 AU, and for dust at 10 AU. Our targets have -values comparable to the later number, so it is not impossible that we are seeing dust produced by very massive asteroid belts.
If the particles are relatively large, and the dust belts are closer to their central stars, we enter the realm of parameter space comparable to other warm disks. Two different origins for hot dust have been proposed: either it is due to a recent collision between two large planetesimals in an asteroid belt (Song et al., 2005), or it is derived from a planetesimal belt further from the star where the mass required to sustain the inferred mass-loss rate can survive for long periods of time (Absil et al., 2006; Wyatt et al., 2007).
Without further data we cannot weight on this debate. However, we note that the presence of large planetesimals close to the star or the existence of a dynamical instabilities analogous to the Late Heavy Bombardment in our Solar System may be the consequence of the presence of the transiting planets. An explanation for the excess in HD 69830 may be in its three Neptune-mass planets (Lovis et al., 2006). Other studies have failed to find any correlation between the presence of planets and the existence of cold debris disks Kóspál et al. (2009); Bryden et al. (2009), but our results suggest that the presence of transiting planets in a warm debris system may cause the stirring of the disk, resulting in increased dust production detectable in the WISE bands in these systems. Whether this is because the planets perturb asteroidal disks, favor the orbital decay of planetesimals from farther away, or perturb far-away planetesimals is unclear. It is also unclear whether this happens in non-planet systems.
In conclusion, longer-wavelength photometric and spectroscopic observations are crucial for the further characterization of these systems. The Kepler and WISE samples are veritable goldmines in the study of planet formation and we have just begun scratching the surface.
5 CONCLUSIONS
We present a new sample of 13 transiting planets systems with significant () IR excess at 12 and/or 22 m obtained matching the Kepler Input Catalog and a sample of previously known transiting planets hosts with the WISE Preliminary Release Catalog (PRC) in the overlapping areas. We describe in detail the quality control procedure applied to identify trustworthy excesses in the sources, which includes estimates of significance of the excesses and inspection of the individual WISE images. We further conclude that the IR excesses identified by Krivov et al. (2011) may be spurious. This process will be repeated once the final WISE all-sky point source catalog is released and covers the whole Kepler field.
While we cannot rule out that this excess is due to ISM clumps illuminated by the stars, we assume that they are due to debris disks. Assuming large dust particles, the SEDs are consistent with inner disk radii comparable to the planets semi-major axes. The infrared excess as fraction of stellar flux is larger than expected for old field stars, and we suggest that the planets are stirring the disks.
Acknowledgements.
We thank the referee for valuable comments that helped improving the contents of this paper. This work has been possible thanks to the support from the ESA Trainee and ESAC Space Science Faculty and of the Herschel Science Centre. This publication is based on observations made with the Kepler Spacecraft. Funding for this mission is provided by National Aeronautics and Space Administration’s Science Mission Directorate (NASA). This study also makes use of VOSA, developed under the Spanish Virtual Observatory project supported from the Spanish MICINN through grant AyA2008-02156; data products from the Wide-field Infrared Survey Explorer, a joint project of the University of California, Los Angeles, and the Jet Propulsion Laboratory (JPL) / California Institute of Technology (Caltech); the NASA Infrared Processing and Analysis Center (IPAC) Science Archive and the NASA/IPAC/NExScI Star and Exoplanet Database, operated by JPL/Caltech, and funded by NASA; the SIMBAD database and the Vizier service, operated at the Centre de Données astronomiques de Strasbourg, France; the data products from the Two Micron All Sky Survey (2MASS), a joint project of the University of Massachusetts and IPAC/Caltech, funded by NASA and the National Science Foundation; the Multimission Archive at the Space Telescope Science Institute (MAST). STScI is operated by the Association of Universities for Research in Astronomy, Inc., under NASA contract NAS5-26555. Support for MAST for non-HST data is provided by the NASA Office of Space Science via grant NNX09AF08G and by other grants and contracts.References
- Abazajian et al. (2009) Abazajian, K. N., Adelman-McCarthy, J. K., Agüeros, M. A., et al. 2009, ApJS, 182, 543
- Absil et al. (2006) Absil, O., di Folco, E., Mérand, A., et al. 2006, A&A, 452, 237
- Anderson et al. (2011) Anderson, D. R., Collier Cameron, A., Gillon, M., et al. 2011, ArXiv e-prints
- Batalha et al. (2010) Batalha, N. M., Borucki, W. J., Koch, D. G., et al. 2010, ApJ, 713, L109
- Bayo et al. (2008) Bayo, A., Rodrigo, C., Barrado Y Navascués, D., et al. 2008, A&A, 492, 277
- Beichman et al. (2006) Beichman, C. A., Tanner, A., Bryden, G., et al. 2006, ApJ, 639, 1166
- Borucki et al. (2011) Borucki, W. J., Koch, D. G., Basri, G., et al. 2011, ApJ, 736, 19
- Brown et al. (2011) Brown, T. M., Latham, D. W., Everett, M. E., & Esquerdo, G. A. 2011, AJ, 142, 112
- Bryden et al. (2009) Bryden, G., Beichman, C. A., Carpenter, J. M., et al. 2009, ApJ, 705, 1226
- Cardelli et al. (1989) Cardelli, J. A., Clayton, G. C., & Mathis, J. S. 1989, ApJ, 345, 245
- Castelli et al. (1997) Castelli, F., Gratton, R. G., & Kurucz, R. L. 1997, A&A, 318, 841
- Høg et al. (2000) Høg, E., Fabricius, C., Makarov, V. V., et al. 2000, A&A, 355, L27
- Kalas et al. (2002) Kalas, P., Graham, J. R., Beckwith, S. V. W., Jewitt, D. C., & Lloyd, J. P. 2002, ApJ, 567, 999
- Kenyon & Bromley (2005) Kenyon, S. J. & Bromley, B. C. 2005, AJ, 130, 269
- Kirkpatrick et al. (2011) Kirkpatrick, J. D., Cushing, M. C., Gelino, C. R., et al. 2011, ApJS, 197, 19
- Kóspál et al. (2009) Kóspál, Á., Ardila, D. R., Moór, A., & Ábrahám, P. 2009, ApJ, 700, L73
- Krivov et al. (2011) Krivov, A. V., Reidemeister, M., Fiedler, S., Löhne, T., & Neuhäuser, R. 2011, MNRAS, L322
- Latham et al. (2005) Latham, D. W., Brown, T. M., Monet, D. G., et al. 2005, in Bulletin of the American Astronomical Society, Vol. 37, American Astronomical Society Meeting Abstracts, 110.13
- Lisse et al. (2011) Lisse, C. M., Wyatt, M. C., Chen, C. H., et al. 2011, ArXiv e-prints
- Lovis et al. (2006) Lovis, C., Mayor, M., Pepe, F., et al. 2006, Nature, 441, 305
- Morton & Johnson (2011) Morton, T. D. & Johnson, J. A. 2011, ApJ, 738, 170
- Muirhead et al. (2011) Muirhead, P. S., Hamren, K., Schlawin, E., et al. 2011, ArXiv e-prints
- O’Donovan et al. (2006) O’Donovan, F. T., Charbonneau, D., Mandushev, G., et al. 2006, ApJ, 651, L61
- Papovich et al. (2004) Papovich, C., Dole, H., Egami, E., et al. 2004, ApJS, 154, 70
- Poddaný et al. (2010) Poddaný, S., Brát, L., & Pejcha, O. 2010, New A, 15, 297
- Rieke et al. (2005) Rieke, G. H., Su, K. Y. L., Stansberry, J. A., et al. 2005, ApJ, 620, 1010
- Siegler et al. (2007) Siegler, N., Muzerolle, J., Young, E. T., et al. 2007, ApJ, 654, 580
- Skrutskie et al. (2006) Skrutskie, M. F., Cutri, R. M., Stiening, R., et al. 2006, AJ, 131, 1163
- Song et al. (2005) Song, I., Zuckerman, B., Weinberger, A. J., & Becklin, E. E. 2005, Nature, 436, 363
- Trilling et al. (2008) Trilling, D. E., Bryden, G., Beichman, C. A., et al. 2008, ApJ, 674, 1086
- Wyatt (2008) Wyatt, M. C. 2008, ARA&A, 46, 339
- Wyatt et al. (2007) Wyatt, M. C., Smith, R., Greaves, J. S., et al. 2007, ApJ, 658, 569