The Invisible Monster Has Two Faces:
Observations of Aurigae with the Herschel Space Observatory
Abstract
We present Herschel Space Observatory photometric observations of the unique, long-period eclipsing binary star Aurigae. Its extended spectral energy distribution is consistent with our previously published cool (550 K) dust disk model. We also present an archival infrared spectral energy distribution of the side of the disk facing the bright F-type star in the binary, which is consistent with a warmer (1150 K) disk model. The lack of strong molecular emission features in the Herschel bands suggests that the disk has a low gas-to-dust ratio. The spectral energy distribution and Herschel images imply that the 250 GHz radio detection reported by Altenhoff et al. is likely contaminated by infrared-bright, extended background emission associated with a nearby nebular region and should be considered an upper limit to the true flux density of Aur.
Subject headings:
stars: AGB and post-AGB — binaries: eclipsing — circumstellar matter — stars: individual (Epsilon Aurigae)1. Introduction
In Hoard et al. (2010) (henceforth, Paper I), we provide a summary of previous results on Aurigae, the eclipsing binary star with the longest known orbital period (27.1 yr), and introduce an empirical model for this system. Our model was constrained by a spectral energy distribution (SED) spanning three orders of magnitude in wavelength, from the far-ultraviolet to the mid-infrared, assembled from new and archival ground- and space-based observations. We established the nature of Aur as a large ( R⊙), but low mass ( M⊙), post-asymptotic giant branch F-type star orbiting a B5 main sequence star surrounded by a large ( AU), cool (550 K) dust disk. Subsequent to Paper I, a number of authors have further illuminated the Aur disk (e.g., Stencel et al. 2011, Budaj 2011, Chadima et al. 2011, Takeuti 2011), highlighting common threads pointing to agreement with the low mass scenario and existence of discrete optically thick and thin disk components. Kloppenborg et al. (2010) even obtained near-infrared interferometric images of the disk passing across the face of the F star during eclipse ingress, which have enabled better constraints on the characteristics of the optically thick disk component.
The Paper I SED was constructed primarily from data obtained close in time to the latest (2009–2011) or previous (1982–1984) primary eclipse of Aur. As such, it represents a view of the unilluminated “back” side of the disk relative to the F star. We now present an expansion of the Paper I SED through another order of magnitude of wavelength, via new observations with the Herschel Space Observatory111Herschel is an ESA space observatory with science instruments provided by European-led Principal Investigator consortia and important participation from NASA. (Pilbratt et al., 2010). We also explore the properties of the “front” side of the disk (i.e., the side facing – and directly illuminated by – the F star) via archival observations obtained at orbital phases around disk opposition.
2. Observations
We observed Aur with the Photodetector Array Camera and Spectrometer (PACS; Poglitsch et al. 2010) and Spectral and Photometric Imaging Receiver (SPIRE; Griffin et al. 2010) on Herschel (Open Time Cycle-1 program “OT1_hoard_1”). These observations were accomplished on 9–10 Sep 2011 UT (PACS) and 21 Sep 2011 UT (SPIRE), shortly after the end of the optical eclipse in early July 2011 (Stencel et al., 2011). The observations consist of 2, 2, and 4 “mini-scan maps” of 10 repetitions in each of the PACS B (B1; 70 m), G (B2; 110 m), and R (160 m) bands, respectively, with each pair at cross-scan angles of 70 and 110 degrees, and 8 “small map” repetitions at 250, 350, and 500 m for SPIRE.
We first fit each image using a Gaussian profile to precisely determine the source position. We then integrated around this position within apertures of 10, 15, 20, and 22 arcsec for the 70, 110, 160, and 250 m images, respectively ( Aur is not detected in the 350 and 500 m images – see below). The aperture photometry was performed on Level 2 data products (reduction pipeline v7.2.0 for PACS and v7.3.0 for SPIRE) using a custom photometry routine written by D. Ladjal that is based on the DAOPHOT photometry package but with error calculations adapted to bolometers. We applied corrections for both aperture (from the online PACS and SPIRE photometry cookbooks) and color (based on the slope of the photometric points as a function of wavelength).
Figure 1 shows images from each Herschel band, and the photometry is listed in Table 1. The photometric uncertainties are quadrature sums of the absolute measurement errors (0.09%, 0.3%, 1.8%, 21% for 70, 110, 160, 250 m, respectively) and the instrumental and calibration errors (5% for PACS-70, -110; 10% for PACS-160; 15% for SPIRE). As a check of the Herschel photometry, we note that the PACS-70 value differs by only 1% from the Spitzer MIPS-70 value from Paper I (listed here in Table 1), well within their mutual uncertainties (5% and 15%, respectively).
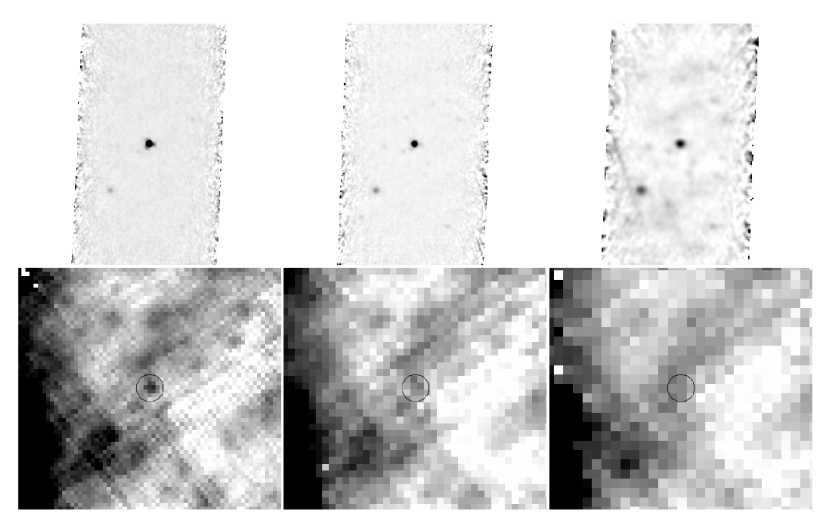
The upper limits in Table 1 at 350 and 500 m are r.m.s. values for each map (in mJy/beam). Inspection of the images suggests that these non-detections can be blamed, at least in part, on the presence of infrared-bright structured background emission, rather than simply faintness of Aur at these wavelengths. This structured background is likely related to the known dark cloud nebular region TGU H1105 (Dobashi et al., 2005) centered 11 arcmin northeast of Aur and extending southward – this is visible as the very bright extended emission along the east edge of the SPIRE maps. The point source visible in the PACS images arcsec southeast of Aur (J2000 coordinates of 05:02:03.6, +43:48:15.9 measured from the PACS-160 image) is likely an embedded star or protostar, since it is not visible in optical (DSS) or near-infrared (2MASS) images222It is also not visible in the Wide-Field Infrared Survey Explorer (WISE) Preliminary Release Atlas images at 3.4 and 4.6 m. A faint source is possibly present at this position in the 12 and 22 m WISE images, but is not listed in the photometry catalog, indicating that, if real, it has S/N7 in both bands and is fainter than and mJy, respectively..
3. Discussion
3.1. Orbital Geometry
The Aur binary orbit has a large eccentricity (0.23; Stefanik et al. 2010). Consequently, times of primary eclipse and opposition phase of the disk do not occur exactly apart, as they would for a circular orbit. Instead, Stefanik et al. (2010) showed that the red-to-blue crossing of the F star radial velocity curve (which is coincident with the photometric eclipse mid-point) occurs after the periastron passage of the disk around the F star, and the blue-to-red crossing occurs another later (e.g., see Figures 1 and 4 in Stefanik et al. 2010). Thus, when using a linear orbital ephemeris with zeropoint at mid-eclipse, the disk opposition occurs at . To determine when the data were obtained relative to the viewing geometry of the binary, we use a linear ephemeris constructed by combining the best orbital period found by Stefanik et al. (2010) with the latest eclipse midpoint date found by Stencel et al. (2011) (see Table 1).
| Wavelength | Instrument/ | Observatory | Date of Observation | Orbital | Flux Density | Reference |
|---|---|---|---|---|---|---|
| (m) | Band | (JD-2400000) | PhaseaaCalculated using the ephemeris JDobs = JD 2455390(10) + 9896(1.6)E (mid-eclipse date from Stencel et al. 2011, orbital period from Stefanik et al. 2010). | (mJy) | ||
| 71.44 | MIPS-70 | Spitzer | 53639, 53790 | 0.83 | 49774 | Paper I |
| 70 | PACS | Herschel | 55814 | 0.043 | 49225 | this work |
| 110 | PACS | Herschel | 55814 | 0.043 | 25413 | this work |
| 160 | PACS | Herschel | 55814 | 0.043 | 10525 | this work |
| 250 | SPIRE | Herschel | 55826 | 0.044 | 5715 | this work |
| 350 | SPIRE | Herschel | 55826 | 0.044 | 60 () | this work |
| 500 | SPIRE | Herschel | 55826 | 0.044 | 57 () | this work |
| 1200 | radio | IRAM 30-m | 47710–47863 | 0.23 | 92 | Altenhoff et al. (1994) |
3.2. Cool Side of the Disk
Figure 2 shows an SED of Aur derived from the one presented in Paper I, but starting in the near-infrared at 1 m. We increased the long wavelength limit compared to Paper I by including both the new Herschel photometry and the 250 GHz radio detection reported by Altenhoff et al. (1994). We also differentiated the data listed in Table 1 of Paper I into two groups that were measured at – (as in Paper I, the SED excludes data obtained during eclipse, at 0.97–0.03; e.g., see Stencel et al. 2011) and at 0.5–0.7. The former data correspond to the cool back side of the disk (facing away from the F star) during pre- and post-eclipse, while the latter were obtained around opposition phase and correspond to the warm front side of the disk (directly facing the F star). The back side data exclude the Taranova & Shenavrin (2001) and Midcourse Space Experiment (MSX) photometry from Paper I (which were obtained at ). The exceptions to this division of the data are the near-infrared photometric points from Paper I, all of which were obtained at orbital phases close to 0.6. However, the disk contribution is less than a few hundredths of a percent of the total model shortward of K (less than 3% even in the warm – hence, bright – disk case; see below); thus, the near-infrared photometry is effectively phase-independent.
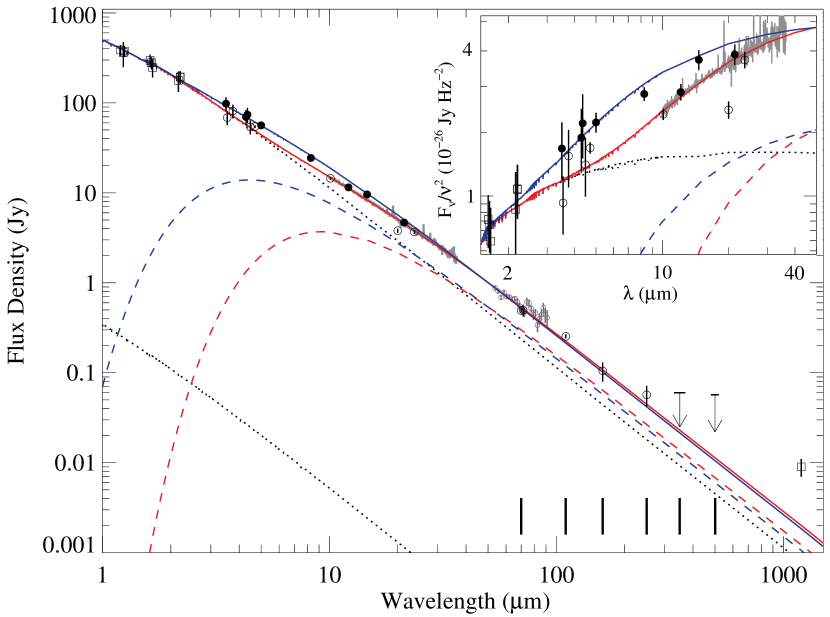
Figure 2 also shows the model from Paper I, extended to 1500 m. This model utilizes a parametric description of a homogeneous, partially transparent dust disk that is characterized by a “transmissivity” (the degree of transparency of the disk) and an “emissivity” (the degree to which light radiated by dust grains inside the disk is visible from outside the disk, not to be confused with the standard emissivity ). Both parameters are simple multiplicative scale factors applied to a single-temperature blackbody disk model. This model is effectively a bulk average over a disk composed of discrete optically thick and thin regions, that minimizes the need to constrain a larger number of parameters corresponding to multiple disk components. The Herschel photometry is completely consistent with the 550 K dust disk model from Paper I; however, the radio point is brighter than the model.
The Aur dust disk almost certainly does contain a mix of optically thick and thin regions; Stencel et al. (2011) and Budaj (2011) have discussed this, and Kloppenborg et al. (2010) have estimated likely geometric parameters for the optically thick component based on their interferometric imaging. Similarly, the actual dust disk should obey a radial temperature profile characterized by higher temperature closer to the central star, even if the observational signature of this is likely to be relatively minimal, as the disk is viewed at high inclination (; Paper I), so its SED is dominated by the geometrically thick edge of the disk. As a first step toward a more “physical” disk model for Aur (a full treatment is beyond the scope of this paper), we modified the detailed dust disk model described in Hoard et al. (2009) and references therein, which was developed for modeling dust disks around white dwarfs and cataclysmic variables, to calculate a two-component (optically thick and thin) model for the Aur disk.
Using the values derived in Paper I and Kloppenborg et al. (2010), we constrained the optically thick component to have outer radius of 3.8 AU, thickness of 0.76 AU, and outer edge temperature of 550 K, with an inclination of at a distance of 625 pc. The inner edge was constrained to have a temperature of 1500 K (the assumed dust sublimation temperature). Given the 15,000 K B5 V central star described in Paper I, and assuming a radial temperature profile exponent of 0.56, this results in an inner disk radius of 0.55 AU, consistent with the discussion in Paper I concerning a possible “hole” in the dust disk where the central star sublimates the dust into gas. The slight increase in the radial temperature profile exponent compared to the expected value of 0.5 (corresponding to the surface of an opaque blackbody disk), suggests that the surface of the disk is not completely opaque down to some geometric depth at which the optical depth becomes large. This is comparable to the effect encapsulated in the “transmissivity” and “emissivity” parameters of the Paper I model.
The optically thin disk component is modeled as a corona or atmosphere of hotter dust grains extending 0.1 AU above and below the optically thick disk component. This component is assumed to be composed of 50-micron silicate (3 g cm-3) grains, constrained to the same inner edge boundary conditions as the optically thick component, but having an outer edge temperature of 1000 K (corresponding to AU). The total mass of dust in this component is M⊕, 1% of the mass estimated by Kloppenborg et al. (2010) for the optically thick disk component in Aur. The combined contribution of these two model components produces a total SED almost indistinguishable from the Paper I cool disk model, differing by, at most, 2.8% (at 5 m) and by less than 1% over 85% of the 1–1500 m wavelength range. Although far from a comprehensive system model for Aur (e.g., it lacks strong constraints on the additional degrees of freedom introduced by the increased physical complexity), the agreement between this calculation and the “bulk-averaged” model from Paper I provides some confidence that the latter is useful for making reasonable estimates of the disk parameters in Aur.
3.3. Warm Side of the Disk
Using the warm side data plotted in Figure 2, we calculated a new version of the Paper I model to reproduce the SED of the front side of the Aur disk (i.e., the side closer to, and directly illuminated by, the F star). This model is identical to the cool disk model shown here and in Paper I, except that the disk temperature is increased to 1150 K and the “emissivity” factor is set to 1.00 (down from 2.43 in the cool disk model). The disk temperature uncertainty, determined by noting the range over which the match between model and data becomes noticeably worse, is 50 K. The 250 GHz radio point (Altenhoff et al., 1994) is still several brighter than the warm disk model, which does not differ significantly from the cool disk model at very long wavelengths. We note in passing that the relatively faint 12 and 20 m MSX points in the warm case data – echoed by the low Q band point from the cool case data – might point to the presence of silicate absorption features that were visible in the orbital cycle leading up to the 1982–1984 eclipse (when the photometric data were obtained) but not, apparently, visible in the IRS spectrum obtained prior to the latest eclipse.
The higher temperature is an expected consequence of irradiation from the F star. The lower “emissivity” might be understood if increased radiation pressure from the F star on the front side of the disk compresses the disk material, effectively increasing its optical depth to the point at which the observable side of the disk at opposition is completely opaque. This opacity change could also account for the steepness of photometric egress compared to ingress – see the light curve in Figure 2b of Stencel et al. (2011). For completeness, we note that an alternative scenario is that the “emissivity” could be if the warm disk emitting area is not completely opaque, but is smaller than the cool side emitting area. Exploring this possibility in a more quantitative fashion is precluded by the sparseness of the data at the longest wavelengths in the warm case SED. As described in Paper I, the disk “transmissivity”, which is unchanged in the warm model compared to the cool model, is primarily important in the ultraviolet and has little effect on the model’s match to the infrared data.
4. Discussion
Takeuti (2011) presents an analytic model for the disk in Aur that accounts for both the geometry and rotation of the disk and irradiation by the F star. In Takeuti’s model, the initial system parameters are based on our empirical disk model from Paper I, but the disk temperature, rather than being defined, is a calculated quantity. For a particular assumed value for the heat capacity of the disk material that produces a temperature of 500 K on the back side of the disk (comparable to the empirical result from Paper I and this work), Takeuti’s model predicts a disk front side temperature of 1200 K, in close agreement with our empirical result of K.
In light of the Herschel extension to the Aur SED, which closely follows the disk model from Paper I and the optically thick/thin model presented here, the Altenhoff et al. (1994) radio detection should be re-examined. Admittedly, we cannot rule out the possible existence of a very cold, or non-thermal, component that contributes significantly only at wavelengths longer than m. In addition, because the radio observation was made at an orbital phase close to disk quadrature, it is unclear whether it is better associated with the cool or warm side of the disk. The long wavelength end of the former is better constrained by data than that of the latter; thus, while the radio point seems incongruous in comparison to the rest of the cool disk SED, again, we cannot rule out that it originates from an unexpected component that is only visible on the warm side of the disk. However, we suggest that a more likely scenario is that the 250 GHz radio detection (which had a half-power beam width of arcsec) is contaminated by – or potentially due solely to – the infrared-bright structured background in the vicinity of Aur visible in the Herschel SPIRE maps (see Figure 1). In that regard, the Altenhoff et al. (1994) value should be considered an extreme upper limit to the true flux density of Aur at this long wavelength. Based on our model, we predict a much lower 1200 m flux density of mJy for Aur.
5. Conclusions
A conclusion that can be drawn immediately from the extended cool disk SED of Aur in Figure 2 is that any potentially bright emission features from molecular species in the PACS and SPIRE bands are minimal, given the adherence to the 550 K disk model. This leads us to suggest that the gas-to-dust ratio in the Aur disk is very low. The disk itself is likely of low mass even when the gas content is included ( M⊙, as suggested in Paper I and Kloppenborg et al. 2010), and is perhaps analogous to the transitional disk in HD 95881 (Verhoeff et al., 2010).
During the course of the several years between the end of primary eclipse (late 2011), disk quadrature (circa 2019), and secondary eclipse (circa 2027), the side of the Aur disk that is directly illuminated and heated by the F star is increasingly visible. Infrared and/or sub-mm observations during this interval, providing longitude by longitude characterization of the disk’s azimuthal temperature profile, can uniquely address disk thermal gradients that are not feasibly observed at any other time until after the next eclipse. We urge observers to seize this rare opportunity.
References
- Altenhoff et al. (1994) Altenhoff, W. J., Thum, C., & Wendker, H. J. 1994, A&A, 281, 161
- Backman et al. (1984) Backman, D. E., Becklin, E. E., Cruikshank, D. P., Joyce, R. R., Simon, T., & Tokunaga, A. 1984, ApJ, 284, 799
- Budaj (2011) Budaj, J. 2011, A&A, 532, L12
- Chadima et al. (2011) Chadima, P., et al. 2011, A&A, 530, A146
- Dobashi et al. (2005) Dobashi, K., Uehara, H., Kandori, R., Sakurai, T., Kaiden, M., Umemoto, T., & Sato, F. 2005, PASJ, 57, 1
- Egan et al. (2003) Egan, M. P., et al. 2003, VizieR Online Data Catalog, 5114, 0
- Griffin et al. (2010) Griffin, M. J., et al. 2010, A&A, 518, L3
- Hoard et al. (2010) Hoard, D. W., Howell, S. B., & Stencel, R. E. 2010, ApJ, 714, 549 (Paper I)
- Hoard et al. (2009) Hoard, D. W., et al. 2009, ApJ, 693, 236
- Kloppenborg et al. (2010) Kloppenborg, B., et al. 2010, Nature, 464, 870
- Pilbratt et al. (2010) Pilbratt, G. L., et al. 2010, A&A, 518, L1
- Poglitsch et al. (2010) Poglitsch, A., et al. 2010, A&A, 518, L2
- Stefanik et al. (2010) Stefanik, R. P., Torres, G., Lovegrove, J., Pera, V. E., Latham, D. W., Zajac, J., & Mazeh, T. 2010, AJ, 139, 1254
- Stencel et al. (2011) Stencel, R. E., et al. 2011, AJ, 142, 174
- Takeuti (2011) Takeuti, M. 2011, PASJ, 63, 325
- Taranova & Shenavrin (2001) Taranova, O. G., & Shenavrin, V. I. 2001, Astronomy Letters, 27, 338
- Verhoeff et al. (2010) Verhoeff, A. P., et al. 2010, A&A, 516, A48