3D projection sideband cooling
Abstract
We demonstrate 3D microwave projection sideband cooling of trapped, neutral atoms. The technique employs state-dependent potentials that enable microwave photons to drive vibration-number reducing transitions. The particular cooling sequence we employ uses minimal spontaneous emission, and works even for relatively weakly bound atoms. We cool 76% of atoms to their 3D vibrational ground states in a site-resolvable 3D optical lattice.
pacs:
37.10.De, 37.10.JkProgress in physics often follows progress in cooling. For instance, the development of laser cooling Adams and Riis (1997) of atoms in the 1980s led to dramatically improved atomic clocks Wynands and Weyers (2005) and to new types of measurements and devices, like accelerometers Peters et al. (2001) and gyroscopes Durfee et al. (2006). The application of evaporative cooling to alkali-metal atoms Davis et al. (1995a); Anderson et al. (1995) in the early 1990s led to the creation of Bose-Einstein condensates Anderson et al. (1995); Davis et al. (1995b), and degenerate Fermi gases DeMarco and Jin (1999). It also relegated laser cooling to a critical but merely intermediate step in many cold atom experiments. Evaporatively cooled atoms have been used to observe a wealth of weakly coupled gas phenomena, as well as such strong coupling phenomena as superfluid-Mott insulator transitions, the BEC-BCS crossover, and 1D and 2D gases Bloch et al. (2008). Some major goals, however, like implementing models of quantum magnetism Esslinger (2010); Simon et al. (2011), and high- superconductivity Hofstetter et al. (2002) require still better cooling, and particularly cooling that works on atoms in an optical lattice. Our 3D projection sideband cooling technique works well on atoms that are only weakly in the Lamb-Dicke limit, so it can be applied to large spacing optical lattices or other optical traps where the occupancy of individual sites can be measured, so site occupation is not a source of entropy. Conceptually similar to Raman sideband cooling Monroe et al. (1995); Kerman et al. (2000); Han et al. (2000), our technique differs in that it uses a state-dependent potential that allows the Raman laser pulses to be replaced by microwaves, adiabatic rapid passage Bloch (1946), independent cooling of each spatial direction, and employment of a sequence with the least possible spontaneous emission. After 3D projection sideband cooling, 76% of the atoms are in their absolute 3D vibrational ground state.
The absolute ground state occupation, , for atoms in deep optical lattices has been made very close to 1 by the elegant approach of evaporative cooling to create a quantum degenerate gas, followed by adiabatic turn-on of an optical lattice past the Mott insulator transition Greiner et al. (2002). Nonzero cooling temperatures and nonadiabaticity lead to site occupation defects. Observing these defects removes the site distribution entropy, but the observation involves polarization gradient laser cooling (PGC), which dramatically decreases Bakr et al. (2010); Sherson et al. (2010). There have been several proposals Rabl et al. (2003); Popp et al. (2006); Williams et al. (2010) and one experiment Bakr et al. (2011) to heal defects without observing them, but these have not yet been demonstrated to improve overall site occupation errors. Better laser cooling is critical to an alternative way to minimize the total entropy per particle, by observing and correcting filling defects, and then laser cooling in the lattice. The ability to cool close to 1 after observing defects is especially important for quantum computing experiments, since unknown occupancy defects lead to severe error Vala et al. (2005) and high temperatures lead to inhomogeneous broadening of gate transitions and high heating rates.
For laser cooling to leave atoms colder than a photon recoil energy, , it must direct atoms toward a state that is not excited during cooling. Atoms irreversibly enter this dark state via spontaneous emission and accumulate there. There is no fundamental limit to . For single ions in Paul traps, Raman sideband cooling routinely achieves Langer (2006). Because atoms in optical lattices are trapped much less tightly than ions in Paul traps and because the optical lattice itself can compromise the dark state in optical lattices, 3D Raman sideband cooling has previously only reached Han et al. (2000), and that was in 400-nm scale lattices, where site occupation has not been resolved.
Projection sideband cooling Weiss et al. (1997), a version of which was recently demonstrated in 1D Förster et al. (2009), accomplishes coherent transfer to a lower vibrational level, , without relying on the momentum of the transferring beam. It requires a state-dependent potential, which we create by rotating the linear polarization of one of a pair of optical lattice beams. This shifts the trap centers for atoms in different magnetic sublevels so that each vibrational wavefunction associated with one magnetic sublevel has a nonzero spatial projection on all the vibrational wavefunctions associated with the other magnetic sublevel. In the resolved sideband limit, microwave photons (or copropagating Raman beams) can therefore drive vibrational transitions directly between any two vibrational levels.
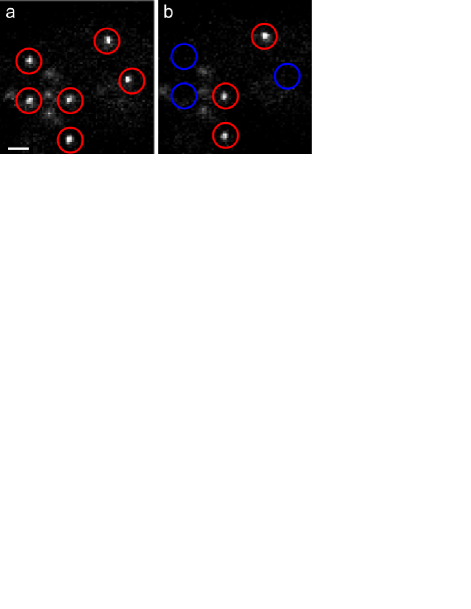
Our apparatus is largely described in Ref. Nelson et al. (2007). We form a 3D optical lattice with lattice spacing using three pairs of blue-detuned 847.8-nm beams (55 mW per beam and beam radii of 65 ) that are from copropagating and linearly polarized perpendicular to their plane of incidence. The path lengths of the two beams in each pair are matched to minimize relative phase fluctuations. The pairs are shifted in frequency relative to each other using acousto-optic modulators to prevent interference among lattice pairs. The vibrational frequencies of the individual lattice sites, , are 16, 16, and 15 kHz in the directions, respectively. Cesium atoms are loaded from a magneto-optic trap and imaged with a 0.55 numerical aperture lens using fluorescence from PGC light. PGC keeps the atoms’ temperature low enough ( or in each direction) that they very rarely thermally hop over the lattice barriers Nelson et al. (2007). The imaging depth of field is short enough () to allow measurement of the site occupancy, which is always either zero or one, of all lattice sites in a plane [see Fig. 1(a)]. Translating the lens axially allows multiple planes to be successively imaged.
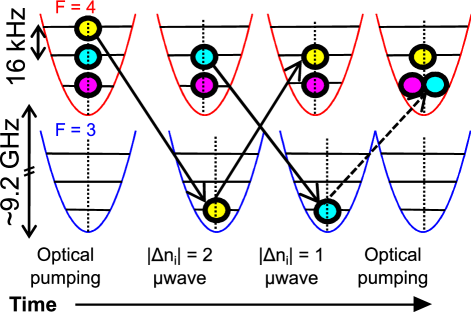
The projection sideband cooling sequence consists of the following steps, described in detail below: optically pump, shift the lattice, apply two microwave pulses, unshift the lattice, and repeat. The goal is to transfer atoms to the dark state. We begin projection sideband cooling (see Fig. 2) by optically pumping atoms into the , stretched state. A uniform magnetic field of 650 mG is applied parallel to the optical pumping beam propagation direction () to define the quantization axis and split the Zeeman sublevels SM (3). Next, using an axial electro-optic modulator followed by a quarter-wave plate, we tilt the linear polarization of one beam by in 1.5 ms so that the potentials for the , and , states are relatively displaced by 35 nm ( half of the harmonic oscillator length). This shift makes the spatial overlap integrals and large enough to support microwave transitions SM (1). We then apply an adiabatic fast passage (AFP) microwave pulse resonant with the transition (hereafter, ) . A second AFP pulse is then applied at the frequency (“ ”), after which the lattice polarization is returned to its initial angle in 1.5 ms. Next, the sequence is repeated using a different axis of lattice translation. As approaches 1, this sequential cooling is much more efficient than cooling a superposition of motional eigenstates and waiting for coherent evolution into other superpositions, especially if the coherent evolution does not provide equal mixing among states. One full cooling cycle takes .
The microwave AFP pulses we use have power and frequency varying with time as and where is the maximum power, is the chirp range, and is the pulse length. The AFP pulse has a measured transfer efficiency of 96(2)% (parentheses indicating the statistical uncertainty in the final digit) and is insensitive to inhomogeneous frequency broadening (up to half of ) and variations in the transition matrix element SM (1).
As in all sideband cooling, the two-pulse sequence does not affect atoms that are initially in the dark state (). The pulses reduce by one for all other atoms. But unlike for a single pulse, all atoms end up in except for those that are initially in and others that fail to make one of the AFP transitions. The sequence thus minimizes spontaneous emission. For instance, if the AFP pulses were perfect, atoms from high lying levels would need only one successful optical pumping cycle per direction to reach the dark state, and these would be from the state, from which atoms are least likely to change vibrational states during optical pumping. By minimizing stochastic fluctuations in , cooling is accomplished in fewer steps. This is especially important when a system is not well in the Lamb-Dicke limit, , where is the optical pumping photon recoil energy. In our experiment, where and it takes an average of three spontaneous emissions to optically pump, there is a 27% probability of changing due to optical pumping from , a probability that increases with initial .
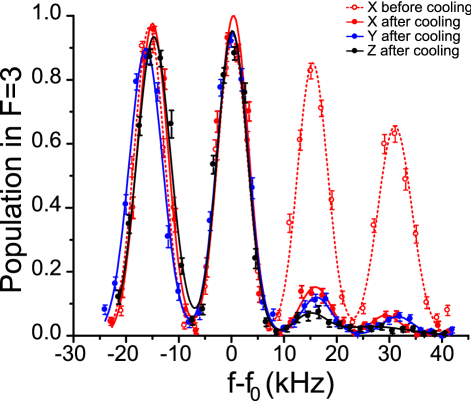
We measure using microwave spectroscopy. We rotate one lattice beam polarization, apply an AFP pulse, and then push the atoms from the lattice with a – laser beam resonant with the to cycling transition for . We then count the atoms that were transferred to the state by the AFP pulse using a fluorescence image [Fig. 1(b)]. Figure 3 shows typical spectra obtained by scanning the center frequency of the AFP pulse, before and after projection sideband cooling. The carrier () and sideband () transitions are resolved. The fraction of atoms that remains after a microwave pulse, normalized by the size of the sideband, indicates the fraction that started in . Similarly, the sideband counts atoms initially in . The steady state projection-cooled values are reached within (see Fig. 4). is 0.90(2) in the and directions and 0.94(3) in the direction. The cooling is anisotropic because the optical pumping beam is in the - plane, and so disproportionately heats in those directions. After cooling, , which roughly corresponds to an in-lattice temperature of 300 nK (the distribution is not quite thermal).

The steady state comes from a balance of cooling and heating rates. We measure the probability of vibrational excitation due to the lattice by using an AFP pulse and clearing sequence that leaves only ground state atoms, waiting, optically pumping back to , and then measuring . We find a 0.020(5) excitation probability per direction per . By holding atoms in the lattice and counting the atoms that depump into the state, we independently measure the optical scattering rate to be 0.08(3) per , which is 13 times more than expected from our blue-detuned standing waves. We suspect the additional scattering is caused by a residual traveling wave component. The measured photon scattering rate accounts for the vast majority of the measured heating out of the dark state. Laser beam measurements show that technical noise (intensity, pointing, and lattice phase fluctuations) heats much less (, , and per (30 ms), respectively). We also measure the probability that cooling inadvertently excites out of the dark state by repeating isolated steps of the cooling cycle, including lattice translation, optical pumping, and AFP pulses. These cooling steps each have probability per of heating atoms out of the dark state. The circular polarization quality of the optical pumping pulse is the closest imperfection to being a problem; we ensure that there is of the wrong circular polarization.
We have performed Monte Carlo cooling calculations using the measured heating rates. Figure 4 compares these calculations with the experimental as a function of the number of cooling cycles. An exponential fit to the experimental data gives a time constant of and a steady state of 0.90(1). The simulation yields 0.957(1), a discrepancy we have not understood. Still, it is fairly clear how to improve on these cooling results. Spontaneous emission, the dominant heating source, decreases inversely with the available lattice power if the lattice depth is kept constant by increasing the detuning. We currently use only 55 mW per beam, so an order of magnitude increased detuning is technically viable. Improved mirror damping can improve the lattice phase fluctuations four-fold, so that it does not become a problem. The probability that the final optical pumping does not succeed in putting atoms in is proportional to , with a proportional decrease in SM (2). A 3D array’s can be halved (from our value of ) and still imaged, and 2D arrays have been imaged with 9 times smaller Sherson et al. (2010). Scaling from our experimental results, we infer that with these trap changes, and without including a possible improvement from shorter , one could achieve and for 3D cooling in 3D and 2D site-resolvable lattices respectively. Cooling would remain in the festina lente limit (optical pumping rate )Castin et al. (1998); Wolf et al. (2000), so rescattered optical pumping light would not be a source of heating.
In conclusion, we have shown that 3D projection sideband cooling with a two-pulse AFP sequence efficiently lowers a trapped atom’s vibrational energy, making it effective at cooling in weak optical traps. We have obtained ground state occupancies that are higher than have been obtained in much tighter lattices. The technique can be used in conjunction with single site imaging resolution to initialize a neutral atom quantum computer. In more closely spaced optical lattices, site occupancy determination followed by projection sideband cooling might be competitive with evaporative cooling as a way to get the lowest entropy atomic ensembles for quantum simulations.
Acknowledgements.
We gratefully acknowledge funding from DARPA.References
- Adams and Riis (1997) C. S. Adams and E. Riis, Prog. Quant. Electr. 21, 1 (1997).
- Wynands and Weyers (2005) R. Wynands and S. Weyers, Metrologia 42, S64 (2005).
- Peters et al. (2001) A. Peters, K. Y. Chung, and S. Chu, Metrologia 38, 25 (2001).
- Durfee et al. (2006) D. S. Durfee, Y. K. Shaham, and M. A. Kasevich, Phys. Rev. Lett. 97, 240801 (2006).
- Davis et al. (1995a) K. B. Davis, M. O. Mewes, M. A. Joffe, M. R. Andrews, and W. Ketterle, Phys. Rev. Lett. 74, 5202 (1995a).
- Anderson et al. (1995) M. H. Anderson, J. R. Ensher, M. R. Matthews, C. E. Wieman, and E. A. Cornell, Science 269, 198 (1995).
- Davis et al. (1995b) K. B. Davis et al., Phys. Rev. Lett. 75, 3969 (1995b).
- DeMarco and Jin (1999) B. DeMarco and D. S. Jin, Science 285, 1703 (1999).
- Bloch et al. (2008) I. Bloch, J. Dalibard, and W. Zwerger, Rev. Mod. Phys. 80, 885 (2008).
- Esslinger (2010) T. Esslinger, Ann. Rev. Cond. Matt. Phys. 1, 129 (2010).
- Simon et al. (2011) J. Simon et al., Nature (London) 472, 307 (2011).
- Hofstetter et al. (2002) W. Hofstetter, J. I. Cirac, P. Zoller, E. Demler, and M. D. Lukin, Phys. Rev. Lett. 89, 220407 (2002).
- Monroe et al. (1995) C. Monroe et al., Phys. Rev. Lett. 75, 4011 (1995).
- Kerman et al. (2000) A. J. Kerman, V. Vuletic, C. Chin, and S. Chu, Phys. Rev. Lett. 84, 439 (2000).
- Han et al. (2000) D.-J. Han, S. Wolf, S. Oliver, C. McCormick, M. T. DePue, and D. S. Weiss, Phys. Rev. Lett. 85, 724 (2000).
- Bloch (1946) F. Bloch, Phys. Rev. 70, 460 (1946).
- Greiner et al. (2002) M. Greiner, O. Mandel, T. Esslinger, T. W. Hänsch, and I. Bloch, Nature (London) 415, 39 (2002).
- Bakr et al. (2010) W. S. Bakr et al., Science 329, 547 (2010).
- Sherson et al. (2010) J. F. Sherson et al., Nature (London) 467, 68 (2010).
- Rabl et al. (2003) P. Rabl, A. J. Daley, P. O. Fedichev, J. I. Cirac, and P. Zoller, Phys. Rev. Lett. 91, 110403 (2003).
- Popp et al. (2006) M. Popp, J.-J. Garcia-Ripoll, K. G. Vollbrecht, and J. I. Cirac, Phys. Rev. A 74, 013622 (2006).
- Williams et al. (2010) J. R. Williams, J. H. Huckans, R. W. Stites, E. L. Hazlett, and K. M. O’Hara, Phys. Rev. A 82, 011610R (2010).
- Bakr et al. (2011) W. S. Bakr et al., Nature (London) 480, 500 (2011).
- Vala et al. (2005) J. Vala, K. B. Whaley, and D. S. Weiss, Phys. Rev. A 72, 052318 (2005).
- Langer (2006) C. E. Langer, Ph.d. thesis, University of Colorado (2006).
- Weiss et al. (1997) D. S. Weiss, S. L. Winoto, and M. T. DePue, Proc. SPIE Int. Soc. Opt. Eng. 2995, 156 (1997).
- Förster et al. (2009) L. Förster et al., Phys. Rev. Lett. 103, 233001 (2009).
- Nelson et al. (2007) K. D. Nelson, X. Li, and D. S. Weiss, Nature Phys. 3, 556 (2007).
- SM (3) See Supplemental Material for a discussion of the experimental geometry.
- SM (1) See Supplemental Material for a discussion of the matrix elements and adiabatic fast passage efficiency.
- SM (2) See Supplemental Material for a discussion of heating by spontaneous emission of lattice light.
- Castin et al. (1998) Y. Castin, J. I. Cirac, and M. Lewenstein, Phys. Rev. Lett. 80, 5305 (1998).
- Wolf et al. (2000) S. Wolf, S. J. Oliver, and D. S. Weiss, Phys. Rev. Lett. 85, 4249 (2000).