The Pulsation Period of the Hot Hydrogen-Deficient Star MV Sgr
John R. Percy and Rong (Hannah) Fu
Department of Astronomy and Astrophysics
University of Toronto
Toronto ON
Canada M5S 3H4
Abstract. MV Sgr is a hot, hydrogen-deficient star which has undergone R CrB fadings. We have used self-correlation analysis and Fourier analysis of CCD V photometry in the AAVSO International Database to identify a period of 8.0 days in this star; the amplitude is about 0.03 mag. The variability is most likely due to pulsation.
1. Introduction
Hydrogen-deficient stars (Werner and Rauch 2008) are a rare but very diverse (Jeffery 2008a) group of objects, in advanced and unusual stages of evolution. In this paper, we are concerned with hydrogen-deficient stars which can undergo the R CrB phenomenon – unpredictable fadings, followed by slow return to maximum brightness. Most of the approximately 50 such stars in our galaxy are cool – “classical” R CrB stars – but a few hot members of the group have been discovered.
There are two proposed mechanisms for producing “classical” R CrB stars: the merger of a helium white dwarf and a carbon-oxygen white dwarf, and a final helium shell flash. Observational evidence seems to favor the former mechanism, though a few R CrB stars may be produced by the latter mechanism (Clayton 2011). The hot hydrogen-deficient stars do not necessarily arise from the same mechanism(s) as the cool ones, and may in fact have diverse evolutionary histories (De Marco et al. 2002).
Many R CrB stars are also pulsating variables, and the pulsation may be partly responsible for the mass loss that leads to the fadings. Pulsating hot hydrogen-deficient variable stars have been classified as PV Tel stars, but Jeffery (2008b) argues that this classification should be replaced by three new classes, based on the pulsation period and mode in the star.
MV Sgr (AAVSO 1838-21, HV 4168, V 13.35) was discovered to be an R CrB star in 1928 by Miss Ida Woods (Hoffleit 1959), and has been studied by various techniques since then. Its atmospheric properties are Teff = 16,000 500 K and log g = 2.48 0.30, and pulsations had not been found in MV Sgr as of 2008 (Jeffery 2008b).
2. Data, Analysis, and Results
Visual and CCD V data were taken from the American Association of Variable Star Observers International Database (AID). There were a total of approximately 2315 visual observations, and 138 CCD V observations. The former were made by 33 different observers; the latter were made by G. Di Scala, M. Simonsen, J. Temprano, and D. Wells.
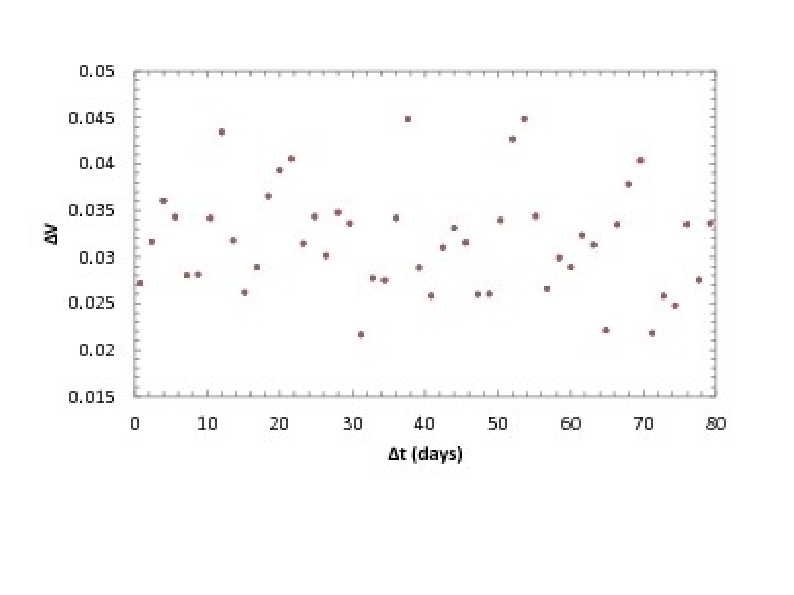
The most numerous V observations were in the season JD 2455644-852. Self-correlation analysis (Percy and Mohammed 2004) of these showed a clear period of about 8.0 days, with a full amplitude of about 0.03 mag, and at least 8 repeating minima, indicating coherent variability (Figure 1). Self-correlation anaysis of the whole V dataset showed a period of 8.0 0.1 days, with a similar amplitude. The mean error of the observations, as determined from the intercept on the vertical axis, is 0.03 mag. Self-correlation analysis of the visual data did not show a detectable signal, which is probably due to the small amplitude and the much higher noise level.
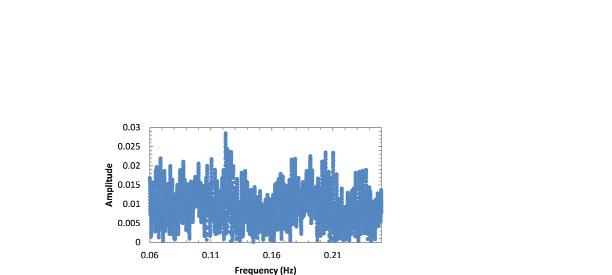
The analysis was repeated with Fourier analysis, using the Period04 software (Lenz and Breger 2005). For the V data: in the season JD 2455644-852, and in the whole dataset, the highest peaks were at frequencies of 0.128 cycle/day (period 7.8 days) and and 0.122 cycle/day (period 8.2 days), respectively; the latter spectrum is shown in Figure 2. In each case: the highest peak was only slightly higher than the next-highest peak. It did, however, agree with the period found from self-correlation analysis. For the visual data: the highest peak was at a frequency of 0.204 cycle/day (period 4.9 days), but this was only slightly higher than the noise level, and may not be significant, especially considering the small amplitude and the much higher noise level in the visual data.
3. Discussion and Conclusions
MV Sgr displays a period of 8.0 days, which we assume to be due to pulsation. The signal is not strong, but it is quite clear in the self-correlation diagram, and is consistent with the results of the Fourier analysis. This enables us to place it in Jeffery’s (2008b) PV Tel I sub-class.
MV Sgr was not known to be pulsating. We now have one more piece of useful information about this star. Also: the discovery of pulsation provides further support for the possible connection between pulsation and the R CrB phenomenon in hydrogen-deficient stars.


Acknowledgements
We thank the AAVSO observers and staff for making and archiving the visual and CCD observations used in this study. This study was supported by the Ontario Work-Study Program.
References
Clayton, G.C. 2011, in Asymmetric Planetary Nebulae V, ed. A.A. Zijlstra et al., Jodrell Bank Centre for Astrophysics, Manchester UK, 157.
Hoffleit, D. 1959, Astron. J., 64, 241.
Jeffery, C.S. 2008a, in Hydrogen-Deficient Stars, ed. K. Werner and T. Rauch, ASP Conference Series, Vol. 391, 3.
Jeffery, C.S. 2008b, IAU Inf. Bull. Var. Stars, #5817.
Lenz, P., and Breger, M. 2005, Commun. Astroseismology, 146, 53.
De Marco, O., et al. 2002, Astron. J., 123, 3387.
Percy, J.R., and Mohammed, F. 2004, J. Amer. Assoc. Var. Star Obs., 32, 9.
Werner, K. and Rauch, T. 2008 (editors), Hydrogen-Deficient Stars, ASP Conference Series, Vol. 391.