Chandra observations of the old pulsar PSR B145168
Abstract
We present 35 ks Chandra ACIS observations of the 42 Myr old radio pulsar PSR B145168. A point source is detected from the expected radio pulsar position. It has counts in the 0.3-8 keV energy range. We identify this point source as the X-ray counterpart of the radio pulsar. PSR B145168 (catalog )is located close to a 2MASS point source, for which we derive 7% as the upper limit on the flux contribution to the measured pulsar X-ray flux. The pulsar spectrum can be described by either a power-law model with photon index and a unrealistically high absorbing column density cm-2, or by a combination of a keV blackbody and a power-law component for cm-2, estimated from the pulsar dispersion measure. At the parallactic, Lutz-Kelker bias corrected distance of 480 pc, the non-thermal X-ray luminosities in the 0.3-8 keV energy band are either erg s-1 or erg s-1, respectively. This corresponds to non-thermal X-ray efficiencies of either or , respectively.
1 Introduction
Old ( Myr), rotational-powered pulsars have lost a siginificant amount of their initial rotation energy. Their spin-down power, erg s-1, is usually several orders of magntiude lower than those of younger pulsars. The lower energy budget translates into fainter high-energy emission. Only the closest of the old rotational-powered pulsars can be detected in X-rays.
Since the bulk of the neutron star surface is too cold to be visible in X-rays (Yakovlev & Pethick, 2004),
one expects to see mainly the X-rays from the non-thermal magnetospheric emission
with a possible small thermal contribution from polar caps heated by infalling, accelerated particles (Harding & Muslimov, 2001, 2002).
So far, eight old pulsars have been detected at X-ray wavelengths (e.g., Becker et al. 2004; Zavlin & Pavlov 2004; Tepedelenlioǧlu & Ögelman 2005; Zhang et al. 2005; Becker et al. 2006; Kargaltsev et al. 2006; Misanovic et al. 2008; Hui & Becker 2008; Pavlov et al. 2009), several of them having only a few dozen counts. Most of the X-ray spectra can be described by relatively soft power laws with photon indices . Some of these spectra can be fitted with blackbody (BB) models or by a combination of BB and power law (PL) components. The BB models usually indicate a rather small emission area compared to the conventional polar cap sizes whose radii are calculated as , assuming a magnetic dipole field (Harding & Muslimov, 2001, 2002).
Here, is the radius of the neutron star, is the pulsar period and is the speed of light.
There has been a debate as to how significant the thermal contributions are (e.g., Becker et al. 2004; Zavlin & Pavlov 2004; Misanovic et al. 2008; Hui & Becker 2008).
Better count statistics, the consideration of new information from other wavelengths as well as a larger object sample are required to understand the quantitative contributions of magnetospheric and thermal components.
PSR B145168 is an old, nearby pulsar, previously unexplored in X-rays. The s radio pulsar has a characteristic spin-down age yr, a dipole magnetic field strength of G, and a spin-down power erg s-1. The proper motion components of PSR B145168 (catalog )were measured by Bailes et al. (1990): mas yr-1 and mas yr-1. Unlike most other pulsars, the proper motion is directed toward the Galactic plane. Bailes et al. (1990) measured an annual parallax of mas and reported a distance of pc. According to Verbiest et al. (2010) the distance corrected for the Lutz-Kelker bias is pc. The spin-down power of PSR B145168 (catalog )is comparable to those of other nearby old pulsars which have been detected in X-rays. Aiming for constraints on the X-ray spectral properties of PSR B145168 (catalog ), we report here on Chandra observations of this pulsar.
2 Observations and Data reduction
PSR B145168 (catalog )was observed with the Chandra X-ray observatory on 2010 May 16 using the ACIS-S detector in the VFAINT imaging mode. The nominal exposure time was 35.1 ks. The data reduction was done using CIAO (version 4.3). We reprocessed the data in order to apply the VFAINT background cleaning. We investigated event files with and without event position randomization using the Energy-Dependent Subpixel Event Repositioning (EDSER) algorithm by Li et al. (2004), as well as the subpixel algorithm by Mori et al. (2001). If not stated otherwise, we will discuss in the following the events with the pixel position randomization turned off. No large background flares occured during the observation, therefore we filtered the reprocessed event file for good time intervals (GTIs) which have less the deviation from the overall lightcurve mean rate. After the GTI filtering the actual exposure time was 34.7 ks. Due to the ACIS frame time of 3.2 s, it is not possible to search for X-ray pulsations corresponding to the s of PSR B1451–68. The wavdetect task was applied to obtain an X-ray source list. A source was detected at the pulsar position on the back-illuminated chip S3. Using the CIAO task arfcorr we estimate that 95% of the source counts are included in a aperture in an energy range from 0.3 keV to 5 keV. The aperture-corrected source count rate is cps.
Since there is a stellar neighbour with small angular separation () from the initial X-ray centroid position, we aimed for improving the astrometric solution of the event file. As reference frames, we used the European Southern Observatory (ESO) New Technology Telescope (NTT) SUSI2 observations of PSR B145168 (catalog )(PI: Bucciantini, obtained as part of their program 68.D-0249) and the 2MASS point source catalogue (PSC, Skrutskie et al. 2006). The details of the reprojection process are given in the Appendix A. Our derived overall absolute astrometric uncertainty of the reprojected Chandra event file is , and the relative astrometric uncertainty of Chandra with respect to the 2MASS PSC is .
We obtained updated wavdetect positions for all X-ray sources on the S3 chip. The X-ray source at the pulsar location appears to be point like. For this source, we also measured the centroid positions of the flux distribution in and apertures for both, the event file with just the pixel position randomization removed and the one with the EDSER subpixel algorithm applied in addition. Statistical centroid position errors are calculated as the standard error of the mean in the pixel coordinates X and Y in the respective aperture and transformed to the world coordinate system. There are no statistically significant differences between the different positions listed in Table 1.
| method | R.A. | Dec. |
|---|---|---|
| event file without randomization | ||
| wavdetect | 224.00006(2) | -68.72757(1) |
| centroid, | 224.00007(2) | -68.72757(1) |
| centroid, | 224.00002(2) | -68.72759(1) |
| event file with EDEF subpixel algorithm employed | ||
| centroid, | 224.00007(2) | -68.72757(1) |
| centroid, | 224.00002(2) | -68.72758(1) |
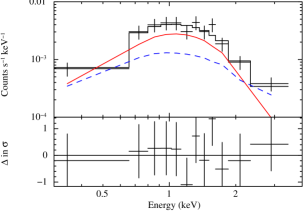
We extracted a source spectrum within of the pulsar centroid position. A background spectrum was extracted from an annulus of to around the same position. The extracted source spectrum counts have been combined to energy groups of 15 counts each. Applying XSPEC (version 12.6.0) to analyze the spectrum, we used -fitting with standard weighting, the tbabs model for the X-ray absorption and abundance tables by Wilms et al. (2000) as well as photoelectric absorption cross sections from Balucinska-Church & McCammon (1992) and Yan et al. (1998). Different spectral models were checked for correspondence with the energy distribution of the source counts within an energy range of 0.3 keV to 8 keV. The fit results are presented in Table 2. We checked whether the VFAINT background cleaning influenced the spectral properties of the source. Without this correction there are 2 more source counts (1%), and the corresponding spectral model fit results are within the same as listed.
3 Results and Discussion
3.1 Position and possible source blending
In order to determine the pulsar coordinates, we combined the Molonglo data used by Siegman et al. (1993) and Parkes data from 1991 to 2006. First, we obtained the dispersion measure, cm-3 pc, using the Parkes data which have 400, 600 and 1400 MHz times of arrivals. This value improves the accuracy of the previously reported cm-3 pc by D’Alessandro et al. (1993). Fixing the proper motion at the interferometric values of Bailes et al. (1990), and using the Molonglo as well as the Parkes data, we derive the position of PSR B145168 (catalog )as RA(J2000)= 14:56:00.071(6); Dec(J2000)= 68:43:39.25(5) at epoch MJD 50135. The quoted uncertainties are twice those given by the least-square solution. The expected pulsar coordinates at the epoch of the Chandra observations, MJD 55332.7, are: (J2000)= 14:55:59.968(8); (J2000)= 68:43:39.43(6). The errors reflect uncertainties including those due to the proper motion uncertainties.
The measured X-ray source position slightly depends on the method applied, see Table 1. We will use in the following the wavdetect position in the reprojected event file without pixel position randomization. The measured X-ray source position is then 14:56:0.015(7) and :43:39.25(4). The errors reflect variances of the wavdetect position.
Close to this position there is a 2MASS point source which has also been detected in the ESO SUSI2 WB655 image as well as other optical surveys. The listed J2000 position of 2MASS 145600026843400 is = 14:56:00.028; = 68:43:40.02 (Cutri et al., 2003). 2MASS 145600026843400 is also listed in the USNO B1 catalogue (Monet et al., 2003). Roeser et al. (2010) determined the apparent proper motion of this source to be mas yr-1 in right ascension and mas yr-1 in declination. Thus, we can neglect movement of the 2MASS source, and the calculated separation between the expected pulsar position and the 2MASS point source is 0.68″ .
The X-ray source position is offset by in right ascension and in declination from the expected pulsar position. Here, the errors reflect only the wavdetect positional variances. In addition, systematic astrometric errors apply. Our absolute astrometric accuracy is better than (Section 2 and Appendix A). Thus, the Chandra X-ray position is coincident with the expected pulsar position within astrometric uncertainties.111The separation between the position of 2MASS 145600026843400 and the optical source detected in the ESO SUSI2 image is only 46 mas, underlining the tight relation between the SUSI2 and 2MASS (and subsequently the Chandra) astrometry.
The X-ray source position is offset by
in right ascension and in declination from the catalog position of 2MASS 145600026843400.
To discuss the position of this 2MASS source, only the relative astrometric precision between Chandra and 2MASS has to be considered (Section 2 and Appendix A).
Considering the X-ray statistical (wavdetect) positional errors as well as the relative astrometric precision between Chandra and 2MASS, it appears unlikely that the Chandra X-ray point source with 0.77″ separation is the counterpart of the 2MASS point source.
We discuss spectral constraints on the nature of 2MASS 145600026843400 in the Appendix B.1.
To estimate a limit of the possible X-ray flux contribution of 2MASS 14560002-6843400 to the measured X-ray emission of the pulsar we use different approaches, which are discussed in detail in the Appendix B.2.
In short, we measure flux percentages in small apertures centered on the X-ray source and the 2MASS source positions, deconvolve the image applying the Chandra Ray Tracer (ChaRT), MARX and the CIAO task arestore, and investigate the count energy distribution of the X-ray source.
Considering (i) the flux percentage measurements in the reprojected event file with or without subpixel algorithm applied; (ii) the comparison of the deconvolved image with an deconvolved simulated double source image; (iii) the location of the PSF asymmetry region; and (iv) the hardness of the detected counts towards the 2MASS star; we conclude that any contribution of 2MASS 14560002-6843400 to the measured X-ray flux of the pulsar must be %.
3.2 The X-ray spectrum of the pulsar
As described in Sect. 2, we used XSPEC to check different spectral models for the extracted X-ray source spectrum.
As discussed above, at least 93% of the X-ray source flux is attributed to the pulsar.
We employ in the following the counts from the extraction region for the pulsar spectrum (198 counts in an energy range from 0.3 keV to 5 keV) and neglect the possible (small) contribution of the 2MASS star.
The fit results are presented in Table 2.
The derived absorbed X-ray fluxes for the different spectral models range from erg cm2 s-1 to erg cm2 s-1 for energies between 0.3 keV and 5 keV.
Allowing all parameters to vary, we tested simple single-component models like a BB or a PL spectrum. An absorbed, cm-2,
PL model with photon index fits the spectrum well, while the obtained BB fit is statistically unacceptable.
In addition, we checked whether the X-ray spectrum can be described by an optically thin thermal plasma model as one could expect from a stellar corona.
The apec plasma model fit is acceptable. It is slightly worse than the PL, but better than the BB fit. We discuss the apec parameters with respect to 2MASS 145600026843400 in more detail in Appendix B.1. For the pulsar counterpart of the X-ray source, the thin plasma model is physically irrelevant and not further discussed.
| Model | PL norm at 1 keV | EM | red. /d.o.f. | |||||
|---|---|---|---|---|---|---|---|---|
| cm | photons keV-1 cm-2 s | [keV] | [m] | cm | erg cm2 s | |||
| PL | … | … | … | 0.4/10 | ||||
| BB | … | … | … | 1.4/10 | ||||
| BB+PL | … | 0.5/8 | (PL) / (BB) | |||||
| APEC | … | … | … | 0.8/10 | ||||
| frozen | ||||||||
| PL | 2.6 | … | … | … | 1.6/11 | |||
| BB | 2.6 | … | … | … | 1.4/10 | |||
| BB+PL | 2.6 | … | 0.5/9 | (PL) / (BB) |
Note. — Count-weighted variances of the centroid positions
are listed in brackets and refer to the last respective digits.
These errors do not include astrometric uncertainties.
Note. — All errors indicate 90% confidence intervals, the BB emitting area radius errors take the distance error into account. The parallactic distance, corrected for the Lutz-Kelker Bias, pc, is used. The unabsorbed fluxes, , are given for the energy range from 0.3 keV to 8 keV.


Among the X-ray spectral fits in Table 2, the PL fit and the BB+PL fit show the lowest values, but the uncertainties are very large for the two-component model. Both fits show suspiciously high best-fit values of the hydrogen column density, cm-2. This value is close to the Galactic value for this line of sight (, ): the LAB Survey of Galactic neutral hydrogen reports cm-2 towards this direction (Kalberla et al., 2005), the Dickey & Lockman (1990) neutral hydrogen survey reports cm-2. The pulsar has a parallactic distance of only 450 pc and a low DM value. Assuming 10 H atoms for each , we derive an expected cm-2 from the pulsar pc cm-3 (Sect. 3.1). Freezing at cm-2, we obtain new X-ray spectral fits, presented in Table 2. The PL fit is now slightly worse than the BB fit, both are unacceptable. The combined BB+PL model fits the data best. According to the F-test, the combined model fits the data better than the PL-only fit with a probability of 99.4%, and better than the blackbody-only fit with a probability of 99.1%.
The inferred BB emitting area radius is of a similar size as in the case of the BB-only fit, albeit with larger error.
The individual contributions to the unabsorbed fluxes in the energy range from 0.3 keV to 8 keV are erg cm2 s-1 and erg cm2 s-1 for the BB and the PL components, respectively.
Flux errors are large because the fitted component normalization values have high uncertainties due to the low number of counts.
We also checked neutron star (NSA) models (Zavlin et al., 1996; Pavlov et al., 1995) with fixed parameters for neutron star mass and radius (M M⊙, R km). The fits are marginally acceptable, and the non-magnetisied NSA model fit achieves the lowest . However, the fits are worse than the BB+PL fit. Allowing both the mass and radius to vary results in inplausibly low masses and radii.
The inferred X-ray spectral fit parameters are similar to those found for other old pulsars (e.g., Pavlov et al. 2009; Kargaltsev et al. 2006; Becker et al. 2004). From a statistical viewpoint alone we are unable to differentiate between a purely magnetospheric emission model and a combination of magnetospheric and thermal emission. But the derived in case of the PL-only fit is a factor 10 higher than one would expect from the dispersion measure. Even accounting for the fit parameter error and a possible uncertainty factor of 3 for the DM-based , these values do not overlap. Therefore, we regard the spectral fits, in particular the BB+PL fit, with fixed more realistic. In the combined model, the photon index of is comparable to the typical values for younger pulsars (, Kargaltsev & Pavlov 2008; Gotthelf 2003), but the inferred BB emission area radius, m is rather small. The conventional polar cap (PC) radius is m assuming a dipolar magnetic field for this pulsar and km.
Similar discrepancies have been found for BB components of other old pulsars (Pavlov et al., 2009; Misanovic et al., 2008; Kargaltsev et al., 2006; Zhang et al., 2005).
Apart from geometrical projection effects, the following explanations have been discussed:
only a small fraction of the PC is heated by inflowing particles at the footpoints of “spark discharges” created above the PC (Zhang et al., 2005; Ruderman & Sutherland, 1975);
the PCs are covered by hydrogen or helium atmosphere resulting in effective temperatures of a factor 2 less and a radius a factor 3-10 larger than the BB fit (Zavlin & Pavlov, 2004);
the nondipolar component of the magnetic field is much stronger than the dipolar component, causing partially screened acceleration regions and smaller PCs as consequences (Gil et al., 2003).
3.3 The X-ray efficiency of old rotation-powered pulsars
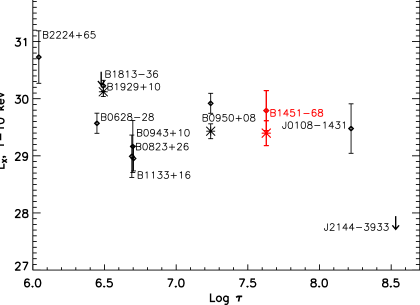
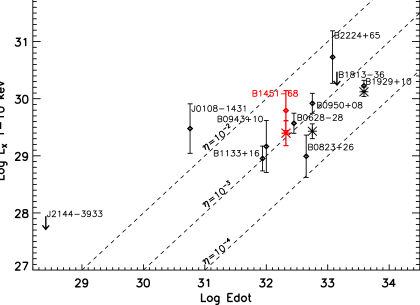
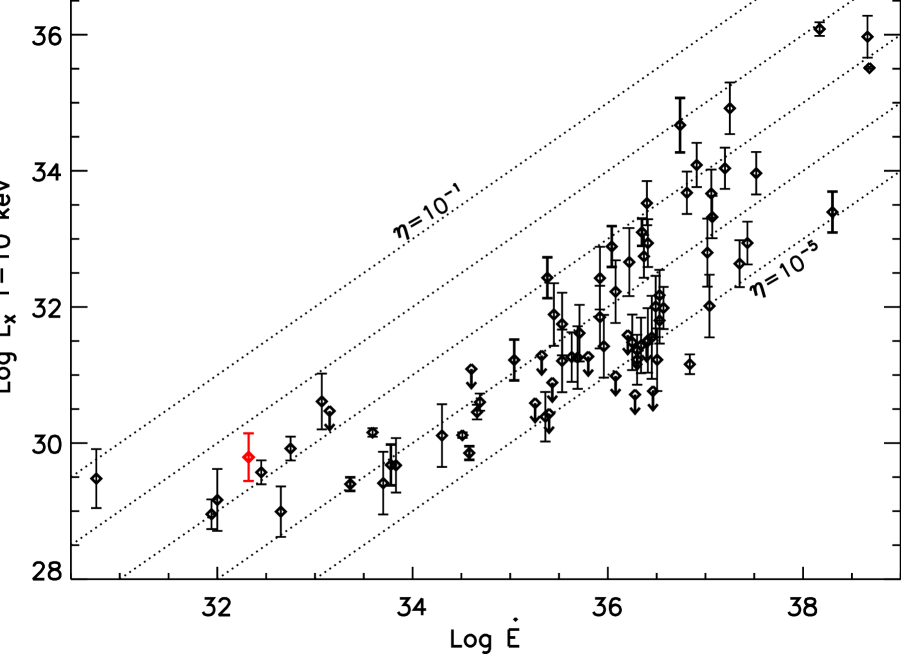
For PSR B1451–68, the luminosity of the non-thermal (PL) X-ray component in the 0.3-8 keV energy band is erg s-1, where the error is calculated from the 90% confidence error of the unabsorbed flux and the pc uncertainty of the Lutz-Kelker corrected distance. Such a luminosity corresponds to a non-thermal X-ray efficiency . The X-ray luminosities versus characteristic ages of old pulsars, including PSR B1451–68, are plotted in Figure 3. There is no obvious characteristic age effect visible in this plot. We also include PSR B145168 (catalog )in the plot showing the X-ray luminosities versus spin-down energies of old pulsars (Figure 4). Distances to other old pulsars are updated according to Deller et al. (2009) and corrected for the Lutz-Kelker bias (Verbiest et al., 2010). The non-thermal X-ray efficiency of PSR B145168 (catalog )is larger than those of young pulsars, most of which have values smaller than , see Figure 5. The efficiency of PSR B1451–68 is, however, comparable to those of other old pulsars (Fig. 4). While it is possible that old pulsar spectra with too few counts may have an undetected thermal contribution (e.g., from heated polar caps), Figure 4 shows only little influence of such a thermal component on the inferred non-thermal X-ray efficiencies in the energy range 1 to 10 keV for the 3 pulsars with sufficiently large number of counts. This supports the hypothesis that the conversion of spin-down power into X-ray emission becomes more efficient as pulsars get less powerful (Zharikov et al., 2006; Kargaltsev et al., 2006). There is, however, an observational bias in favor of brighter X-ray sources which can lead to the detection of only the most efficient old neutron stars.
A look on the increasingly complete observational statistics of the closest pulsars can help to minimize the effect of the observational bias in favor of brighter X-ray sources. Instead of the characteristic ages, which may be very different from the true ages, we prefer to use the directly measurable as parameter to differentiate between powerful, young and less powerful, old pulsars. We choose erg s-1 as a rough, admittedly arbitrary boundary between young and old pulsars. This boundary was motivated by pulsar statistics in the ATNF pulsar catalog222http://www.atnf.csiro.au/research/pulsar/psrcat/ (Manchester et al., 2005), where most radio pulsars have characteristic ages Myr for erg s-1 while younger radio pulsars usually have higher . The close -ray pulsar PSR J1741-2054 with kyr, but modest erg s-1 influenced our choice of the particular boundary value.
According to the ATNF pulsar catalog, PSR B1451–68 with its Lutz-Kelker corrected distance of pc is the eleventh closest of the isolated radio pulsars with erg s-1. Six of these eleven pulsars333PSR B2224+65 with its potentially overestimated X-ray luminosity due to an unresolved shocked pulsar wind component is not among the eleven closest old pulsars. are now detected in X-rays, all six have parallactic distances. Two of the X-ray detected pulsars, PSR B1929+10 and PSR B0823+26, have X-ray efficiencies , the other four X-ray detected pulsars have . Thus, at least 36% of all the closest old pulsars with ergs s-1 show .
For comparison, we consider now the 11 closest, isolated, younger pulsars with ergs s-1. Nine of them are detected in X-rays, the two others were not probed deep enough. Four of these nine detected pulsars have parallactic distances. Based on information of the ATNF pulsar catalog, X-ray flux investigations by Marelli et al. (2011); Camilo et al. (2009); Kargaltsev & Pavlov (2008); Tepedelenlioǧlu & Ögelman (2007), and distance corrections according to Verbiest et al. (2010) and Mignani et al. (2010), we find that all nine X-ray detected younger pulsars have . Thus, at most 18% of all these 11 pulsars with ergs s-1 could have .
Thus, looking only at the 11 closest sources in each case, it is suggestive, that at least one third of old pulsars have efficiencies , while none of the detected closest, younger pulsars has. Recently, Marelli et al. (2011) reported the following - relation for 29 Fermi pulsars with available distance estimates: , which is in agreement with older estimates for X-ray pulsars by Kargaltsev & Pavlov (2008) and Possenti et al. (2002). From this, one would indeed expect for most X-ray pulsars, and the % deviation of the closest, low pulsars appear even more puzzling. Unfortunately, an insufficient number of probed objects, inhomogeneous depth of the X-ray observations, low signal-to-noise ratios in many cases, potentially unresolved compact pulsar wind nebulae, as well as large uncertainties of DM-based distances, prohibit currently any further conclusive statistics, for a larger sample of old pulsars in particular. Whether there is indeed a higher X-ray efficiency for pulsars with low can only be checked by increasing the sample of such pulsars with sufficiently sensitive X-ray observations.
4 Summary
We investigated Chandra observations of PSR B145168. Through various image analysis techniques we estimate the possible contribution from a nearby 2MASS star to the pulsar’s X-ray flux to be less than 7%. No significant extended emission is seen. The pulsar has a soft X-ray spectrum similar to those of other old pulsars. Nominally, the spectrum is best fit with a power law, having a photon index of . However, the inferred hydrogen column density, , is uncomfortably close to the Galactic value of HI in this direction. Fixing to the DM-derived cm-2, a combination of a thermal and a non-thermal component fits the data best. The inferred radius of a heated polar cap is small, a factor 20 less than expected conventionally. The nonthermal X-ray efficiency, , is high in comparison to younger pulsars, but comparable to estimates for other old pulsars.
Support for this work was provided by the ACIS Instrument Team contract SV4-74018 (PI: G. Garmire) issued by the Chandra X-ray Observatory Center, which is operated by the Smithsonian Astrophysical Observatory for and on behalf of the National Aeronautics Space Administration under contract NAS8-03060. This work was partly supported by NASA grant NNX09AC84G, NSF grant AST09-08611, and by the Ministry of Education and Science of the Russian Federation (contract 11.G34.310001). Based on observations made with ESO Telescopes at the La Silla Paranal Observatory under programme ID 68.D-0249.
This research has made use of SAOImage DS9, developed by SAO; the SIMBAD and VizieR databases, operated at CDS, Strasbourg, France; and SAO/NASA’s Astrophysics Data System Bibliographic Services. Facilities: CXO (ACIS).
Appendix A Reprojection of the X-ray data and X-ray source position
For the optical reference frame, we used the European Southern Observatory (ESO) New Technology Telescope (NTT) observations of PSR B145168.
The NTT was equipped with the SUSI2 imager. We chose an image which was obtained with the WB655, a wide -band filter in February 2002.
The field of view of the CCD chip with the target on it is , and there are plenty of 2MASS point sources in this field, e.g., 46 with the highest quality flag AAA.
We obtain the absolute astrometry of the ESO SUSI2 image with the help of the
2MASS point source catalog (PSC, Skrutskie et al. 2006) using Graphical
Astronomy and Image Analysis Tool () (Draper et al., 2007). Nominally, an absolute positional accuracy of mas (Skrutskie et al., 2006) can be achieved for high-quality 2MASS point sources. The rms of the GAIA astrometric fit to the AAA-2MASS source positions was determined to be mas. Thus, we expect the source positions in the ESO SUSI2 image to have an absolute astrometric error of 612 mas.
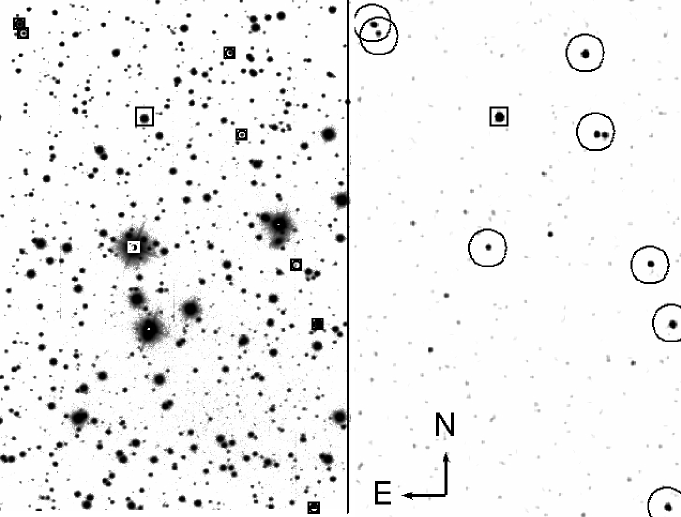
Nine optical sources in the SUSI2 image were found to correspond to wavdetect X-ray sources on the ACIS S3 chip. Five of them are also 2MASS point sources. We excluded one source close to the expected pulsar position and proceeded with eight optical detections. The sources are indicated in Figure 6.
The X-ray and optical sources were matched and the Chandra image astrometry updated by applying the CIAO tasks reproject_aspect and wcs_match.
After removing one poor match, seven sources remained.
For the seven sources the average residual after reprojecting was mas in comparison to 340 mas for the original event file (all without pixel position radomization).
Thus, our overall absolute astrometric uncertainty is , while the relative astrometric uncertainty of Chandra with respect to the 2MASS PSC is .
Appendix B 2MASS 14560002-6843400
B.1 Spectral constraints on the nature of 2MASS 14560002-6843400
Here, we want to test if – neglecting positional arguments – 2MASS 14560002-6843400 could be in principle the counterpart of the X-ray source.
As described in Sect. 2, we checked different spectral models for correspondence with the energy distribution of the source counts within an energy range of 0.3 keV to 8 keV; the fit results are listed in Table 2.
Amongst others, we checked whether the X-ray spectrum can be described by an optically thin thermal plasma model as one could expect from a stellar corona.
In Table 2, we list the obtained apec model parameter values, the mekal or raymond models gave similar values.
The apec plasma model fit is acceptable.
The derived plasma temperature is high, keV. Such high temperatures can be reached in young stars (e.g., Preibisch et al. 2005; Getman et al. 2005).
As a reminder, the derived absorbed X-ray fluxes for the different spectral models range from erg cm2 s-1 to erg cm2 s-1 for energies between 0.3 keV and 5 keV.
We use the formula by Maccacaro et al. (1988) to estimate the optical to X-ray flux ratio.
2MASS 14560002-6843400 has an apparent -band magnitude of mag in the General Guide Star Catalogue version 2.3.2 (Lasker et al., 2008), and mag in the NOMAD catalogue (Zacharias et al., 2004).
Assuming that the detected X-ray source is the counterpart of 2MASS 14560002-6843400, the range is accordingly from to . Such flux ratios are typical for K or M stars (e.g., Agüeros et al. 2009).
2MASS 14560002-6843400 has the following magnitude measurements: = mag, = mag, = mag, = 16.83 mag (USNO B1), = 15.05 mag (USNO B1), = 15.11 mag (USNO B1). The obtained colors and , are consistent with a late G to early K star, the colors , , , , and indicate a K0 to K2 star following intrinsic stellar colors listed by Currie et al. (2010) and Covey et al. (2007). A K2 dwarf would be consistent with all colors without requiring significant extinction. From the cm-2 obtained for the apec model fit we estimate the optical extinction using the relation between the hydrogen column density and extinction by Predehl & Schmitt (1995). Using the extincion relations by Cardelli et al. (1989) and we estimate color corrections and find that a G9 dwarf is the most likely extinction-corrected counterpart for the cataloged NIR and optical magnitudes. Assuming mag according to the Padova tracks (Bertelli et al., 2008), the reported apparent magnitude translates into a distance of 1.1 kpc. For a K2 dwarf without extinction, assuming mag, the reported apparent magnitude translates into a distance of 0.9 kpc.
A typical K or late G dwarf main sequence star is expected to have its X-ray peak emission below 1 keV and show nearly no emission above 1 keV. Young dwarf stars, on the other hand, could produce the observed X-ray spectrum. There is no obvious star formation region within 1 degree of the target position, and as noted above, 2MASS 14560002-6843400 has a very slow proper motion ( mas yr-1).
While one cannot exclude an in-situ young stellar object, there is no indication for this from extinction, outflows, or flares, and a late G or early K dwarf main sequence star seems to be the most likely counterpart of 2MASS 14560002-6843400.
From this in turn, we conclude that the contribution of 2MASS 14560002-6843400 to the X-ray emission is small, and that the X-ray source is not the counterpart of 2MASS 14560002-6843400, but of the pulsar.
B.2 Investigation of possible source blending
We wish to obtain an upper limit for any potential X-ray flux contribution of the 2MASS star to the X-ray source detected at the pulsar position.
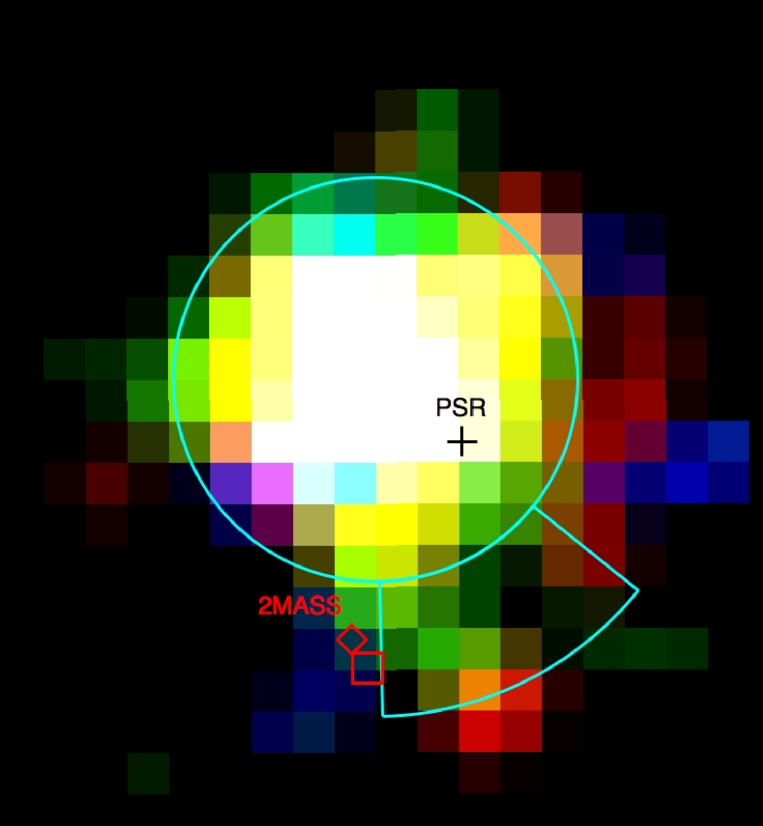
First, we look at the spatial distribution of the dominant count energies in the X-ray image. Figure 7 shows a color-coded
image of the reprojected event file with the CIAO EDSER subpixel algorithm (Li et al., 2004) applied. Apparently, there is emission near the 2MASS source. However, the location of the 2MASS soure is very close to a region where enhanced emission is expected due to the recently found asymmetry in the Chandra point spread function444http://cxc.harvard.edu/ciao/caveats/psf_artifact.html (PSF). For our observation we obtained the inflicted region by applying the CIAO task make_psf_asymmetry_region, it is marked in the figure in cyan and the artifact can constitute % of the total brightness.
If a normal K star at the position of the 2MASS object contributes to the X-ray flux, one would expect an enhancement in soft counts towards this position.
However, there appear to be slightly more hard counts in the direction of the 2MASS source.
A hard spectrum is unusual for a normal star, less so for a young stellar object. As discussed in Appendix B.1, the 2MASS source is unlikely to be a young stellar object.
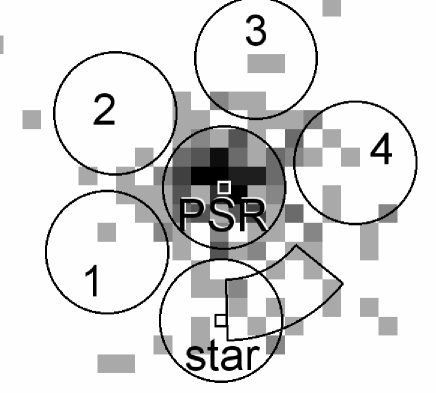
Next, we measure the number of counts in similar regions around the center of the X-ray source to quantify the overabundance of counts towards the 2MASS star. Figure 8 shows the chosen counting regions: The ‘star’ circle is centered on the 2MASS source’s 2002 optical SUSI2 position. Circles 1 to 4 have similar separations from the X-ray centroid and the same size as the ‘star’ region. They are used to obtain the average expected number of counts from the PSF wings for this particular separation and area. This assumes a symmetric PSF (see comments below). To relate the ‘star’ counts, , to the pulsar counts, , we use a circle of the same size at the position of the X-ray centroid. We estimate the ratio between the extra ‘star’ counts and the pulsar counts as . Of course, this is a very crude estimation neglecting a detailed Chandra PSF model in general and the outer PSF wings in particular. In the ideal case of well separated point sources with similar spectra and using the same aperture for each source, their flux ratios should be constant for different aperture sizes. In our case we need to account for a flux contribution due to the overlapping of the individual PSFs. This contribution is significant for the potential ‘star’ source, hence the subtraction of is an approximation of this contribution. The flux contribution of the ‘star’ PSF to is negligible as seen from Chandra MARX simulations. For circles with we infer ‘star’ percentages of 6.3% for the event file with the EDSER subpixel algorithm applied, and 0% (actually -1.3%) for the event file without randomization. For circles with we infer ‘star’ percentages of 7.1% for the event file with the EDSER subpixel algorithm applied, and 3.1% for the event file without randomization. Note that the ACIS encircled energy is 50% for an aperture radius of , while it is 90% for , the radius used in Sections 2 and 3.2 (Chandra Proposers’ Observatory Guide, sect. 6.6 555http://cxc.harvard.edu/proposer/POG/html/index.html). Due to the Poisson noise character of the very few counts we are dealing with, it is difficult to obtain a rigorous error estimate for the above formula. Changing slightly the positions of the individual counting regions, we approximate the error to be around 1% of the pulsar counts. The known PSF assymmetry region of enhanced flux is actually partly overlapping our ‘star’ circle (see Fig. 8). Since part of the enhanced flux in the ‘star’ circle is likely due to the asymmetry ‘leakage’, our estimated percentages are indeed conservative upper limits.
We also deconvolved the image applying the Chandra Ray Tracer (ChaRT), MARX (v. 4.4 and 4.5) and the CIAO task arestore following standard CIAO threads. Since the subpixel algorithm is not yet implemented in the simulators, we discuss here only the event file without pixel radomization.
We apply ChaRT (Carter et al., 2003) to construct the PSF at the source position. As the input spectrum, we used the parameters derived from the PL fit of the source spectrum (see Sect. 3.2) in an energy range from 0.3 to 8 keV. From the centroid source position we obtain the off-axis angle, , and the mirror spherical coordinate azimuth, 666For details on the Chandra coordinate systrems see http://cxc.harvard.edu/contrib/jcm/ncoords.ps.
We use a long exposure time (180 ks) in order to generate a high signal-to-noise-ratio PSF image which is advantageous for the following deconvolution and the source extent estimate.
The raytrace file is then used within MARX777http://space/mit/edu/CXC/MARX/index.html to
produce a PSF image with 0.25 pixel binning.
We set the parameter to as recommended in the MARX manual for ACIS data without pixel randomisation.
Using the PSF image, the CIAO task srcextent reports the X-ray source to be not extended at 90% confidence.
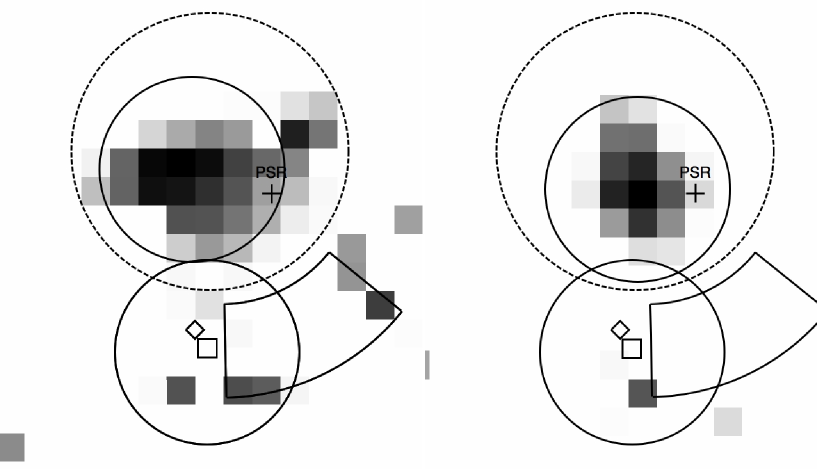
We then deconvolved the event file applying the task arestore which is based on the Lucy-Richardson deconvolution algorithm (Lucy, 1974). The image is shown in Figure 9.
The new centroid position of the main source in the deconvolved image has a small offset of with respect to the centroid position in the original image. Comparing the count numbers in a circle centered on the former and a circle of the same size centered on the SUSI2 optical position of the 2MASS star, we derive a flux percentage of 6.5% for the counts around the star with respect to those of the pulsar.
Using the original centroid position for the main source decreases this percentage to 6.1%.
The deconvolution produces ‘extra’ counts not only towards the direction of the 2MASS source, which is located at one edge of the PSF asymmetry region, but also southwest of the pulsar where the other edge of the PSF asymmetry region lies. Since neither ChaRT, MARX, nor arestore account for this asymmetry, some artefacts in the south-southwest direction can be expected after deconvolution.
For comparison, we also used MARX to simulate two sources having combined as many counts as the main source region – one source with 95% of the flux at the main source centroid position, and one with 5% flux at the SUSI2 optical position of the 2MASS star. Again, we set the parameter to and proceeded with the processing as described above. Again we find an shift (but in another direction) in the centroid position of the deconvolved image comparing to the original input coordinates. While these shifts are all within the nominal Chandra astrometric accuracy, we do not utilize the arestore positions for further astrometric purposes. Using again the circles as indicated in Figure 9, we find 4.0% of the simulated main source counts in the circle around the simulated 2MASS source. From this we infer that, in principle, it is possible to recover a % X-ray source at a 0.77″ separation, which the 2MASS source has from the main X-ray source centroid.
References
- Agüeros et al. (2009) Agüeros, M. A., et al. 2009, ApJS, 181, 444
- Bailes et al. (1990) Bailes, M., Manchester, R. N., Kesteven, M. J., Norris, R. P., & Reynolds, J. E. 1990, Nature, 343, 240
- Balucinska-Church & McCammon (1992) Balucinska-Church, M., & McCammon, D. 1992, ApJ, 400, 699
- Becker et al. (2006) Becker, W., et al. 2006, ApJ, 645, 1421
- Becker et al. (2004) Becker, W., Weisskopf, M. C., Tennant, A. F., Jessner, A., Dyks, J., Harding, A. K., & Zhang, S. N. 2004, ApJ, 615, 908
- Bertelli et al. (2008) Bertelli, G., Girardi, L., Marigo, P., & Nasi, E. 2008, A&A, 484, 815
- Bertin & Arnouts (1996) Bertin, E., & Arnouts, S. 1996, A&AS, 117, 393
- Bucciantini et al. (2008) Bucciantini, N., Bandiera, R., Mignani, R., , Dr, & Pellizzoni, A. 2008, 37th COSPAR Scientific Assembly, 37, 395
- Camilo et al. (2009) Camilo, F., Ray, P. S., Ransom, S. M., et al. 2009, ApJ, 705, 1
- Cardelli et al. (1989) Cardelli, J. A., Clayton, G. C., & Mathis, J. S. 1989, ApJ, 345, 245
- Carter et al. (2003) Carter, C., Karovska, M., Jerius, D., Glotfelty, K., & Beikman, S. 2003, Astronomical Data Analysis Software and Systems XII, 295, 477
- Covey et al. (2007) Covey, K. R., et al. 2007, AJ, 134, 2398
- Currie et al. (2010) Currie, T., et al. 2010, ApJS, 186, 191
- Cutri et al. (2003) Cutri, R. M., et al. 2003, The IRSA 2MASS All-Sky Point Source Catalog, NASA/IPAC Infrared Science Archive (http://irsa.ipac.caltech.edu/applications/Gator/)
- D’Alessandro et al. (1993) D’Alessandro, F., McCulloch, P. M., King, E. A., Hamilton, P. A., & McConnell, D. 1993, MNRAS, 261, 883
- Deller et al. (2009) Deller, A. T., Tingay, S. J., Bailes, M., & Reynolds, J. E. 2009, ApJ, 701, 1243
- Dickey & Lockman (1990) Dickey, J. M., & Lockman, F. J. 1990, ARA&A, 28, 215
-
Draper et al. (2007)
Draper, P., Gray, N., D.S., B., & Taylor, M. 2007, GAIA — Graphical
Astronomy and Image Analysis Tool
Starlink User Note 214 () - Getman et al. (2005) Getman, K. V., et al. 2005, ApJS, 160, 319
- Gil et al. (2003) Gil, J., Melikidze, G. I., & Geppert, U. 2003, A&A, 407, 315
- Gotthelf (2003) Gotthelf, E. V. 2003, ApJ, 591, 361
- Harding & Muslimov (2001) Harding, A. K., & Muslimov, A. G. 2001, ApJ, 556, 987
- Harding & Muslimov (2002) Harding, A. K., & Muslimov, A. G. 2002, ApJ, 568, 862
- Hui & Becker (2007) Hui, C. Y., & Becker, W. 2007, A&A, 467, 1209
- Hui & Becker (2008) Hui, C. Y., & Becker, W. 2008, A&A, 486, 485
- Johnson & Wang (2010) Johnson, S. P., & Wang, Q. D. 2010, MNRAS, 408, 1216
- Kalberla et al. (2005) Kalberla, P. M. W., Burton, W. B., Hartmann, D., Arnal, E. M., Bajaja, E., Morras, R., Poumlppel, W. G. L. 2005, A&A, 440, 775
- Kaplan & van Kerkwijk (2009) Kaplan, D. L., & van Kerkwijk, M. H. 2009, ApJ, 705, 798
- Kargaltsev et al. (2012) Kargaltsev, O., Durant, M., Pavlov, G. G. & Garmire, G. P. 2012, ApJ, submitted
- Kargaltsev & Pavlov (2008) Kargaltsev, O., & Pavlov, G. G. 2008, 40 Years of Pulsars: Millisecond Pulsars, Magnetars and More, 983, 171
- Kargaltsev et al. (2006) Kargaltsev, O., Pavlov, G. G., & Garmire, G. P. 2006, ApJ, 636, 406
- Lasker et al. (2008) Lasker, B. M., et al. 2008, AJ, 136, 735
- Li et al. (2004) Li, J., Kastner, J. H., Prigozhin, G. Y., Schulz, N. S., Feigelson, E. D., & Getman, K. V. 2004, ApJ, 610, 1204
- Lucy (1974) Lucy, L. B. 1974, AJ, 79, 745
- Maccacaro et al. (1988) Maccacaro, T., Gioia, I. M., Wolter, A., Zamorani, G., & Stocke, J. T. 1988, ApJ, 326, 680
- Malov & Nikitina (2011) Malov, I. F., & Nikitina, E. B. 2011, Astronomy Reports, 55, 19
- Manchester et al. (2005) Manchester, R. N., Hobbs, G. B., Teoh, A., & Hobbs, M. 2005, AJ, 129, 1993
- Marelli et al. (2011) Marelli, M., De Luca, A., & Caraveo, P. A. 2011, ApJ, 733, 82
- Mignani et al. (2010) Mignani, R. P., Pavlov, G. G., & Kargaltsev, O. 2010, ApJ, 720, 1635
- Misanovic et al. (2008) Misanovic, Z., Pavlov, G. G., & Garmire, G. P. 2008, ApJ, 685, 1129
- Monet et al. (2003) Monet, D. G., et al. 2003, AJ, 125, 984
- Mori et al. (2001) Mori, K., Tsunemi, H., Miyata, E., Baluta, C. J., Burrows, D. N., Garmire, G. P., & Chartas, G. 2001, New Century of X-ray Astronomy, 251, 576
- Pavlov et al. (1995) Pavlov, G. G., Shibanov, Y. A., Zavlin, V. E., & Meyer, R. D. 1995, The Lives of the Neutron Stars, 71
- Pavlov et al. (2009) Pavlov, G. G., Kargaltsev, O., Wong, J. A., & Garmire, G. P. 2009, ApJ, 691, 458
- Possenti et al. (2002) Possenti, A., Cerutti, R., Colpi, M., & Mereghetti, S. 2002, A&A, 387, 993
- Predehl & Schmitt (1995) Predehl, P., & Schmitt, J. H. M. M. 1995, A&A, 293, 889
- Preibisch et al. (2005) Preibisch, T., et al. 2005, ApJS, 160, 401
- Roeser et al. (2010) Roeser, S., Demleitner, M., & Schilbach, E. 2010, AJ, 139, 2440
- Ruderman & Sutherland (1975) Ruderman, M. A., & Sutherland, P. G. 1975, ApJ, 196, 51
- Siegman et al. (1993) Siegman, B. C., Manchester, R. N., & Durdin, J. M. 1993, MNRAS, 262, 449
- Skrutskie et al. (2006) Skrutskie, M. F., Cutri, R. M., Stiening, R., et al. 2006, AJ, 131, 1163
- Tepedelenlioǧlu & Ögelman (2005) Tepedelenlioǧlu, E., & Ögelman, H. 2005, ApJ, 630, L57
- Tepedelenlioǧlu & Ögelman (2007) Tepedelenlioǧlu, E., & Ögelman, H. 2007, ApJ, 658, 1183
- Tiengo et al. (2011) Tiengo, A., Mignani, R. P., de Luca, A., Esposito, P., Pellizzoni, A., & Mereghetti, S. 2011, MNRAS, 412, L73
- Verbiest et al. (2010) Verbiest, J. P. W., Lorimer, D. R., & McLaughlin, M. A. 2010, MNRAS, 405, 564
- Wilms et al. (2000) Wilms, J., Allen, A., & McCray, R. 2000, ApJ, 542, 914
- Yakovlev & Pethick (2004) Yakovlev, D. G., & Pethick, C. J. 2004, ARA&A, 42, 169
- Yan et al. (1998) Yan, M., Sadeghpour, H. R., & Dalgarno, A. 1998, ApJ, 496, 1044
- Zacharias et al. (2004) Zacharias, N., Monet, D. G., Levine, S. E., Urban, S. E., Gaume, R., & Wycoff, G. L. 2004, Bulletin of the American Astronomical Society, 36, 1418
- Zharikov et al. (2006) Zharikov, S., Shibanov, Y., & Komarova, V. 2006, Advances in Space Research, 37, 1979
- Zavlin & Pavlov (2004) Zavlin, V. E., & Pavlov, G. G. 2004, ApJ, 616, 452
- Zavlin et al. (1996) Zavlin, V. E., Pavlov, G. G., & Shibanov, Y. A. 1996, A&A, 315, 141
- Zhang et al. (2005) Zhang, B., Sanwal, D., & Pavlov, G. G. 2005, ApJ, 624, L109