Fermi Gamma-Ray Burst Monitor Science Highlights
Abstract
Three years after the launch of the Fermi Gamma-ray Space Telescope, both of its scientific instruments are operating perfectly and continuing to make breakthroughs in astrophysics, particle physics, and atmospheric science. I report here on the highlights of the scientific program of the Fermi Gamma-ray Burst Monitor (GBM).
1 The GBM instrument
The Gamma-ray Burst Monitor (GBM) is the secondary instrument on board the Fermi Gamma-ray Space Telescope, and is the successor to the Burst And Transient Source Experiment (BATSE) on the Compton Gamma-ray Observatory. Heritage from BATSE is evident in GBM detector technology, scientific agenda, and in the composition of the team which designed, built and contributes to its operation. The main science objective of GBM is to complement the observations of Gamma-Ray Bursts (GRBs) by the primary instrument on board Fermi, the Large Area Telescope (LAT) [6].
GBM is composed of 14 scintillators, distributed around the spacecraft to provide a full view of the sky, with lesser sensitivity to regions far off the z-axis axis of the spacecraft, which is aligned with the LAT boresight. Through the use of two different types of scintillating materials, GBM has broader energy coverage than its predecessor, BATSE. At low energies, 8 keV - 1 MeV, thin (1.27 cm) Sodium Iodide (NaI) disks with differing orientations provide a directional response that enables localization of observed sources to accuracies of a few degrees on the sky [19]. They are complemented for studies of energy spectra by two thicker (12.7 cm) Bismuth Germanate (BGO), which are sensitive between 200 keV and 40 MeV. All 14 detectors are powered by a single Power Supply Box (PSB), with independent high-voltage supplies to the photomultiplier tubes (PMTs) encased with each scintillator. A Data Processing Unit provides control of the PSB, readout and digitization of the detector signal, and communication with buses on the spacecraft that allow commanding of the instrument and packaging of the scientific and diagnostic data for transfer to the ground. A full description of GBM is given in [41].
2 GBM Operation
GBM records data continuously throughout its 90 minute orbit, except during passages through the South Atlantic Anomaly (SAA) where the high-voltages to the PMTs are disabled to prevent life-shortening damage to the PMTs. The unshielded scintillators record a mixture of cosmic-ray background (primaries and secondaries) and contributions from gamma-ray sources (mostly galactic). Cosmic-ray background contributions dominate, with event rates that vary according to geomagnetic latitude, but are about one [two] thousand counts per second for the NaI [BGO] detectors. The event rate variation and relative contributions are energy-dependent, and may also be affected by solar and magnetospheric activity. GBM is thus a heavily background-limited instrument and is most effective at detecting a source which varies on time-scales that can be distinguished from the orbital variations of the background. This is accomplished in three ways: triggering on impulsive sources, measurements of count rate changes when sources rise from and set behind the Earth, and extraction of periodic signals indicating pulsar activity from the residuals in the data after careful cleaning, fitting, and subtraction of measured trends in detector count rates.
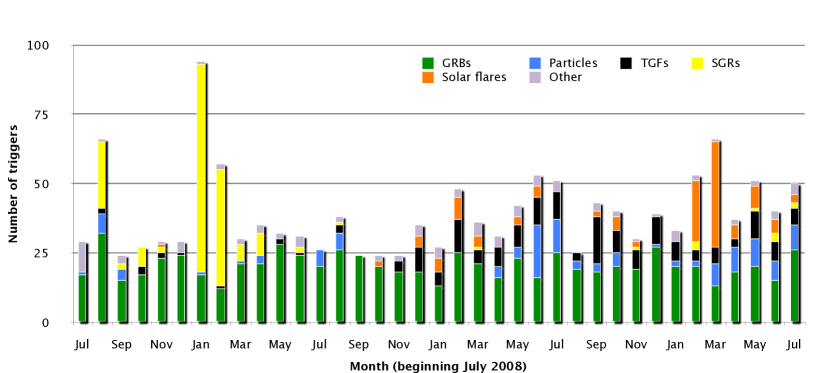
Triggering on impulsive sources occurs when at least two detectors register a statistically significant increase in count rates above background (16 s average) in one or more time intervals between 16 and 4096 ms in at least one of four energy bands (nominally 25-100 keV, 50-300 keV, above 100 keV, or above 300 keV). Currently, 30 trigger algorithms are deployed, with overlapping time windows and significance levels designed to maximize the probability of detecting sources of interest while minimizing nuisance triggers from magnetospheric activity or accidental triggers. All but four of the algorithms operate solely using the NaI detectors, with algorithms using the BGO detectors implemented after launch to maximize sensitivity to Terrestrial Gamma-ray Flashes (TGFs). The 25-100 keV algorithms are now restricted to short time-scales (less than 0.256 s) to reduce the number of particle triggers while keeping sensitivity to the main source of low-energy triggers, Soft Gamma-ray Repeaters (SGRs). The 50-300 keV energy range is the canonical BATSE trigger band, which maximizes sensitivity to GRBs and covers the energy range where background rates are most stable. Figure 1 shows the 3-year trigger history of GBM, with the color-coding reflecting the nature of the trigger. The deployment and removal of algorithms can be discerned in the decrease of noise triggers and increase in TGF triggers. Increasing solar activity is reflected in the solar flare trigger rate, whilst the sporadic activity of SGR sources follows a less predictable pattern.
GBM in trigger mode is not especially sensitive to most galactic sources, which are either relatively steady or vary on time-scales longer than 4 s. Because their emission is typically more persistent than seen in triggered bursts, GBM can accumulate a source signal over long exposures by measuring and accumulating the slight steps in count rates in detectors which have a favorable viewing angle when the source sets behind and rises from the Earth’s limb. This Earth Occultation technique requires careful fitting of background rates in the time window before and after the expected step, including steps from interfering sources which may be occulted in the same time window, and uses the modeling of the time-varying response of the GBM detectors during the exposure. In this way, source fluxes can be calculated over a long baseline, with about a 100 mCrab daily sensitivity at 20 keV, that increases to just under 10 mCrab over long exposures taking into account systematic effects. The Earth Occultation technique is described in [50], with two catalogs, one above 100 keV [15] and one covering observations of 209 monitored sources above 8 keV, of which 109 sources are high-confidence detections [50]. Long-term lightcurves for all the monitored sources are regularly updated and available online111 http://heastro.phys.lsu.edu/gbm.
Many galactic sources of hard X-rays also exhibit periodic signals which can be extracted by fitting and subtracting Fermi’s orbital variations and source occultation steps in the continous GBM data, excluding regions of impulsive activity, and searching for periodicity from known and unknown sources in the residuals. Using this pulsar technique, GBM is sensitive to periodic sources with frequencies between 1 mHz and 2 Hz, and monitors 32 accretion-powered pulsars, of which 26 are detected, 18 in outburst. Long-term pulsed flux lightcurves and frequencies are regularly updated and available online222 http://gammaray.nsstc.nasa.gov/gbm/science/pulsars.
These three methods, triggering, Earth Occultation, and pulsar techniques, allow GBM to pursue a broad scientific agenda, some highlights of which are presented in the following sections on GRBs, galactic sources, and solar system science.
3 Gamma-Ray Bursts

The primary scientific mission of GBM is the observation of GRBs. In combination with the LAT, GBM enables broad-band spectroscopy over nearly seven decades of energy of the GRBs detected in common. By itself, GBM triggers on approximately 250 GRBs per year, providing localizations, lightcurves and a measure of the intensity of the GRB in near real-time through the GRB Coordinates Network333 http://gcn.gsfc.nasa.gov/ and at the Fermi Science Support Center (FSSC). The operations team delivers to the FSSC full science data, following regular downlink, hours after the burst, and processed data, including instrument responses and refined localizations, in the days that follow. GBM is a prolific burst detector because of its 85% duty cycle (outside SAA passages) and wide field-of-view, so that any point in the sky has about a 50% coverage (with high declination sources visible all the non-SAA time during certain times in the Fermi precession cycle). Although the localization capabilities of GBM are modest compared to imaging instruments, they are good enough to assist searches for electromagnetic counterparts to gravitational wave candidates, and for plausible GRBs that might be related to central-engine-driven supernovae. Two such searches [47, 20] revealed no GRB candidates that might be associated with the relativistic outflows from Type 1bc and 1c supernovae.
A sky-map of the 491 GRBs from the first GBM GRB catalog [43], which covers two years of observations, can be seen in Figure 2, showing that the GRBs are distributed isotropically on the sky and that the fraction of short-to-long bursts (20%) is comparable to that seen by BATSE. Spectral analyses of these GRBs are presented in [27] and a searchable database of the catalog is available through the FSSC444 http://heasarc.gsfc.nasa.gov/W3Browse/fermi/fermigbrst.html.
The BGO detectors provide enhanced high-energy coverage relative to BATSE, allowing analyses with good statistics of the MeV emission from GRBs [9], and enabling detailed studies of the spectral [31] and temporal [8] characteristics of the brightest short bursts, which generally have spectra that turn over at higher energies than long bursts. Comparing short and long bursts, Guiriec et al. [31] find that short bursts are similar to long bursts in their time-resolved spectral characteristics, but with behavior that is stretched to higher energies. Ghirlanda, Ghisellini, & Nava [25] conclude from their analysis of GBM spectral data that the emission mechanism in short and long bursts may be very similar.
The map in Figure 2 also shows the synergy between GBM and the Swift satellite, with 64 GRBs triggered in common by GBM and the Swift Burst Alert Telescope (BAT). Bursts observed by the Swift BAT are likely to be localized well enough for follow-up, first by the X-ray and UV instruments on Swift, and then by sensitive optical telescopes that can both measure the redshift and detect the host galaxy of the GRB progenitor. The Swift BAT, unlike GBM, has limited energy coverage, so that studying the energetics of the prompt gamma-ray emission is often difficult. The combination of the broad-band afterglow energetics and host characteristics of Swift-detected bursts, with the knowledge of prompt gamma-ray emission spectroscopy provided by GBM, yields a much clearer picture for the bursts detected in common. Studies of such bursts include GRB 080810 [42] and GRB 091024 [29], and ensemble analyses of the common GBM-Swift sample are presented in [45] for the afterglow, [48] for the prompt emission, and [28] who estabish the rest-frame properties of a sample of GBM-detected bursts which have redshift measurements.
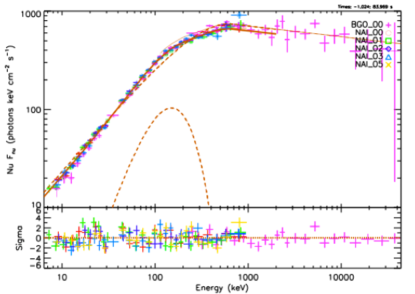
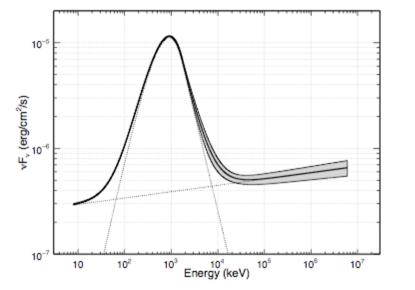
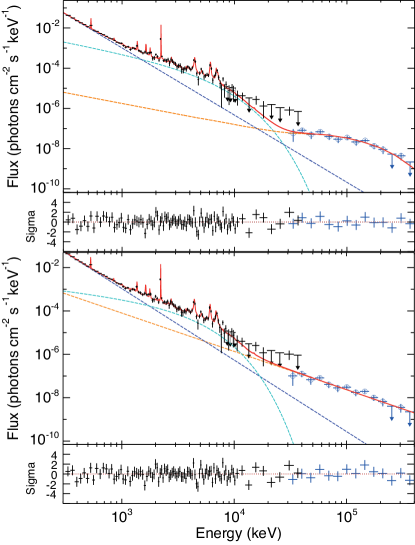
GRB spectra have typically been fit using the Band function [7], two power laws smoothly joined with curvature depending on the power law indices and a characteristic energy defined as the energy at which peak power per energy decade (Fν) occurs. The Band function is an empirical parameterization of what is believed to be non-thermal radiation from accelerated particles in a relativistic outflow, most likely synchrotron emission. The GBM spectral catalog [27] confirms the preference for the Band function, or the closely related smoothly-broken power-law function, over simpler models such as power-laws, or power-laws with exponential cut-offs, in most of the bursts where the photon statistics allow parameters to be constrained despite the complexity of the fit. In some bright bursts, however, the GBM data show the presence of deviations from the Band function at both low and high energies, indicating that this empirical function may not always represent well the physical processes in GRBs. Notably, GRB100724B exhibits a spectral bump that is well fit by a thermal component underlying the non-thermal emission (Figure 3, top). The relative magnitudes of the thermal (fit by a blackbody function) and non-thermal (fit by the Band function) components are used to deduce that the relativistic outflow must be magnetized [32]. GRB090902B [2] shows a large excess at low energies in the GBM data and the deviation from the Band function is obvious over a wide energy range. At higher energies, the LAT also sees this deviation as a high-energy excess above the Band function. A representation of the overall spectral shape of GRB090902B in Fν is shown in the lower panel of Figure 3, with the extra spectral component visible both at low energies in GBM and at high energies in the LAT. In fact, this behavior is common among LAT-detected GRBs, with all but one [1] of the bright LAT-detected bursts showing evidence in the LAT data for excesses above the Band function extrapolation from GBM to high energies [4, 3]. It is difficult to associate the extra high-energy spectral component with a particular physical mechanism as it does not exhibit the spectral turnover one might expect for an inverse Compton contribution, although statistics are poor in the multi-GeV regime for LAT GRBs and such a turnover might occur at energies above this. More seriously, one would not expect an inverse Compton component to extend to low energies and account for the GBM low-energy excess. If the high-energy excess is indeed an inverse Compton bump it is likely these deviations from the Band function are not explained by a common physical mechanism across six decades of energy, but do point to the inadequacy of the Band function to represent the GRB physical emission mechanisms over a broad energy range. The wealth of spectral data provided by Fermi has produced interpretations and modeling of GRB spectra beyond the Band function including photospheric models [46], and purely physical modeling of the emission as synchrotron radiation from power-law distributions of electrons, without using empirical fits [12].
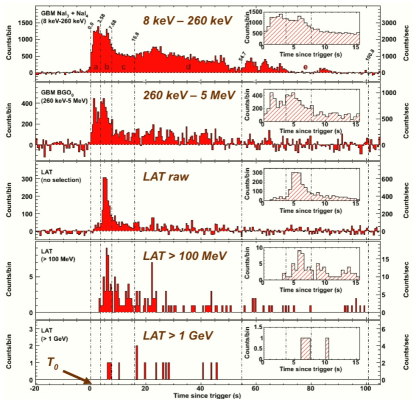
The ability to measure the prompt gamma-ray emission over such a wide energy band has yielded other surprises: in bright LAT-detected bursts, it is clear that the onset of the high-energy emission lags that of the emission seen in GBM. Figure 4 shows the lightcurve from GRB 080916C in multiple energy bands. The first peak is missing above 100 MeV, although joint GBM-LAT spectral fits do not suggest a cut-off is required, indicating that GRB spectra may evolve from soft to hard before exhibiting the typical softening behavior over time observed by previous experiments. Other surprises include the persistence of the high-energy emission long after GBM ceases to discern impulsive peaks, although the smoothness of this long-lived emission would make it difficult to detect in the background-limited GBM detectors. Joint Swift-LAT observations of GRB090510 [44] suggest this long-lived LAT emission is more akin to afterglow radiation than continued central engine activity. Finally, the emergence of intense radiation from very small source regions (inferred by the variability time-scales of GRB peaks) with no evidence for quashing of the high-energy emission through pair-production interactions with the dense lower-energy photon fields, implies very large mimimum Bulk Lorentz factors in the relativistic outflows. These factors could be as large as 1000, though a geometry with multiple emission zones reduces this minimum Lorentz value by a factor of about 5 [51].
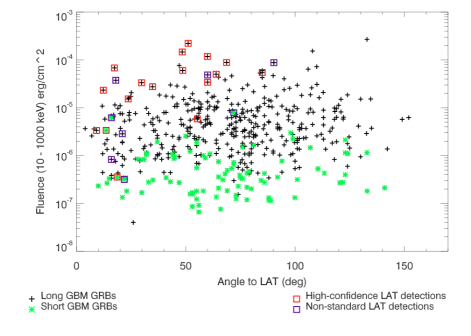
Generalizations about high-energy emission from GRBs are difficult given the small number of bright GRBs detected by the LAT. Figure 5 shows the range of fluences seen in the GBM catalog bursts, plotted against angle to the LAT boresight, with the color-coding distinguishing short from long bursts, and open squares showing the LAT-detected GRBs. Although the fluence range sampled by GBM is broad, the LAT is seeing only the brighter short and long GRBs seen by GBM, with greater sensitivity to weaker bursts on-axis and when detection criteria are loosened. To first order the detectability at high energies is determined by the brightness at low energies rather than the low-energy spectral parameters, which is as one might expect if the LAT is seeing extra spectral components that are not clear extrapolations of the low-energy spectral form.
4 Galactic Sources
4.1 Soft Gamma-ray Repeaters
The main galactic (non-solar system) source of GBM triggers is the population of highly-magnetized neutron stars known as magnetars, which includes Soft Gamma-ray Repeaters (SGRs) and Anomalous X-ray Pulsars (AXPs). Bursts from magnetars are short ( 100 ms), spectrally softer than GRBs, and can occur in isolation or as multiple event episodes during an SGR activation. As shown in Figure 1, GBM has seen several activations from magnetars, beginning the month after launch, with two sources responsible for the three main outbursts. No large outbursts have been seen since April 2009, although three additional magnetars have shown bursting activity detected by GBM, including SGR 0418+5279, which was discovered by GBM and by other instruments which detected at least one of the three bursts seen by GBM from this source [33].
Spectral and temporal properties from these outbursts have been published [36, 38, 34]. One of the significant discoveries of Lin et al. [38], who analyzed the outburst of SGR 0501+4516, utilized the unique broad band spectral capability of GBM to settle an open issue in the field. The energy spectrum of SGR bursts is often represented either by a thermal bremsstrahlung model or by the so-called Comptonized model, a power-law which decays exponentially above a peak energy. Previous experiments had measured an inverse relationship between the intensity and the hardness of SGR bursts [26], whilst others saw a direct relationship [22]. The earlier studies used data from two distinct SGRs, which were different again from the source studied in [38]. The fluence range over which GBM detects bursts encompasses those of the samples used in both of these studies owing to the combination of a spectral range well-suited for magnetar spectroscopy, wide field-of-view, duty cycle, and sensitivity. Lin et al [38] show that both observations are correct: Figure 6 shows that there is a minimum fluence above which the direct relationship between hardness (expressed for the first time as peak energy) and burst fluence holds, whilst below this fluence the inverse relationship is seen.
It is difficult to see the quiescent emission from magnetars with GBM, but searches for periodicity in the GBM continuous data between 27 and 300 keV show the recovery of the neutron star period for four magnetars [37].

4.2 X-Ray Binary Systems
Accreting binary systems are prime candidates for both the Earth Occultation and pulsar techniques using GBM data. To date, 86 such systems have been detected using Earth Occultation (of which 74 are neutron-star binaries), and 26 neutron-star systems are seen via their pulsed emission, whether persistent or in outburst. The value of GBM observations of these sources comes from the continuous monitoring of their flux, spectrum, and frequency, which can alert narrow-field instruments as well as observers at other wavelengths that the source is undergoing an outburst or a state transition, frequency glitch, or even a torque reversal. Optical monitoring of the binary system A 0535+26 was correlated with GBM-measured outbursts of the source yielding broadband measurements of the source during a giant outburst in which QPOs were seen in the GBM data [13]. Torque switching is seen in several binary systems monitored by GBM. The High-Mass X-ray Binary OAO 1657-415 shows a correlation between flux level and spin-up frequency at high spin-up rates, indicating that an accretion disk has formed in this wind-driven system (Figure 7). At lower spin-up rates and when the star is spinning down, there is no such relationship, despite the low-spin flux levels spanning an intensity range comparable to that in the high spin-up state [35]. It is not known what causes this accretion-disk to form and persist, and overall the source’s long-term behavior is interesting, with an orbit that appears to be decaying over time. Other systems exhibit rarer torque reversals, including the ultra-compact Low-Mass X-ray Binary 4U 1626-67, which before the launch of Fermi had last been observed by Chandra in a spin-down state. GBM found the source in a spin-up state, its first torque reversal since the Ginga-ROSAT era [14].
Some low-mass X-ray binary systems are also known for their bursting activity, with Type 1 X-Ray bursts indicating thermonuclear explosions on the accreting neutron star. GBM is sensitive to these events, although their peak shapes (long and smoothly rising) and their soft thermal (temperatures of 2.5 - 3 keV) spectra make it unlikely that such bursts will trigger the instrument. A search for intermediate and long Type 1 X-Ray Bursts in the GBM continuous data has uncovered many candidates, particularly for long Type 1 bursts. GBM is expected to see only the tip of the emission, and with peaks lasting tens of seconds in GBM, we expect these are bursts lasting 15 minutes or so in more sensitive X-ray detectors. Whilst the uncollimated nature of the GBM detectors means source confusion is a problem in crowded regions, the collection of long bursts clearly associated with 4U 0614+09 has allowed us to place recurrence time-scale estimates on this source (in a low mass-accretion state) of days [40].

Black hole binary systems have also proved revealing, with long-term Earth Occultation monitoring of flux levels over a broad energy range from Cyg X-1 pointing to five state transitions that were simultaneously or subsequently widely observed by other satellites and ground-based telescopes [16]. Black hole systems are among the high-confidence Earth Occultation detections above 100 keV, making GBM particularly useful to monitor these sources for state transitions indicated by their energy-dependent flux variations.
4.3 The Crab Nebula
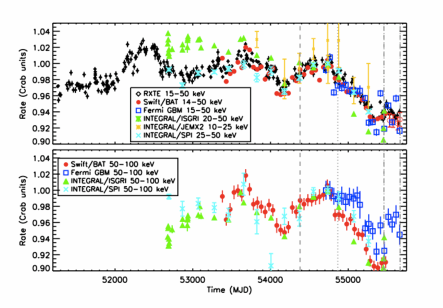
One of the brightest sources uncovered in the Earth Occultation measurements has proved unexpectedly rich. The Crab Nebula, long used as a standard candle for X-ray astronomy, showed a decline in flux of 7% over the first two years of GBM Earth Occultation measurements. After verification using observations by other instruments, it has emerged that the Crab is actually a variable source over a long baseline in time [49], as can be seen in Figure 8.
5 Solar System Science
5.1 The Sun
Solar flare triggers have become increasingly common as this solar cycle reaches its peak. On June 12 2010, GBM registered its first flare with measurable nuclear lines, which were measured up to a few MeV, in addition to the neutron capture and annihilation lines. The LAT saw photons up to 400 MeV. Although the joint GBM-LAT spectrum did not distinguish between a model where the high-energy emission was attributed to bremsstrahlung-radiating electrons with energies of hundreds MeV from one where hadronic primaries produced pions that decayed into gamma rays, several non-thermal components were required to explain the broad-band emission underlying the nuclear lines. The intensity of the line emission was quite surprising for an M-class flare, and the most interesting aspect of this flare is that the MeV bremsstrahlung, the high-energy emission, and the line emission were temporally coincident within seconds, implying that acceleration to 100s MeV from the mildly relativistic electrons responsible for the lower-energy bremsstrahlung component took only seconds [5]. Figure 9 shows the spectral fit to this flare, with the two different fits to the high-energy component featured in separate panels.
Searches for quasi-periodic pulsations (QPPs) from bright GBM-detected solar flares revealed no such behavior. The authors in [30] exposed possible methodological problems with previous searches that had uncovered QPPs in flares detected by the Reuven Ramaty High Energy Solar Spectroscopic Imager (RHESSI [39]).
5.2 Terrestrial Gamma-ray Flashes
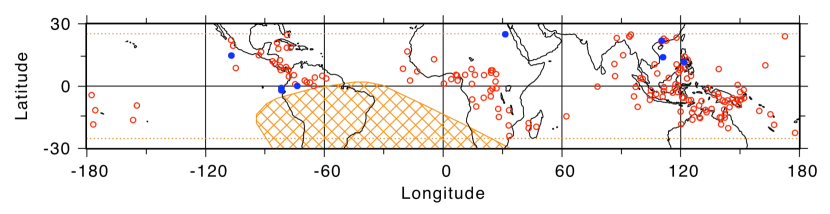
In the first three years of operation, GBM triggered on 170 Terrestrial Gamma-ray Flashes (TGFs), with the rate increasing from one per month to two per week following flight software changes in November 2009. TGFs are brief (usually shorter than 1 ms) hard bursts associated with electron acceleration in the electric fields near the tops of thunderstorm clouds where lightning activity occurs. Fermi has a detection horizon for TGFs of several hundred kilometers, so that if one looks at the sub-spacecraft position at the times of TGF triggers (Figure 10) the cumulative pattern follows the distribution of lightning activity within the Fermi orbital boundaries. Coincident VLF radio signals measured with the World Wide Lightning Network (WWLLN) allow the geolocation of 30% of GBM-detected TGFs, and strengthen the association of TGFs with particular regions of storm activity [18]. The discharges measured by WWLLN are typically simultaneous with the TGF emission. Closer relationships between TGFs and radio signals can be established using instrumentation that records the discharge waveform. The Duke University detectors were used to show that the radio waveform closely follows the gamma-ray pulse shape of the TGF [21]. Temporal characteristics of GBM TGFs are presented in [10, 23], showing that GBM is sensitive to single, multiple and overlapping TGF peaks, with pulse fitting of 150 TGFs indicating two distinct pulse shapes, one of them asymmetric and one Gaussian [24].
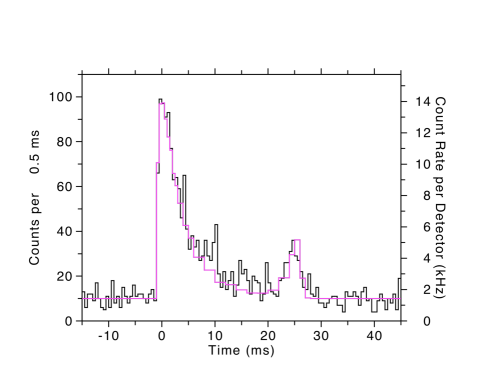
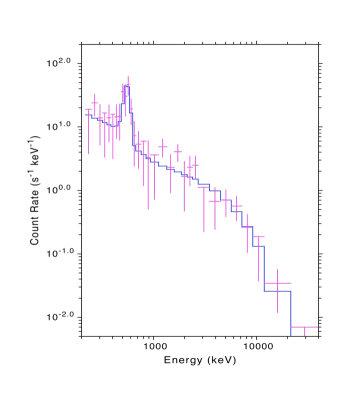
A smaller horizon applies to those TGFs which are detected as an electron beam rather than as bremsstrahlung emission from the electron cascade. These electron TGFs are much rarer, occurring when electrons in the cascade are captured by a magnetic field line, spiralling along the field line with a distribution of pitch angles and path lengths, and captured by Fermi which is positioned along the magnetic field line and can be thousands of km away. Electron beam TGFs are longer than gamma-ray TGFs and were probably detected in both BATSE and RHESSI instruments. Measurement of radio signals from lightning at one of the geomagnetic footprints for one electron TGF [17] seen by GBM strengthened the case. Magnetic mirroring of the electrons from another electron beam TGF seen by GBM produces a secondary peak with the expected peak separation for the field line geometry and the position of Fermi (Figure 11, left). The decisive measurement, however, was the detection of strong annihilation lines at 511 keV in the GBM spectra for bright electron TGFs (Figure 11, right) indicating the presence of positrons which annihilated to produce gamma-ray lines upon impact with Fermi. The strength of the lines indicates that the electron beams have an antimatter fraction of about 20% [11].
6 Conclusions
In its first three years of operation, GBM has enabled a broad scientific program covering sources as close as 10 km above the Earth’s surface out to explosions in the earliest universe. The instrument has functioned perfectly from the day the high voltages were turned on in June 2008, and continues to operate without problems. Improvements by the instrument team in the areas of source localization, detector calibration, and new operating modes that will provide high temporal resolution data over much or all of the orbit, are in progress. All GBM data are publicly available at the FSSC555 http://fermi.gsfc.nasa.gov/ssc/data/access/gbm/.
References
- [1] Abdo, A. et. al., Science, 2009, 323, 1688.
- [2] Abdo, A. et. al., ApJL, 2009, 706, L138.
- [3] Ackermann, M. et. al., ApJ, 2010, 716, 1178.
- [4] Ackermann, M. et. al., ApJ, 2011, 729, 114.
- [5] Ackermann, M. et. al., ApJ, 2012, 745, 144.
- [6] Atwood, W.B. et al., ApJ, 2009, 697, 1071.
- [7] Band, D.L. et al., ApJ, 1993, 413, 281.
- [8] Bhat, P.N. et al., ApJ, 2012, 744, 141.
- [9] Bissaldi, E. et al., ApJ, 2011, 733, 97.
- [10] Briggs, M.S. et al., J.Geophys.Res., 2010, 115, A07323.
- [11] Briggs, M.S. et al., Geophys.Res.Lett., 2011, 38, L02808,5.
- [12] Burgess, J.M. et al., ApJ, 2011, 741, 24.
- [13] Camero-Arranz, A. et al., submitted to ApJ.
- [14] Camero-Arranz, A. et al., ApJ, 2010, 708, 1500.
- [15] Case, G.L. et al., ApJ, 2011, 729, 105.yy
- [16] Case, G.L. et al., submitted to ApJ.
- [17] Cohen, M.B. et al., Geophys.Res.Lett., 2010, 37, L18806,4.
- [18] Connaughton, V. et al., J.Geophys.Res., 2010, 115, A12307.
- [19] Connaughton, V. et al., in preparation.
- [20] Corsi, A. et al., ApJ, 2011, 741, 76.
- [21] Cummer, S. et al., Geophys.Res.Lett., 2011, 38, L14810.
- [22] Fenimore, E.E. et al., ApJ, 1994, 432, 742.
- [23] Fishman, G.J. et al., J.Geophys.Res., 2011, 116, A07304.
- [24] Foley, S. et al., submitted to J.Geophys.Res.
- [25] Ghirlanda, G., Ghisellini, G., & Nava, L., MNRAS, 2011, 418, 109.
- [26] Göǧüş, E. et al., ApJ, 2001, 558, 228.
- [27] Goldstein, A., to appear in ApJSupp.
- [28] Gruber, D. et al., A&A, 2011, 531, 20.
- [29] Gruber, D. et al., A&A, 2011, 528, 15.
- [30] Gruber, D. et al., A&A, 2011, 533, 61.
- [31] Guiriec, S. et al., ApJ, 2010, 725, 225.
- [32] Guiriec, S. et al., ApJ, 2011, 727, 33.
- [33] van der Horst, A. et. al., ApJL, 2010, 701, L1.
- [34] van der Horst, A. et. al., to appear in ApJ.
- [35] Jenke, P. et al., submitted to ApJ.
- [36] Kaneko, Y. et al., ApJ, 2010, 710, 1335.
- [37] Kuiper, L., ter Beek, F., & Hermsen, W., in preparation for submission to ApJ.
- [38] Lin, L. et. al., ApJ, 2011, 739, 87.
- [39] Lin, R. et al., Sol. Phys., 2002, 210, 3.
- [40] Linares, M. et al., 2011, Proc. 4th MAXI workshop, http://maxi.riken.jp/FirstYear, and in preparation.
- [41] Meegan, C.A. et. al., ApJ, 2012, 702, 791.
- [42] Page, K.L. et al. MNRAS, 2009, 400, 134.
- [43] Paciesas, W.S. et al., to appear in ApJSupp.
- [44] De Pasquale, M. et. al., ApJL, 2010, 709, L146.
- [45] Racusin, J. et al., ApJ, 2011, 738, 138.
- [46] Ryde, F. et. al., ApJL, 2010, 709, L172.
- [47] Soderberg, A.M., Nature, 2010, 463, 513.
- [48] Virgili, F. et al. submitted to MNRAS.
- [49] Wilson-Hodge, C.A. et al., ApJL, 2011, 727, L40.
- [50] Wilson-Hodge, C.A. et al., submitted to ApJSupp.
- [51] Zou, Y., Fan, Y., & Piran, T., ApJ, 2011, 762, 2.