Fast evolving size of early-type galaxies at and the role of dissipationless (dry) merging
Abstract
We present the analysis of a large sample of early-type galaxies (ETGs) at aimed at tracing the cosmic evolution of their size and compare it with a model of pure dissipationless (dry) merging in the CDM framework. The effective radius depends on stellar mass as with at all redshifts. The redshift evolution of the mass- or SDSS-normalized size can be reproduced as with , with the most massive ETGs possibly showing the fastest evolutionary rate (). This size evolution slows down significantly to if the ETGs at are removed from the sample, suggesting an accelerated increase of the typical sizes at , especially for the ETGs with the largest masses. A pure dry merging CDM model is marginally consistent with the average size evolution at , but predicts descendants too compact for progenitor ETGs. This opens the crucial question on what physical mechanism can explain the accelerated evolution at , or whether an unclear observational bias is partly responsible for that.
keywords:
galaxies: formation – galaxies: evolution – galaxies: ellipticals and lenticulars, cD1 Introduction
Early-type galaxies (ETGs) are important probes of structure formation and massive galaxy evolution. At , the ETG stellar mass function shows a downsizing evolution apparently difficult to reproduce with the current models of galaxy formation, with the majority of massive ETGs ( M⊙) already in place at , (Pozzetti et al. 2010 and references therein). At , the information is still incomplete, but bona fide ETGs have been identified up to (e.g. Kriek et al. 2006; Cimatti et al. 2008 and references therein). These high- ETGs are characterized by old stars (1-3 Gyr), -folding decaying star formation timescales 0.1–0.3 Gyr, low specific star formation rates (SSFR Gyr-1), low dust extinction, large stellar masses (), spheroidal morphologies (although some of these systems have a disk-like component; van der Wel et al. 2011), and number densities growing rapidly from to (e.g. Fontana et al. 2009; Domínguez-Sánchez et al. 2011; Brammer et al. 2011).
A puzzling property of ETGs at is that they have smaller sizes, down to effective radii kpc, and correspondingly higher internal mass densities than present-day ETGs with the same mass (e.g. Daddi et al. 2005; Trujillo et al. 2006; van der Wel et al. 2008; Cimatti et al. 2008; Buitrago et al. 2008; Saracco, Longhetti & Andreon 2009; Williams et al. 2010; Cassata et al. 2011; Damjanov et al. 2011; Newman et al. 2011, and references therein). It is not clear yet whether the environment plays (e.g. Papovich et al. 2011; Cooper et al. 2011) or not (e.g. Rettura et al. 2010) a role in the ETG size evolution. The few available measurements of stellar velocity dispersions are consistent with those expected from the ETG sizes and confirm that these systems are truly massive (Cenarro et al. 2009; Cappellari et al. 2009; Onodera et al. 2010; van Dokkum, Kriek & Franx 2009; van de Sande et al. 2011). Several models have been proposed to explain the size–mass evolution, including dissipationless (dry) major and minor merging, adiabatic expansion driven by stellar mass loss and/or strong feedback, and smooth stellar accretion (e.g. Khochfar & Silk 2006; Bournaud, Jog & Combes 2007; Fan et al. 2008; Nipoti et al. 2003, 2009a, 2009b; Naab et al. 2009; Hopkins et al. 2009; Oser et al. 2011). However, the global picture is far from being clear. In this paper, we exploit a large sample of ETGs in order to investigate the evolution of their size as a function of redshift and mass, and compare it with the predictions of cosmological models of structure formation.
2 The sample
In order to improve statistically on previous studies, we selected a large sample of 1975 ETGs at by collecting data from the literature and public data, requiring the availability of spectroscopic redshifts (or high-quality photometric redshifts for ), stellar masses, sizes () and, when possible, age of the stellar population (see Tab. 1). The ETGs in the different subsamples share the global property to have been originally selected based on the combination of colors, spectra (or sometimes also SSFR) typical of old/passive galaxies with the confirmation of spheroidal (E/S0) morphology, or vice versa. We recall that selection criteria for ETGs are strongly correlated, with up to 85% color/spectra-selected ETGs being also morphologically E/S0 (e.g. Renzini 2006 and references therein). The ETG sizes were generally measured in the observed-frame red-optical for low-/intermediate-redshift samples and/or in the near-infrared for higher redshifts, i.e. typically sampling the rest-frame optical region at all redshifts. Recently, Damjanov et al. (2011) and Cassata et al. (2011) have shown that the sizes measured in the rest-frame UV and in the optical correlate very strongly with each other, thus excluding substantial biases dependent on the wavelength at which the size was measured. The SDSS sample of Hyde & Bernardi (2009) was included as the reference sample at .
| Sample | N | Redshift | Age | Ref. |
|---|---|---|---|---|
| SDSS | 59500 | yes | 1 | |
| COSMOS/zCOSMOS | 950 | no | 2 | |
| GOODS-N+S | 469 | yes | 3 | |
| Literature | 465 | no | 4 | |
| GMASS | 45 | no | 5 | |
| COSMOS | 12 | yes | 6 | |
| XMMU J2235-2557 | 11 | =1.39 | yes | 7 |
| K20-0055 | 9 | yes | 8 | |
| POWIR | 6 | no | 9 | |
| K20 | 4 | yes | 10 | |
| 1255–0 | 1 | yes | 11 | |
| FW-4871 | 1 | yes | 12 |
: a fraction of redshifts is photometric, Age: available stellar ages. 1. Hyde & Bernardi 2009, 2. http://cosmos.astro.caltech.edu/data/index.html, Scarlata et al. 2007, Moresco et al. 2010, 3. Cassata et al. 2011, 4. Damjanov et al. 2011, 5. Cassata al. 2008, 6. Mancini et al. 2010, 7. Strazzullo et al. 2010, 8. di Serego Alighieri et al. 2005, 9. Carrasco, Conselice & Trujillo 2010 (), 10. Cimatti et al. 2004, 11. van Dokkum et al. 2009, 12. van Dokkum & Brammer 2010.
The different subsamples were harmonized to the same cosmology ( km s-1 Mpc-1, , ), and the stellar masses and ages rescaled to the Maraston (2005) stellar population synthesis models with the Chabrier Initial Mass Function (IMF) by using empirical scaling relations of Pforr et al. (2012).
Based on the information available in the literature, the stellar mass completeness of most subsamples is at all redshifts. However, a few subsamples have : GN/DEIMOS (from Damjanov et al. 2011) and zCOSMOS at , MUNICS, K20, Mancini et al. (2010) and van Dokkum et al. (2008) at , Cassata et al. (2011) and van Dokkum et al. (2008) at . The final sample was reduced to 1080 galaxies in order to avoid mass incompleteness effects (see Section 4 for details).
3 The size – mass relation
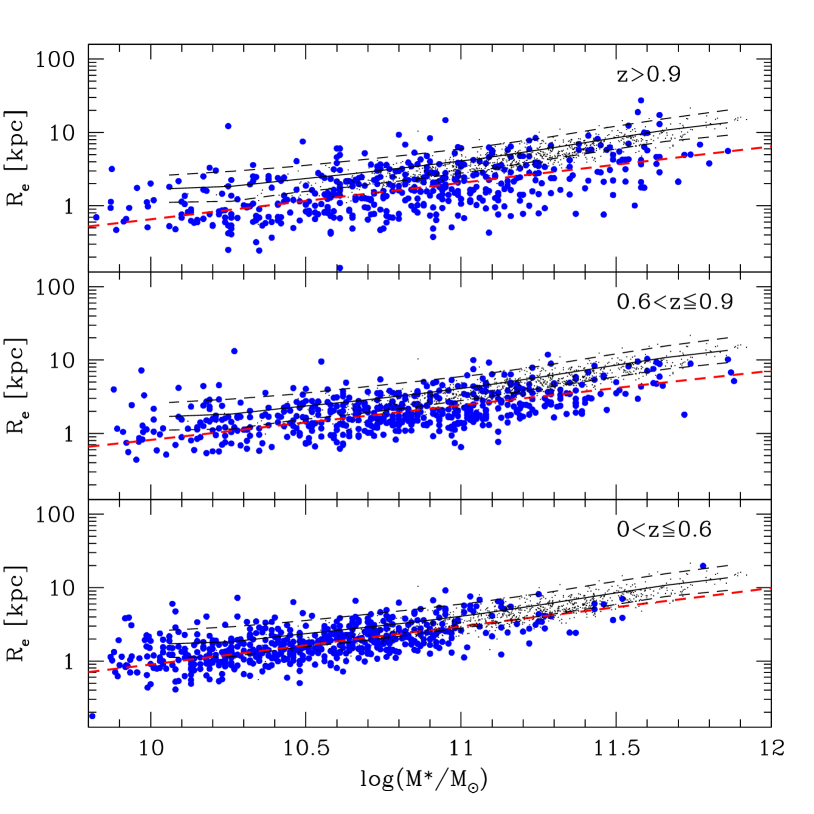
Figure 1 shows the size–mass relation in three redshift ranges with a comparable number of galaxy in each bin. A power-law fit, , applied to non-SDSS ETGs with 10.5 provides from low to high redshift in the three bins of Fig. 1, with basically independent of redshift. For instance, the ETGs with have . This result is consistent with recent works (Damjanov et al. 2011; Newman et al. 2011), and does not depend significantly on the choice of the redshift bin limits or the minimum stellar mass cuts. In comparison, the SDSS ETGs with 10.5 have 0.58, consistent with Shen et al. (2003).
4 The size – redshift relation
Fig. 2 shows the redshift evolution of the ETG size in two complementary ways: the mass-normalized radius (, where M⊙, adopting as representative value), and radius normalized to the average size of SDSS ETGs () in three mass bins. Both quantities are useful to derive the size evolution independently of the correlation between and . The evolution is parametrized by the usual functional form . Clearly, this parametrization does not mean that all high- ETGs are the direct progenitors of all low- ETGs because these galaxies evolve in the redshift range through several processes and increase their number density and mass, but it has simply the statistical meaning of indicating how the typical sizes compare at different redshifts.
In order to mitigate the potential effects of stellar mass incompleteness, for each mass bin of Fig.2 (top three panels), the galaxies with were removed from each subsample. Thus, each mass bin is always complete down to the minimum mass of the bin. For instance, the ETGs with M⊙ at and M⊙ at have been excluded from the zCOSMOS and the Cassata et al. (2011) sample respectively.
For the mass-normalized radius (Fig.2, bottom panel), we derive = -1.06 (-1.24 for , in agreement with the literature (Damjanov et al. 2011, Newman et al. 2011). This result is stable against changing between 0.4 and 0.7, the boundaries of the redshift bins, and the minimum stellar mass. The consistency of the and relations with previous results confirms that our sample, despite its somehow heterogeneous composition, can be reliably used to perform further detailed studies.
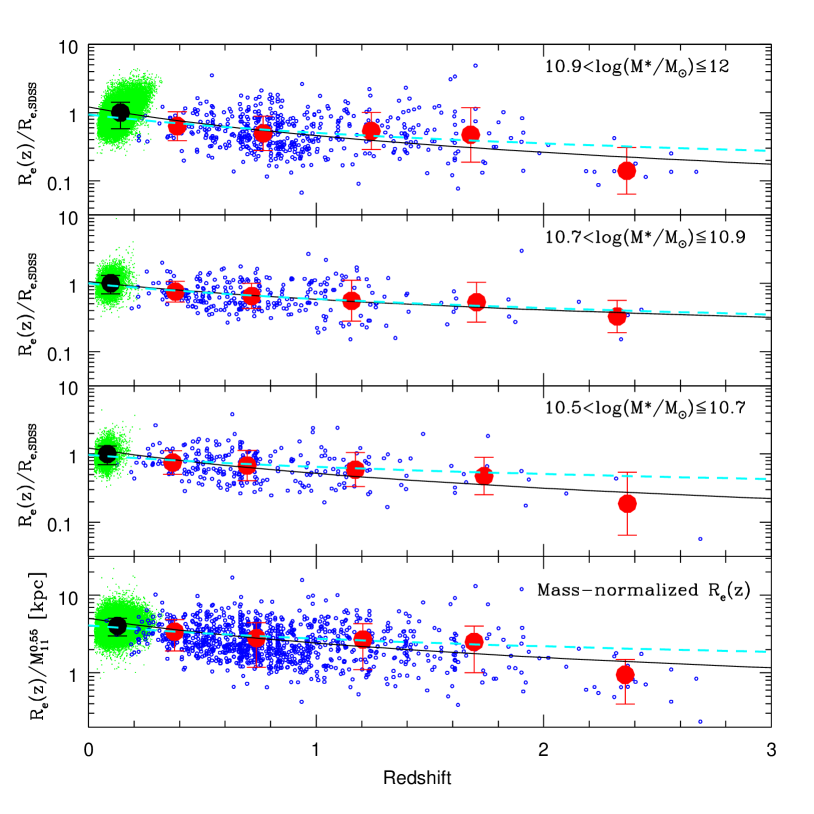
Fig. 2 (top three panels) shows normalized to . For the three bins of increasing mass, we derive =-1.23 0.15, -0.870.14 and -1.390.13. This suggests that does not significantly depend on stellar mass, although a steepening is suggested in the most massive bin. These results are stable, within the statistical uncertainties, against changes in the minimum stellar mass in the lowest mass bin, in the boundaries of the mass bins, and in the minimum age of the SDSS ETGs.
Fig. 2 also shows that the ETG size growth rate seems to increase significantly at high redshift, suggesting a slower evolution at . For the mass-normalized radius (bottom panel), becomes -0.570.15 if the ETGs at are excluded. Similarly for , becomes =-0.730.14, -0.760.13 and -0.75 0.14 if ETGs at are excluded in the three bins of increasing mass. We note that the flattening is particularly pronounced and significant in the bin of largest masses. The flattening of is also present, within the statistical uncertainties, against changing the limits of the redshift bins if we cut ETGs around . For instance, if the ETGs with are excluded in the bin with 10.9, we derive =-0.95(-0.72)0.15. The overall results presented in this section do not change if median values are used instead of the average ones, nor if the SDSS data points are excluded.
The potential role of the so-called progenitor bias (e.g. Saglia et al. 2010 and references therein) has been assessed through an age filtering by comparing the size of ETGs having ages compatible with the cosmic time passed from high- to low-. For a given redshift range and average redshift , we estimated by comparing the average size of the ETGs (having an average age ) with the size of SDSS ETGs with ages at between and , where is the cosmic time passed from to . Based on this approach, no significant or systematic changes of have been found for a variety of tested redshift ranges. For example, for ETGs with 10.9 at , we derive and respectively with and without applying the above ¨age filtering¨. Similarly, if we select the most distant ETGs (), we obtain and . If we take these results at face value, this implies that most of the evolution is unlikely to be the result of a progenitor bias due to high- ETGs being preferentially selected to be redder and more compact than lower- younger and larger ETGs missed at high-. However, we recall that, due to the heterogeneous estimates of the stellar ages in our sample, this result should be confirmed with larger and more homogeneous samples. On the other hand, we note that large ETGs are indeed absent at in the GMASS subsample (Fig. 2), that is selected based solely on morphology irrespective of colours (Cassata et al. 2008).
5 Comparison with a CDM model
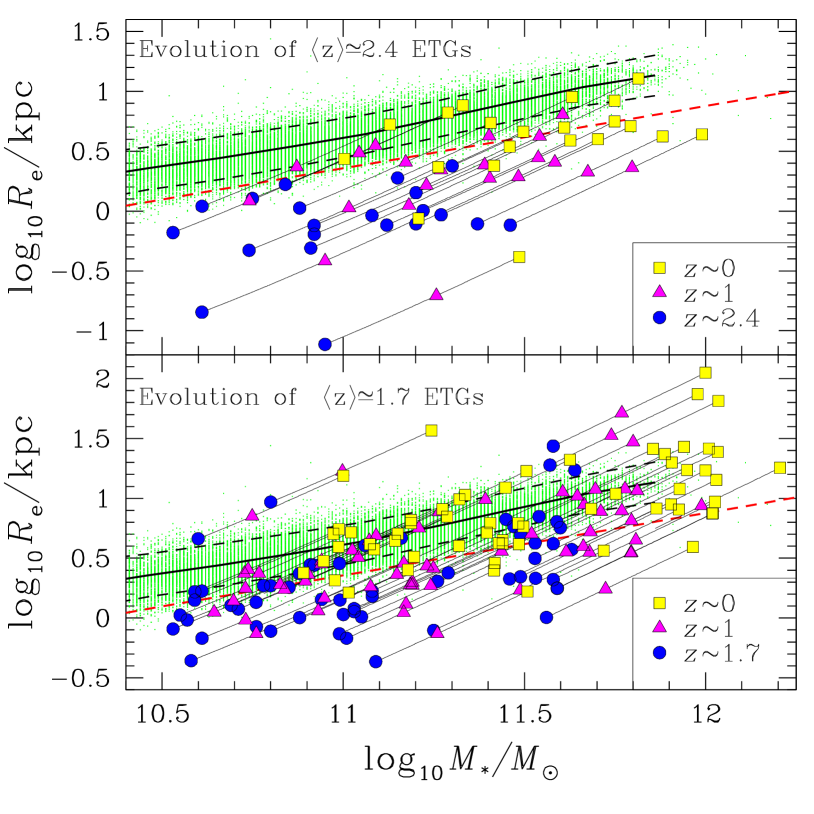
Dissipationless (dry) merging is one of the few mechanisms known to make galaxies less compact (e.g., Nipoti et al. 2003; Naab et al. 2009), so it is often invoked to explain the observed size evolution of ETGs. Here we briefly address the question of whether the observed size evolution is consistent with the merger histories of concordance cold dark matter (CDM) cosmology. For this purpose, we use the CDM-based merger models presented in Nipoti et al. (2012, hereafter N12), which are such that the variation in surface-mass density is maximized, because dissipative effects are neglected. In particular, we adopt here model B of N12, which is the most strongly evolving of their models, so the predicted size evolution must be considered an upper limit. Here we briefly describe the main properties of the model, but we refer the reader to N12 for details. For an observed ETG with measured stellar mass and effective radius , the model allows to calculate the redshift evolution of and via analytic functions calibrated on -body simulations. The galaxy is first assigned a halo mass using the redshift-dependent stellar to halo mass relation of Behroozi, Conroy, & Wechsler (2010). The halo growth-history is then computed using Fakhouri et al. (2010) fit to halo merger histories in the Millenium I and II simulations (Springel et al. 2005; Boylan-Kolchin et al. 2009). The associated growth of is obtained by assigning stellar mass to satellite halos with Behroozi et al. (2010) recipe, and considering only mergers with mass ratio 0.03 (to exclude cases with too long merging time). Finally, the corresponding variation in is computed using analytic functions verified with -body simulations of minor and major dry mergers between spheroids. For observed high- ETGs, we compute the predicted and up to , which is the average redshift of massive () SDSS ETGs. The evolution in the - plane is shown in Fig. 3, taking as progenitors the observed ETGs with () and those with (). In both cases the present-day descendants tend to be more compact than real ETGs, but the deviation from the SDSS - relation is larger than the observed scatter ( at given ) only when progenitors are considered: the descendants have median vertical offset from the SDSS best-fit (-0.1) for (1.7) progenitors. In the case of progenitors, also the model descendants are more compact than real ETGs. We conclude that the ETGs are so compact that, even according to extreme pure dry-merger models, their low- descendants are predicted to be significantly more compact than present-day ETGs. On the other hand, the milder size evolution observed since is marginally consistent with CDM dry-merger models, though the model descendants are distributed in the - plane with larger scatter than the observed ETGs (see also N12). An additional problem is the presence, among the predicted descendants, of outliers, i.e. galaxies in regions of the - in which there are no SDSS ETGs: for instance, three model galaxies with and kpc, and a model galaxy with and kpc (Fig. 3). We recall here that the existence of compact low- ETGs with sizes and masses comparable to those of compact ETGs at is somehow unclear, with some results showing an absence of such galaxies (e.g. Taylor et al. 2010) and others finding a few candidates (e.g. Shih & Stockton 2011; Valentinuzzi et al. 2010). Do our results necessarily imply that dry merging alone cannot explain the observed size evolution ? In principle it could be the case that dry mergers are responsible for the whole size evolution, but the actual rate of mergers is higher than predicted. This hypothesis can be tested by further comparison with observations. A first constraint comes from the observed redshift evolution of the ETG stellar mass function. Let us take, for instance, the model describing the evolution of the ETGs. At each we select only model galaxies with and for this subsample we measure the average stellar mass . The redshift variation of is found to be well represented by the fit , i.e. the average mass increase by from to the present. This is compatible with observed evolution of the ETG stellar mass function at (e.g. Pozzetti et al. 2010). Another testable feature of the model is the predicted merger rate. Let us define major(minor) mergers those with mass ratio()1/4. The predicted number of major mergers per unit time decreases for decreasing (see Fakhouri et al. 2010): for our model ETGs we get, on average, at . These rates are higher by a factor of than estimated observationally at similar by Bundy et al. (2009; see also Lotz et al. 2011), indicating that the considered model might be extreme also in this respect. In the model, both major and minor mergers contribute significantly to the growth of stellar mass (for instance, each between and ), so, at least within CDM, massive ETGs do not accrete most of their mass in very minor mergers, which would be more effective in increasing the galaxy size. The above arguments suggest that other processes not included in the model should contribute significantly to the size evolution. Unfortunately, at the moment the proposals for additional mechanisms are not very promising: Fan et al. (2008) envisaged that feedback from QSOs could play a role, but also this scenario is not without problems (Ragone-Figueroa & Granato 2011).
6 Conclusions
The analysis of a large sample of ETGs at shows that their size evolves independently of stellar mass and possibily faster at (especially for ETGs with the largest masses). The interpretation of this result is not straightforward as the available information does not allow us to assess if this is an observational bias (e.g. large ETGs with low surface brightness are missed in high- samples), or it is an intrinsic change in the evolutionary pattern implying a very rapid growth of ETGs from to lower redshifts. We explored the possibility of pure dry merging as the dominant growth mechanism within the CDM framework, and found that this scenario is marginally consistent with the average size evolution at , but predicts descendants too compact for progenitor ETGs. Further studies and larger samples of ETGs at , which will be obtained with future wide-field surveys (e.g. Euclid, Laureijs et al. 2011), will shed light on these open questions.
7 Acknowledgements
We thank M. Bernardi, M. Moresco and V. Strazzullo for providing their data, J. Pforr and C. Maraston for providing their scaling relations, E. Daddi and A. Renzini for useful discussion, the COSMOS/zCOSMOS teams for making the data available to the community, and the anonymous referee for the constructive comments. AC is supported by grants ASI-Uni. Bologna-Astronomy Dept. I/039/10/0 and PRIN MIUR 2008. CN is supported by grant PRIN MIUR 2008. Paolo Cassata aknowledges support from ERC grant ERC-2010-AdG-26107-EARLY.
References
- [] Behroozi P. S., Conroy C., Wechsler R. H., 2010, ApJ, 717, 379
- [] Bournaud F., Jog C.J. & Combes F. 2007, A&A, 476, 1179
- [] Boylan-Kolchin M., Springel V., White S. D. M., Jenkins A., Lemson G., 2009, MNRAS, 398, 1150
- [] Brammer G.B. et al. 2011, ApJ, 739, 24
- [] Buitrago F., Trujillo I., Conselice C., Bouwens R.J., Dickinson M., Yan H. 2008, ApJ, 687, L61
- [] Bundy K., Fukugita M., Ellis R. S., Targett T. A., Belli S., Kodama T., 2009, ApJ, 697, 1369
- [] Cappellari M. et al. 2009, ApJ, 704, L34
- [] Carrasco E.R, Conselice C.J., Trujillo I. 2010, MNRAS, 405, 2253
- [] Cassata P. et al. 2008, A&A, 483, L39
- [] Cassata P. et al. 2011, ApJ, 743, 96
- [] Cenarro A.J., Trujillo I. 2009, ApJ, 696, L43
- [] Cimatti A. et al. 2004, Nature, 430, 184
- [] Cimatti, A. et al. 2008, A&A, 482, 21
- [] Cooper M.C. et al. 2011, ApJ, in press (arXiv:1109.5698)
- [] Daddi, E. et al. 2005, ApJ, 626, 680
- [] Damjanov I. et al. 2011, ApJ, 739, L44
- [] di Serego Alighieri S. et al. 2005, A&A, 442, 125
- [] Domi’nguez Sa’nchez, H. et al. 2011, MNRAS, 417, 900
- [] Fakhouri O., Ma C.-P., Boylan-Kolchin M., 2010, MNRAS, 406, 2267
- [] Fan L., Lapi A., De Zotti G., Danese, L. 2008, ApJ, 689, L101
- [] Fontana, A. et al. 2009, A&A, 501, 15
- [] Hyde J.B., Bernardi M. 2009, MNRAS, 394, 1978
- [] Hopkins P.F., Bundy K., Murray N., Quataert E., Lauer T.R., Ma C.-P. 2009, MNRAS, 398, 898
- [] Khochfar S. & Silk J. 2006, MNRAS, 370, 902
- [] Kriek, M. et al. 2006, ApJ, L71
- [] Laureijs R. et al. 2011, Euclid Definition Study Report (arXiv:1110.3193)
- [] Lotz J. M., Jonsson P., Cox T. J., Croton D., Primack J. R., Somerville R. S., Stewart K., 2011, ApJ, in press (arXiv:1108.2508)
- [] Mancini, C.; Daddi, E.; Renzini, A. et al. 2010, MNRAS, 401, 933
- [] Maraston C. 2005, MNRAS, 362, 799
- [] Moresco M. et al. 2010, A&A, 524, 67
- [] Naab T., Johansson P.H., Ostriker J.P. 2009, ApJ, 699, L178
- [] Newman A.B., Ellis R.S.; Bundy K., Treu T. 2011, ApJ, in press (arXiv:1110.1637)
- [] Nipoti C., Londrillo P., Ciotti L., 2003, MNRAS, 342, 501
- [] Nipoti C., Treu T., Bolton A. S., 2009a, ApJ, 703, 1531
- [] Nipoti C., Treu T., Auger M.W., Bolton A.S. 2009b, ApJ, 706, L86
- [] Nipoti C., Treu T., Leauthaud A., Bundy K., Newman A. B., Auger M. W., 2012, MNRAS in press (arXiv:1202.0971)
- [] Onodera M. et al. 2010, ApJ, 715, L60
- [] Oser L., Naab T., Ostriker J.P., Johansson P.H. 2011, ApJ, in press (arXiv:1106.5490)
- [] Papovich C. et al. 2011, ApJ, in press (arXiv:1110.3794)
- [] Pforr J., Maraston C., Tonini C. 2012, MNRAS, submitted
- [] Pozzetti, L. et al. 2010, A&A, 523, 13
- [] Ragone-Figueroa C., Granato G. L., 2011, MNRAS, 414, 3690
- [] Renzini A., 2006, ARA&A, 44, 141
- [] Rettura A. et al. 2010, ApJ, 709, 512
- [] Scarlata C. et al. 2007, ApJS, 172, 406
- [] Saglia R.P. et al. 2010, A&A, 524, 6
- [] Saracco P., Longhetti, M., Andreon, S. 2009, MNRAS, 392, 718
- [] Shen S. et al. 2003, MNRAS, 343, 978
- [] Shih H.-Y., Stockton A. 2011, ApJ, 733, 45
- [] Springel V., et al., 2005, Nature, 435, 629
- [] Strazzullo V. et al. 2010, A&A, 524, 17
- [] Taylor E.N., Franx M., Glazebrook K., Brinchmann J., van der Wel A., van Dokkum P.G. 2010, ApJ, 720, 723
- [] Trujillo I. et al. 2006, MNRAS, 373, L36 2006, MNRAS, 373, L36
- [] Valentinuzzi T. et al. 2010, ApJ, 721, L19
- [] van de Sande J. et al. 2011, ApJ, 736, L9
- [] van der Wel A. et al. 2008, ApJ, 688, 48
- [] van der Wel A. et al. 2011, ApJ, 730, 38
- [] van Dokkum P.G. et al. 2008, ApJ, 677, L5
- [] van Dokkum P.G., Kriek M., Franx, M. 2009, Nature, 460, 717
- [] van Dokkum P.G., Brammer G. 2010, ApJ, 718, L73
- [] Williams R.J., Quadri R.F., Franx M., van Dokkum P., Toft S., Kriek M., Labbe´ I. 2010, 713, 738