Information flow in a network model and the law of diminishing marginal returns
Abstract
We analyze a simple dynamical network model which describes the limited capacity of nodes to process the input information. For a suitable choice of the parameters, the information flow pattern is characterized by exponential distribution of the incoming information and a fat-tailed distribution of the outgoing information, as a signature of the law of diminishing marginal returns. Similar behavior is observed in another network model, describing in a different fashion the law of diminishing marginal returns. The analysis of a real EEG data-set shows that similar phenomena may be relevant for brain signals.
pacs:
05.10.-a, 05.45.Tp , 87.18.SnMost social, biological, and technological systems can be modeled as complex networks, and display substantial non-trivial topological features link ; bocca . Moreover, time series of simultaneously recorded variables are available in many fields of science; the inference of the underlying network structure, from these time series, is an important problem that received great attention in the last years. A method based on chaotic synchronization has been proposed in yu1 , a method based on model identification has been described in sauer . Use of a phase slope index to detect directionalities of interactions has been proposed in nolte .
The inference of dynamical networks is also related to the estimation, from data, of the flow of information between variables, as measured by the transfer entropy schreiber ; leh . Wiener wiener and Granger granger formalized the notion that, if the prediction of one time series could be improved by incorporating the knowledge of past values of a second one, then the latter is said to have a causal influence on the former. Initially developed for econometric applications, Granger causality has gained popularity also among physicists (see, e.g., geweke ; chen ; blinoska ; smirnov ; dingprl ; noiprl ) and eventually became one of the methods of choice to study brain connectivity in neuroscience bressler . Multivariate Granger causality may be used to infer the structure of dynamical networks from data as described in noipre . It has been recently shown that for Gaussian variables Granger causality and transfer entropy are equivalent seth , and this framework has also been generalized to other probability densities hlava2011 . Hence a weighted network obtained by Granger causality analysis can be given an interpretation in terms of flow of information between different components of a system. This way to look at information flow is particularly relevant for neuroscience, where it is crucial to shed light on the communication among neuronal populations, which is the mechanism underlying the information processing in the brain friston . Furthermore, recent studies have investigated the economics implications of several network types mapping brain function bull1 ; bull2 .
In many situations it can be expected that each node of the network may handle a limited amount of information. This structural constraint suggests that information flow networks should exhibit some topological evidences of the law of diminishing marginal returns samuelson , a fundamental principle of economics which states that when the amount of a variable resource is increased, while other resources are kept fixed, the resulting change in the output will eventually diminish lopez ; lopez2 . The purpose of this work is to introduce a simple dynamical network model where the topology of connections, assumed to be undirected, gives rise to a peculiar pattern of the information flow between nodes: a fat tailed distribution of the outgoing information flows while the average incoming information flow does not depend on the connectivity of the node. In the proposed model the units, at the nodes the network, are characterized by a transfer function that allows them to process just a limited amount of the incoming information. We show that a similar behavior is observed also in another network model, which describes in a different fashion the law of diminishing marginal returns; we then show that this relevant topological feature is found as well in real neural data.
Our model is as follows. Given an undirected network of nodes and symmetric connectivity matrix , to each node we associate a real variable whose evolution, at discrete times, is given by:
| (1) |
where are unit variance Gaussian noise terms, whose strength is controlled by ; is a transfer function chosen as follows:
| (5) |
where is a threshold value. This transfer function is chosen to mimic the fact that each unit is capable to handle a limited amount of information. For large our model becomes a linear map. At intermediate values of , the nonlinearity connected to the threshold will affect mainly the mostly connected nodes (hubs): the input to nodes with low connectivity will remain typically sub-threshold in this case. We consider hierarchical networks generated by preferential attachment mechanism PRE . From numerical simulations of eqs. (1), we evaluate the linear causality pattern for this system as the threshold is varied. We verify that, in spite of the threshold, variables are nearly Gaussian so that we may identify the causality with the information flow between variables seth . We compute the incoming and outgoing information flow from and to each node, and , summing respectively all the sources for a given target and all the targets for a given source. Then we evaluate the standard deviation of the distributions of and , varying the realization of the preferential attachment network and running eqs. (1) for 10000 time points.
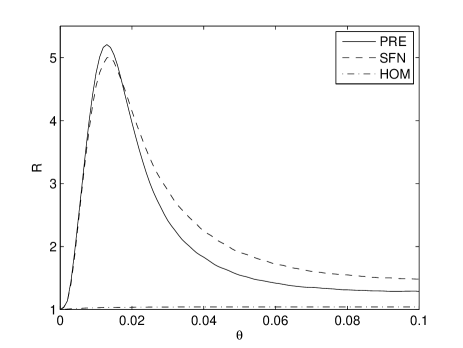
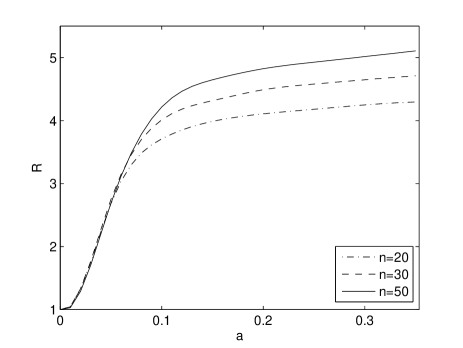
In figure (1) we depict , the ratio between the standard deviation of over those of , as a function of the . As the threshold is varied, we encounter a range of for which the distribution of is much narrower than that of . In the same figure we also depict the corresponding curve for deterministic scale free networks SFN , which exhibits a similar peak, and for homogeneous random graphs (or Erdos-Renyi networks erdos ), with always very close to one. The discrepancy between the distributions of the incoming and outgoing causalities arises thus in hierarchical networks. We remark that, in order to quantify the difference between the distributions of and , here we use the ratio of standard deviations but qualitatively similar results would have been shown using other measures of discrepancy.
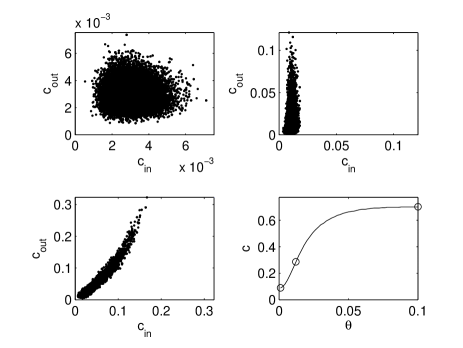
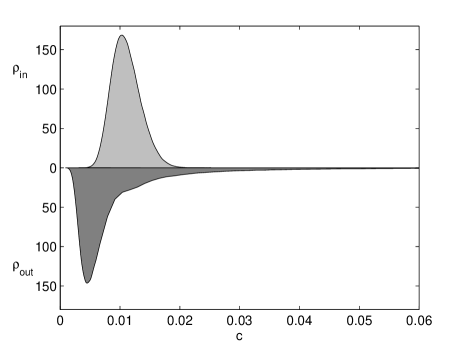
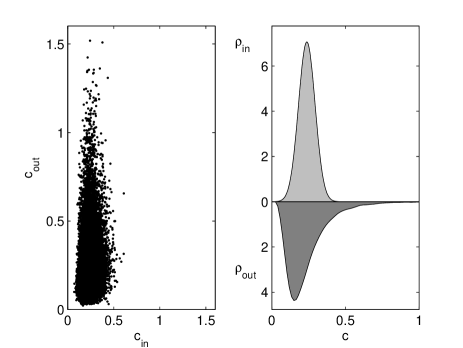
In (2) we report the scatter plot in the plane for preferential attachment networks and for some values of the threshold. The distributions of and , with equal to 0.012 and corresponding to the peak of fig. (1), are depicted in fig. (3): appears to be exponentially distributed around a typical value, whilst shows a fat tail. In other words, the power law connectivity, of the underlying network, influences just the distribution of outgoing causalities.
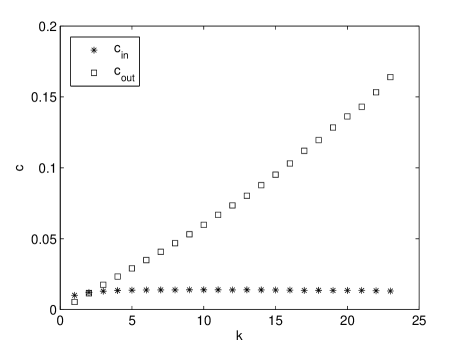
In fig. (4) we show the average value of and versus the connectivity of the network node: grows uniformly with , thus confirming that its fat tail is a consequence of the power law of the connectivity. On the contrary appears to be almost constant: on average the nodes receive the same amount of information, irrespectively of , whilst the outgoing information from each node depends on the number of neighbors.
It is worth mentioning that since a precise estimation of the information flow is computationally expensive, our simulations are restricted to rather small networks; in particular the distribution of appears to have a fat tail but, due to our limited data, we can not claim that it corresponds to a simple power-law.
A fat tail in the distribution of is observed also in the following model: to each node of an undirected network we associate the variable whose evolution is
| (6) |
where is a node chosen randomly, at each time , in the set of the neighboring nodes of . Equations (6) implement, in a different way from (1), the occurrence that nodes may handle a limited incoming information: at each time each node is influenced just by one other node. In figure (5) we depict as a function of , for preferential attachment networks and for different size of the networks: the discrepancy between the distributions of and increases as the size of the network grows while keeping fixed.
Now we turn to consider real electroencephalogram (EEG) data. We used recording obtained at rest from 10 healthy subjects. During the experiment, which lasted for 15 min, the subjects were instructed to relax and keep their eyes closed. To avoid drowsiness, every minute the subjects were asked to open their eyes for 5 s. EEG was measured with a standard 10-20 system consisting of 19 channels nolte . Data were analyzed using the linked mastoids reference, and are available from website_nolte .
For each subject we considered several epochs of 4 seconds in which the subjects kept their eyes closed. For each epoch we computed multivariate Kernel Granger Causality noiprl using a linear kernel and a model order of , determined by leave-one-out cross-validation. We then pooled all the values for information flow towards and from any electrode and analyzed their distribution.
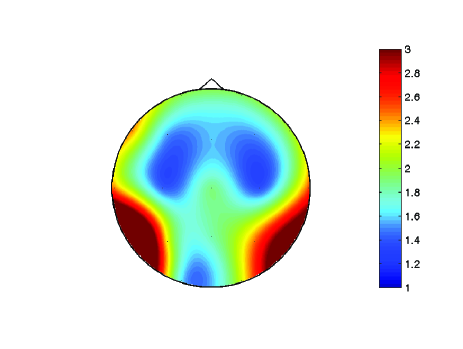
In figure (6) we plot the incoming versus the outgoing values of the information flow, as well as the distributions of the two quantities: the incoming information seems exponentially distributed whilst the outgoing information shows a fat tail. These results suggest that overall brain effective connectivity networks may also be considered in the light of the law of diminishing marginal returns. More interestingly, this pattern is reproduced locally but with a clear modulation: a topographic analysis has also been made considering the distribution of incoming and outgoing causalities at each electrode. In figure (7) we depict the map of parameter , thus obtained, on the scalp; the law of diminishing marginal returns seems to affect mostly the temporal regions. This well defined pattern suggests a functional role for the distributions.
It is worthwhile to mention that there are other measures of directed brain connectivity, such as Directed Transfer Function, Partial Directed Coherence and Phase Slope Index, which are not directly related to information transfer. In particular, for DTF and PDC, defined in terms of physiological bands, the interpretation in terms of information flow is still debated takanashi . On the other hand we verified that a significant discrepancy between the distributions of incoming and outgoing connectivities holds also for these methods. Furthermore, bivariate measures do not display this asymmetry of the distributions of and : this is not surprising, indeed it is well known that bivariate causality also account for indirect interactions, see e.g. noipre . Here we limited ourselves to linear information flow; the amount of nonlinear information transmission and its functional roles are not clear noineuroimage . It will be interesting to investigate these phenomena also in the nonlinear case.
Summarizing, we have pointed out that the pattern of information flows among variables of a complex system is the result of the interplay between the topology of the underlying network and the capacity of nodes to handle the incoming information. By means of two simple toy models, we have shown that they may exhibit the law of diminishing marginal returns for a suitable choice of parameters. The analysis of a real EEG data-set has shown that similar patterns exist for brain signals and could have a specific functional role.
References
- (1) A.L. Barabasi, Linked: the new science of networks. (Perseus Publishing, Cambridge Mass., 2002)
- (2) S. Boccaletti, V. Latora, Y. Moreno, M. Chavez and D.-U. Hwang, Phys. Rep. 424, 175 (2006)
- (3) D. Yu, M. Righero, L. Kocarev, Phys.Rev.Lett. 97, 188701 (2006).
- (4) D. Napoletani, T. D. Sauer, Phys. Rev. E 77, 026103 (2008)
- (5) G. Nolte, A. Ziehe, V.V. Nikulin, A. Schlögl, N. Krämer, T. Brismar, K.R. Müller, Phys. Rev. Lett. 100, 234101, 2008
- (6) T. Schreiber, Phys. Rev. Lett. 85, 461 (2000)
- (7) M. Staniek, K. Lehnertz, Phys. Rev. Lett. 100, 158101 (2008)
- (8) N. Wiener, The theory of prediction. In E.F. Beckenbach, Ed.,Modern mathematics for Engineers. (McGraw-Hill, New York, 1956)
- (9) C.W.J. Granger, Econometrica 37, 424 (1969)
- (10) J. Geweke, J. Am. Stat. Assoc. 79, 907 (1984)
- (11) Y. Chen, G. Rangarajan, J. Feng and M. Ding, Phys. Lett. A 324, 26 (2004)
- (12) K.J. Blinowska, R. Kus, M. Kaminski, Phys. Rev. E 70, 050902(R) (2004)
- (13) K. Hlavackova-Schindler, Applied Mathematical Sciences 5, 3637 (2011)
- (14) D.A. Smirnov, B.P. Bezruchko, Phys Rev. E 79, 046204 (2009)
- (15) M. Dhamala, G. Rangarajan, M. Ding, Phys. Rev. Lett. 100, 018701 (2008)
- (16) D. Marinazzo, M. Pellicoro, S. Stramaglia, Phys. Rev. Lett. 100, 144103 (2008)
- (17) S.L. Bressler, A.K. Seth, Neuroimage 58 323 (2011)
- (18) D. Marinazzo, M. Pellicoro and S. Stramaglia, Phys. Rev. E 77, 056215 (2008)
- (19) L. Barnett, A.B. Barrett, and A.K. Seth, Phys Rev. Lett. 103, 238701 (2009)
- (20) K.J. Friston, Brain connectivity 1, 13 (2011).
- (21) P. E. Vertes, A. F. Alexander-Bloch, N. Gogtay, J. N. Giedd, J. L. Rapoport, and E. Bullmore PNAS 109, 5868 (2012).
- (22) E. Bullmore, O. Sporns, Nature Reviews Neuroscience , in press, doi:10.1038/nrn3214
- (23) P. Samuelson, W. Nordhaus, Microeconomics, Mc Graw Hill, Edition 17 (2001)
- (24) L. Lopez, M.A.F. Sanjuan, Phys. Rev. E 65 036107 (2002)
- (25) J. A. Almendral,, L. Lopez, M. A. F. Sanjuan, Physica A 324, 424 (2003)
- (26) Barabasi, A.-L.; R. Albert, Science 286 509 512 (1999)
- (27) A.-L. Barabasi, E. Ravasz and T. Vicsek, Physica A 299, 559-564 (2001)
- (28) P. Erdös and A. Rényi, Publ. Math. Inst. Hung. Acad. Sci. 5, 17 (1960)
- (29) http://clopinet.com/causality/data/nolte/, accessed february 2012
- (30) D.Y. Takahashi, L.A. Baccala, K. Sameshima, Biological Cybernetics, v. 103, p. 463-469, 2010.
- (31) D. Marinazzo, W. Liao, H. Chen, S. Stramaglia, Neuroimage 58, 330 (2011)