Anisotropic determined up to 92 T and the signature of multi-band superconductivity in Ca10(Pt4As8)((Fe1-xPtx)2As2)5 superconductor
Abstract
The upper critical fields, (), of single crystals of the superconductor Ca10(Pt4-δAs8)((Fe0.97Pt0.03)2As2)5 ( 0.246) are determined over a wide range of temperatures down to = 1.42 K and magnetic fields of up to 92 T. The measurements of anisotropic () curves are performed in pulsed magnetic fields using radio-frequency contactless penetration depth measurements for magnetic field applied both parallel and perpendicular to the ab-plane. Whereas a clear upward curvature in () along Hc is observed with decreasing temperature, the () along Hab shows a flattening at low temperatures. The rapid increase of the () at low temperatures suggests that the superconductivity can be described by two dominating bands. The anisotropy parameter, /, is 7 close to and decreases considerably to 1 with decreasing temperature, showing rather weak anisotropy at low temperatures.
pacs:
74.70.Xa, 74.25.Op, 74.25.DwAfter the discovery of superconductivity in the LaFeAsO1-xFx system, enormous research efforts have been devoted to searching for new Fe-based superconductors with higher transition temperatures, , and they have been discovered and categorized into several types Kamihara2008 ; Hsu2008 ; Rotter2008 ; Pitcher2008 ; Parker2008 ; Guo2010 . All of these materials have layers with edge-sharing tetrahedra, where Fe atoms are surrounded by four As or Se atoms. Recently Ca10(PtnAs8)(Fe2As2)5 systems have shown that the can be as high as 38 K by substituting Pt for Fe in the Fe2As2 layer Ni2011 ; Lohnert ; Kakiya . These new structures have stacks of Ca-(PtnAs8)-Ca-(Fe2As2), forming a triclinic , 10-3-8 phase with = 3 and tetragonal , 10-4-8 phase with = 4 Ni2011 .
Upper critical field, , measurements of many Fe-based superconductors have revealed similar temperature dependences of the anisotropy ratio, /, decreasing with decreasing temperature, with close to the Hunte2008 ; Jaroszynski2008 ; Lee2008 ; Altarawneh2008 ; Ni2008 ; Kano2009 ; Khim2010 ; Mun2011 . As evidenced by both experiments and band-structure calculations, the Fe-based superconductors are a multi-band system Hunte2008 ; Jaroszynski2008 ; Kano2009 ; Lee2008 ; Eschrig2009 ; Weyeneth2009 ; Paglione2010 . Multi-band superconductivity can be manifested in the temperature dependence of the anisotropic parameters. For example, of MgB2 decreases with increasing temperature Gurevich2003 , whereas for many Fe-based materials increases on warming Hunte2008 ; Kano2009 . For one-band isotropic materials the anisotropic parameters generally have no temperature dependence.
In light of the multi-band superconductivity and the very high of Fe-based superconductors, rapidly exceeding the limit of the commonly available magnetic fields, finding the true behavior of the and down to very low temperatures and high magnetic fields are of great interest. In this communication we present curves determined from radiofrequency (rf) contactless penetration depth measurements in pulsed magnetic fields up to 92 T, for single crystals of the 10-4-8 phase materials. The high magnetic fields up to 92 T and temperatures down to 1.42 K, used in this study, enable access to the complete evolution of the curves. We find that as the temperature decreases, the curve flattens, whereas increases steeply, which is shown to be consistent with the multi-band effects.
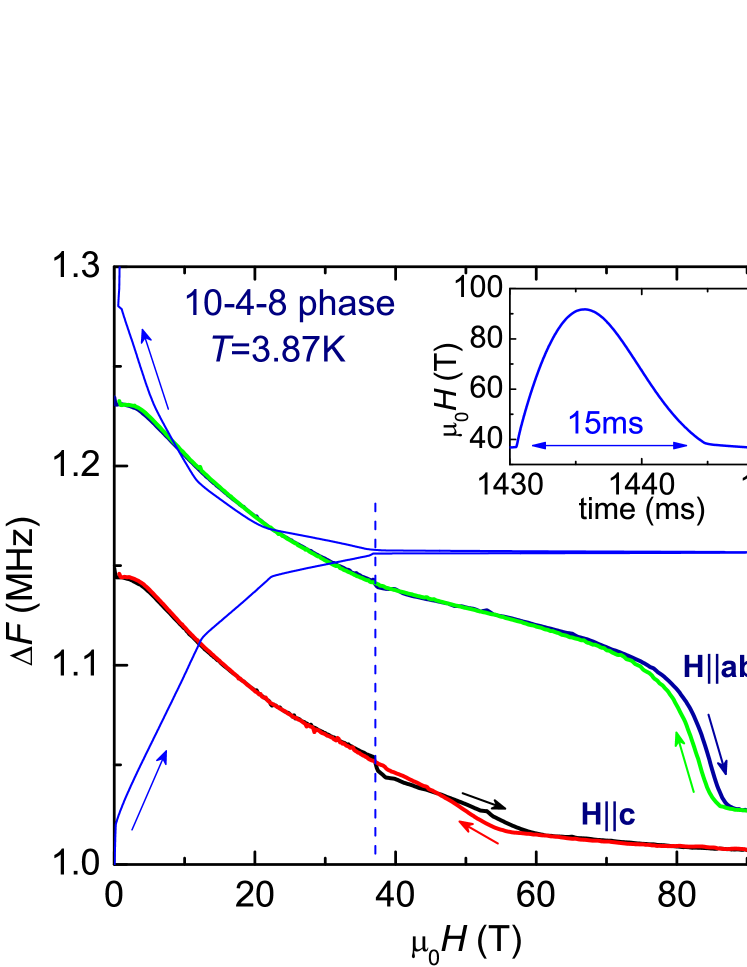
The Ca10(Pt4-δAs8)((Fe0.97Pt0.03)2As2)5 ( 0.246) samples with = 26.5 K, were prepared by heating precursor materials above 1100 C. The shape of the as-grown crystal is plate-like in the ab-plane with shiny surfaces. Details of sample growth and characterization are given in Ref. Ni2011 . To study the anisotropy of up to = 92 T, the magnetic field dependence of rf contactless penetration depth, known as proximity detection oscillator (PDO) Altarawneh2009 , was measured for magnetic field applied both parallel (Hab) and perpendicular (Hc) to the ab-plane of the tetragonal structure in two different pulsed magnet systems. The rf technique has been shown to be a sensitive and accurate method for determining the of superconductors, especially in pulsed magnetic fields Mielke2001 . Details about this technique can be found in Refs. Coffey2000 ; Mielke2001 ; Altarawneh2008 ; Altarawneh2009 ; Mun2011 . For magnetic fields up to 60 T, a short-pulse magnet was used with a 10 ms rising and 40 ms falling time. Measurements were extended to 92 T in the 95 T multi-shot magnet system at the National High Magnetic Field Laboratory Pulsed Field Facility: Here the magnetic fields up to 36 T are provided by a motor-generator-driven outsert magnet with a slower sweep rate and longer pulse length (2.5 s) and the remaining magnetic field from 36 T up to 92 T is provided (within 15 ms) by a capacitor-bank-driven insert magnet. The magnetic field versus time profile of the insert magnet is shown in the inset to Fig. 1. Examples of resonance frequency shift () measured using the rf technique are shown in Fig. 1, where changes in the resistivity and magnetic susceptibility drive a shift in the resonance frequency of an oscillator circuit. At 36 T, shows a feature due to the rapid shift in the rate of change of magnetic field, as indicated by the vertical line in Fig. 1. The magnetic field was determined using a pick-up coil and calibrated by measuring quantum oscillations in copper. To minimize the eddy current heating and dissipative vortex motion due to the fast sweep rate of pulsed magnetic fields, small single crystals were chosen, typically 0.20.20.05 mm3. Note that in order to reduce open-loop area of samples for Hc, a smaller size sample ( 0.120.120.05 mm3) was used for measurements up to 92 T in the multi-shot magnet. No significant difference between 60 T and 92 T measurements was detected.
In zero field the superconducting transition temperature, determined from the d()/d analysis, gives = 26.5 K for three samples, used in the both short pulse 60 T and multi-shot 95 T magnet (inset in Fig. 2 (a)); as the temperature decreases, sharply increases at . The evolution of superconductivity with magnetic field is shown in Fig. 2 (a) for Hab and Fig. 2 (b) for Hc. At this point it should be noted that the phase transitions determined by the rf technique are consistent with off-set criteria of resistance measurements shown in Ref. Mun2011 . In comparison with the samples reported in Ref. Ni2011 , samples studied in this work show a slightly higher , related to the different Pt doping concentration in the Fe2As2 layer.
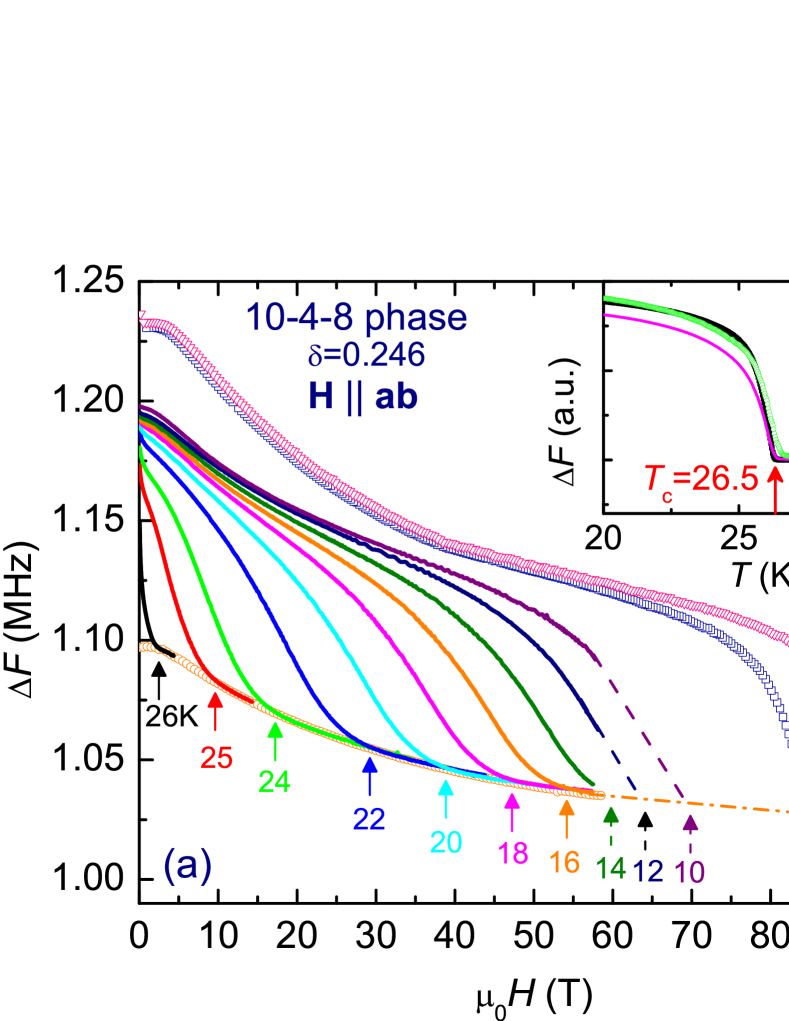
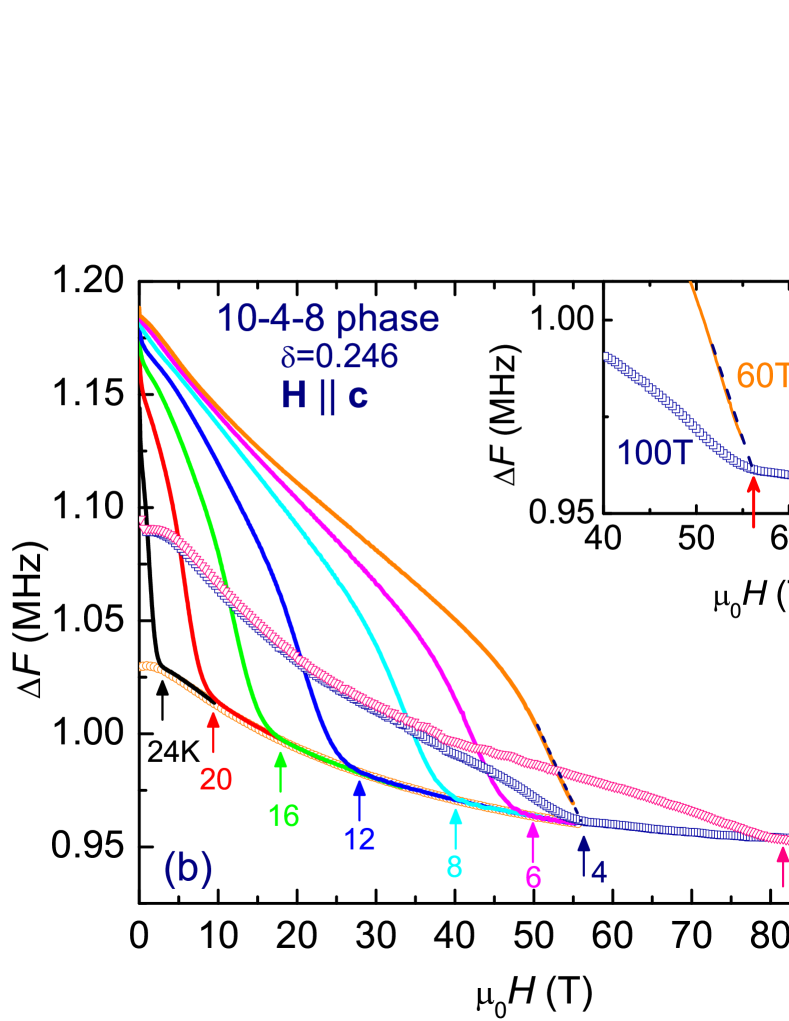
Using the deviation from the normal state criterion, discussed in Ref. Mun2011 , the curve is inferred from the vs plots shown in Figs. 2 (a) and (b); the determined is indicated by arrows. Note that the error bar is estimated by the difference between the values determined by the point deviating from the background and by taking the slope of the rf signal intercepting the slope of the normal state background Mun2011 . In addition, the hysteresis detected in 92 T multi-shot measurements (see Fig. 1) is considered to determine the error bar. The obtained curves for both Hab and Hc are plotted in Fig. 3, as determined from the 60 T in a short pulse (squares) and from the 92 T in a multi-shot (circles) taken from the down sweep of the magnetic field. The star symbols in Fig. 3 are extracted by linear extrapolation of curves at 60 T and 92 T, as shown by dashed lines in Figs. 2 (a) and (b). As a representative curve, taken at 4 K in a 60 T short pulse magnet is presented in the inset of Fig. 2 (b), where the critical field determined by extrapolating curve is consistent with the one determined by down sweep of the 92 T magnetic field. The shapes of the curves for Hab and Hc in Fig. 3 clearly show the different temperature dependence. A conventional linear field dependence of is observed close to the , with clearly different slopes for the two field orientations. In the low field region, the curves are consistent with earlier resistance study Ni2011 . Toward higher fields, presents a tendency to saturate, whereas the curve for shows a steep increase.
The anisotropy coefficient is plotted in the inset of Fig. 3. One can see that the value of is 7 near and then decreases considerably to 1 with decreasing temperature. This temperature dependence of is similar to other Fe-based superconductors. Close to the of the 10-4-8 phase is bigger than that of the 122-type Altarawneh2008 ; Ni2008 ; Kano2009 and is comparable to the 1111-type Hunte2008 ; Jaroszynski2008 . Based on the results measured here and in other studies, this temperature dependence of and a weak anisotropy at seem to be a general feature of the Fe-based superconductors. The strong temperature dependence of can be a signature of multi-band superconductivity. Based on the recent literature Kogan2011 , however, the can even have a weak temperature dependence for a single band -wave order parameter. Thus, our results need to be carefully analyzed.
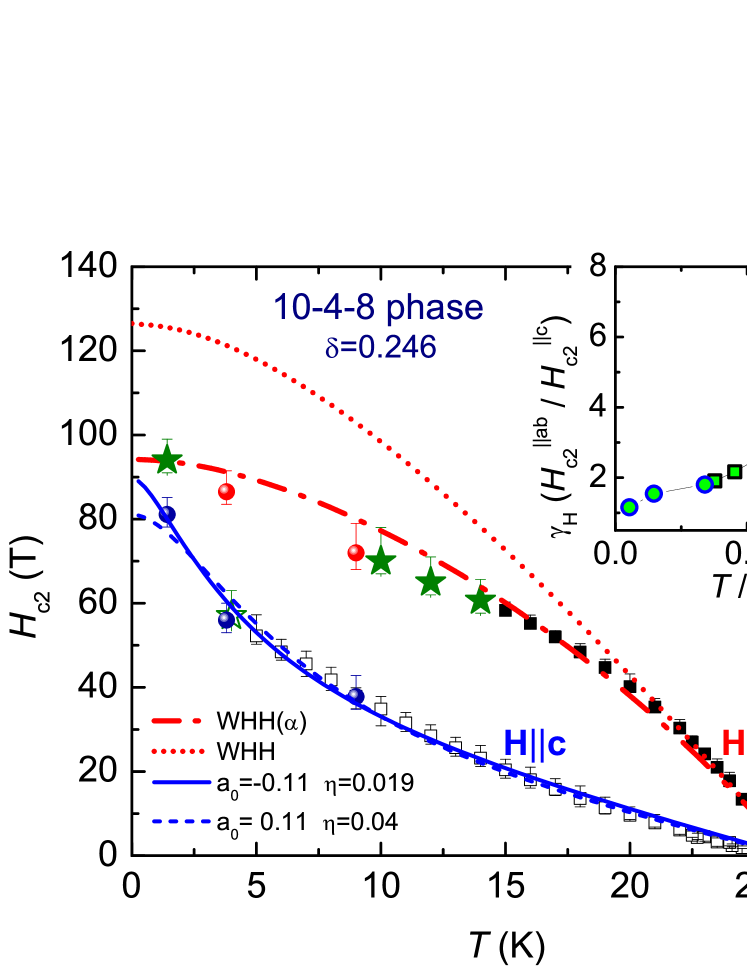
The zero temperature limit of can be predicted by using the Werthamer-Helfand-Hohenberg (WHH) theory WHH1966 , which gives = 0.69(d/d). The values of (0) for Hab and Hc are estimated to be 132 T and 24 T, respectively. For 0.6 , the already exceeds the Pauli limit ( = 1.84 ) Clogston1962 , giving 48.7 T. Clearly, these values do not capture the salient physics of this compound.
A number of experimental and theoretical papers have discussed the Fe-based superconductors as a two-band system Hunte2008 ; Jaroszynski2008 ; Kano2009 ; Lee2008 ; Eschrig2009 ; Weyeneth2009 ; Paglione2010 . Certainly, multi-band superconductivity can be manifested in the curve, as shown in MgB2 Gurevich2003 . The clear upward curvature in in 10-4-8 phase cannot be explained by the one-gap WHH theory and, therefore, suggests the multi-band nature of superconductivity. In the dirty limit, the two-band model for Gurevich2003 , which takes into account both orbital and Zeeman pair breaking for negligible interband scattering, is thus used to fit the data so that a qualitative understanding can be reached. Assuming negligible interband scattering, the equation of can be written as , where , , , , , , , and . is the di-gamma function, and are the intraband BCS coupling constants, while and are the interband BCS coupling constants, and are the in-plane diffusivity of each band.
As can be inferred from the equation, if 0, the intraband coupling dominates while if 0, the interband coupling dominates. We assume = , such that = = 1, so that the shape of the curve is only determined by fitting parameters and . The best fit curve with = -0.11 and = 0.019 is shown as a solid blue line in Fig. 3, and can be seen to agree very well with the experimental data. Although 0 for the best fit, it cannot be concluded that the interband coupling dominates. The dashed blue curve, obtained by a fixed = 0.11 (intraband coupling dominates), also fits the data if the error bars are considered. The small implies stronger scattering in one of the bands. Although the exact determination of the band coupling is not possible from our data analysis, the curvature for can be explained well by the two-band model.
For , the orbital limit is comparable to the Pauli limit and the two-band model works well. For , however, the two-band model fit does not result in physically meaningful parameters since the orbital limit is much larger than the Pauli limit. When including Pauli paramagnetism, the curve can be fit with = , where the Maki parameter = Maki1966 . A rather good agreement between the data and fitting is observed as shown by the dash-dotted red line in Fig. 3.
An interesting behavior in the curves for 10-4-8 phase is that the Hab and Hc curves as seen to merge at low temperatures ( 1). For optimally Co-doped BaFe2As2 Kano2009 , the curves for the two field orientations also appear to meet at = 0 K. The Te-doped FeSe system Khim2010 show crossing curves between Hab and Hc, because of the subsequent flattening of the curve at low temperatures. However, the curves in Co-doped BaFe2As2 Ni2008 , K0.8Fe1.76Se2 Mun2011 , LiFeAs Cho2011 , and oxypnictide systems Hunte2008 ; Jaroszynski2008 ; Lee2008 do not show such a crossing behavior.
In summary, we have determined the upper critical fields of the Ca10(Pt4-δAs8)((Fe0.97Pt0.03)2As2)5 ( 0.246) superconductor by measuring the rf contactless penetration depth up to 92 T in pulsed magnetic fields, which enable access to the complete evolution of curves. It was found that this supercondcutor shows very high values (90 T for Hc and 94 T for Hab) and relatively weak anisotropy of superconductivity at low temperatures. For Hab, can be described by taking into account Pauli paramagnetism, whereas for Hc, exhibits a steep increase at low temperatures, quite possibly due to the multi-band effect.
Acknowledgements.
The authors thank M. Gordon, D. Roybal, Y. Coulter, J. Betts, M. Pacheco and C. Swenson for 100 T technical support; E. Mun thanks H. Park for useful discussions. Work at the National High Magnetic Field Laboratory was supported by the US National Science Foundation through Cooperative Grant No. DMR901624, the State of Florida, and the US Department of Energy, and US office of Science project ”Science at 100 T”. This work was supported by the AFOSR MURI on superconductivity.References
- (1) Y. Kamihara, T. Watanabe, M. Hirano, and H. Hosono, J. Am. Chem. Soc. 130, 3296 (2008).
- (2) F. C. Hsu, J. Y. Luo, K. W. Yeh, T. K. Chen, T. W. Huang, P. M. Wu, Y. C. Lee, Y. L. Huang, Y. Y. Chu, D. C. Yan, and M. K. Wu, Proc. Natl. Acad. Sci. U.S.A. 105, 14262 (2008).
- (3) M. Rotter, M. Tegel, and D. Johrendt, Phys. Rev. Lett. 101, 107006 (2008).
- (4) M. J. Pitcher, D. R. Parker, P. Adamson, S. J. C. Herkelrath, A. T. Boothroyd, and S. J. Clarke, Chem. Commun. (Cambridge) (45), 5918 (2008).
- (5) D. R. Parker, M. J. Pitcher, P. J. Baker, I. Franke, T. Lancaster, S. J. Blundell, and S. J. Clarke, Chemical commun. (Cambridge) (16), 2189 (2009).
- (6) J. Guo, S. Jin, G. Wang, S. Wang, K. Zhu, T. Zhou, M. He, and X. Chen, Phys. Rev. B 82, 180520 (2010).
- (7) N. Ni, J. M. Allred, B. C. Chan, and R. J. Cava, PNAS 108, E1019 (2011).
- (8) S. Kakiya, K. Kudo, Y. Nishikubo, K. Oku, E. Nishibori, H. Sawa, T. Yamamoto, T. Nozaka, and M. Nohara, J. Phys. Soc. Jpn. 80, 093704 (2011).
- (9) C. Löhnert, T. Stürzer, M. Tegel, R. Frankovsky, G. Friederichs, and D. Johrendt, Angew. Chem. Int. Ed. 50, 9195 (2011).
- (10) F. Hunte, J. Jaroszynski, A. Gurevich, D. C. Larbalestier, R. Jin, A. S. Sefat, M. A. McGuire, B. C. Sales, D. K. Christen, and D. Mandrus, Nature (London) 453, 903 (2008).
- (11) J. Jaroszynski, F. Hunte, L. Balicas, Y.-J. Jo, I. Raičevič, A. Gurevich, D. C. Larbalestier, F. F. Balakirev, L. Fang, P. Cheng, Y. Jia, and H.-H. Wen, Phys. Rev. B 78, 174523 (2008).
- (12) H. Lee, M. Bartkowiak, J. Park, J. Lee, J. Kim, N. Sung, B. Cho, C. Jung, J. Kim, and H. Lee, Phys. Rev. B 80, 144512 (2009).
- (13) M. Kano, Y. Kohama, D. Graf, F. Balakirev, A. S. Sefat, M. A. McGuire, B. C. Sales, D. Mandrus, and S. W. Tozer, J. Phys. Soc. Jpn. 78, 084719 (2009).
- (14) M. M. Altarawneh, K. Collar, C. H. Mielke, N. Ni, S. L. Bud’ko, and P. C. Canfield, Phys. Rev. B 78, 220505 (R) (2008).
- (15) N. Ni, M. E. Tillman, J.-Q. Yan, A. Kracher, S. T. Hannahs, S. L. Bud’ko, and P. C. Canfield, Phys. Rev. B 78 214515 (2008).
- (16) S. Khim, J. W. Kim, E. S. Choi, Y. Bang, M. Nohara, H. Takagi, and K. H. Kim, Phys. Rev. B 81, 184511 (2010).
- (17) E. D. Mun, M. M. Altarawneh, C. H. Mielke, V. S. Zapf, R. Hu, S. L. Bud’ko, and P. C. Canfield, Phys. Rev. B 83 100514(R) (2011).
- (18) K. Cho, H. Kim, M. A. Tanatar, Y. J. Song, Y. S. Kwon, W. A. Coniglio, C. C. Agosta, A. Gurevich, and R. Prozorov, Phys. Rev. B 83 060502(R) (2011).
- (19) H. Eschrig and K. Koepernik, Phys. Rev. B 80, 104503 (2009).
- (20) J. Paglione and R. L. Greene, Nature Physics 6, 645 (2010).
- (21) S. Weyeneth, R. Puzniak, N. D. Zhigadlo, S. Katrych, Z, Bukowski, J. Karpinski, and H. Keller, J. Supercond. Novel Magnetism 22, 347 (2009).
- (22) A. Gurevich, Phys. Rev. B 67, 184515 (2003).
- (23) M. M. Altarawneh, C. H. Mielke, and J. S. Brooks, Rev. Sci. Instrum. 80, 066104 (2009).
- (24) C. Mielke, J. Singleton, M.-S. Nam, N. Harrison, C. C. Agosta, B. Fravel, and L. K. Montgomery, J. Phys.: Condens. Matter 13, 8325 (2001).
- (25) T. Coffey, Z. Bayindir, J. F. DeCarolis, M. Bennett, G. Esper, and C. C. Agosta, Rev. Sci. Instrum. 71, 4600 (2000).
- (26) V. G. Kogan and R. Prozorov, arXiv:1112.0996 (2011).
- (27) N. R. Werthamer, E. Helfand, and P. C. Hohemberg, Phys. Rev. 147, 295 (1966).
- (28) A. M. Clogston, Phys. Rev. Lett. 9, 266 (1962).
- (29) K. Maki, Phys. Rev. 148, 362 369 (1966).