Daniel Schaerer 22institutetext: Observatoire de Genève, Université de Genève, 51 Ch. des Maillettes, 1290 Versoix, Switzerland; CNRS, IRAP, 14 Avenue E. Belin, 31400 Toulouse, France 22email: daniel.schaerer@unige.ch
Evolutionary synthesis models as a tool and guide towards the first galaxies⋆
Abstract
We summarize the principles and fundamental ingredients of evolutionary synthesis models, which are
stellar evolution, stellar atmospheres, the IMF, star-formation histories, nebular emission, and
also attenuation from the ISM and IGM. The chapter focusses in particular on issues of
importance for predictions of metal-poor and Population III dominated galaxies.
We review recent predictions for the main physical properties and related observables of star-forming galaxies
based on up-to-date inputs. The predicted metallicity dependence of these quantities
and their physical causes are discussed. The predicted observables include in particular
the restframe UV–to-optical domain with continuum emission from stars and the ionized ISM, as well
as emission lines from H, He, and metals.
Based on these predictions we summarize the main observational signatures (emission line strengths, colors etc.),
which can be used to distinguish “normal” stellar populations from very metal-poor objects or even Pop III.
Evolutionary synthesis models provide an important and fundamental tool for studies of galaxy formation and evolution,
from the nearby Universe back to first galaxies. They are used in many applications to interpret
existing observations, to predict and guide future missions/instruments, and to allow direct comparisons
between state-of-the-art galaxy simulations and observations.
1 Introduction
Evolutionary synthesis models, first pioneered by Tinsley (1968, 1980), are a simple, but fundamental tool to predict the emission of integrated stellar populations, such as those of distant galaxies. Their basic immediate objective is to predict the total spectrum or the spectral energy distribution (hereafter SED) emitted e.g. by a galaxy or by another ensemble of stars.
Synthesis models are generally used to interpret observations of integrated stellar populations, i.e. to infer their physical properties – such as the total stellar mass, star formation rate, age, attenuation etc. – from comparisons between models and observations. Often synthesis models are also used to predict/guide future observations, since from our knowledge of star formation, stellar evolution, and atmospheres, one is able to predict a large number of observables for a very broad range of parameters (ages, star formation histories, stellar initial mass functions, metallicities, redshifts etc.). This is particularly true in the present context related to the first galaxies, which are at the limit or beyond the reach of present-day facilities, and where predictions are needed to plan future missions and devise observational strategies to search for these distant, “exotic” objects.
Focussing on emission from stars and the ISM in the ultraviolet, optical, and near-IR domain (taken in their rest frame) – the spectral range where usually stars dominate the integrated emission of galaxies – we will describe and summarize the main ingredients (inputs) of synthesis models, as well as the basic assumptions and related uncertainties (Sect. 2). In Sect. 3 we show how and why physical properties of stellar populations and corresponding observables vary with metallicity, and which main differences are expected between “first galaxies”, metal-free (PopIII), metal-poor, and present-day stellar populations. Methods used to distinguish/select observationally PopIII-dominated and similar objects from “normal” galaxies are reviewed in Sect. 4. Brief conclusions are given in Sect. 5.
2 Synthesis models – basic ingredients and assumptions
Popular, widely used synthesis models include the models of Bruzual and Charlot (Bruzual & Charlot, 2003), the Starburst99 models specialized for young stellar populations/starbursts (Leitherer et al., 1999), the PÉGASE models of Fioc & Rocca-Volmerange (1999), and also recent models including a special treatment of TP-AGB stars (Maraston, 2005; Maraston et al., 2006). Recent reviews on synthesis models, including some basics as well as topics for current and future improvements, have e.g. been presented by Bruzual (2003, 2011), Maraston (2011a), and Leitherer & Ekstrom (2011). Papers presenting tests and confrontation of synthesis model predictions with basic observations of young stellar populations include e.g. Cid Fernandes et al. (2001); Bruzual (2003); Cid Fernandes & González Delgado (2010).
Schematically, the following needs to be known (or assumed) to be able to predict the spectrum of integrated stellar populations:
-
1.
Stellar evolution: A description of the evolution (in time) of stars in the HR-diagram as a function of their initial mass, metallicity (chemical composition), and other parameters which may govern their evolution (e.g. initial rotation rate, magnetic field).
-
2.
Stellar atmospheres: A description of the emergent spectrum (over the spectral range of interest) of individual stars at all phases of their evolution.
-
3.
The stellar initial mass function (IMF), which determines the relative distribution of stars of different masses at the time of formation.
-
4.
The star formation history (SFH) of the galaxy, describing the history of the amount of stars (commonly expressed in mass formed per unit time), i.e. the star formation rate (SFR) as a function of time.
-
5.
Nebular emission, i.e. the emission from Hii regions nearby massive star-forming regions, which – in general – cannot be separated from the stellar emission.
-
6.
Attenuation within the intervening interstellar medium (ISM) of the galaxy. For a simple prescription this implies that we need to know the attenuation law (i.e. it’s dependence on wavelength), and the amount of attenuation at a given reference wavelength.
-
7.
Intergalactic medium opacity: Finally, since the photons emitted by a distant galaxy also travel through the intergalactic medium (IGM), its transmission properties must be known/specificed.
Items 1–3 describe the properties of stars and ensembles thereof. So-called simple stellar populations (SSPs), corresponding to an ensemble of stars formed at the same time, represent the basic units. Predictions for SSPs are widely distributed in the literature. In practice SSPs may represent stellar populations of stellar clusters where the age spread between stars is small. For any arbitrary, given star formation history (4), the predicted spectrum can be derived from SSPs by convolution. Nebular emission (5) is important to properly describe star-forming galaxies, where the contribution from young massive stars is significant. The remaining items (6, 7) describe the way the emitted spectrum is altered both at the galaxy scale and through the IGM on its way to the observer.
Evolutionary synthesis models traditionally describe the emission from stars (plus emission from surrounding Hii regions in some extensions). By construction such models are thus usually tailored to the (rest-frame) UV–optical–near-IR part of the electromagnetic spectrum, where emission from stars (+nebulae) dominate. This is the domain on which the present text is focussed. Extensions of these models to other wavelength domains, e.g. to X-rays or to the IR–radio, have also been constructed by Mas-Hesse & Kunth (1991); Cerviño et al. (2002). Since focussed on primeval galaxies and on their observability, we will here emphasize in particular very low metallicities (necessarily more important in the early Universe) and relatively massive stars, which dominate the rest-frame UV emission in strongly star-forming galaxies.
Let us now briefly discuss each of these “ingredients” of evolutionary synthesis models with a special emphasis on first/distant galaxies.
[scale=.4]pop3_hrd.eps
2.1 Stellar evolution
Stellar evolution models have seen a “boom” in the 1990ies, when new radiative opacities were published, triggering extensive evolutionary track calculations for a wide range of stellar masses and metallicities. The most widely used of these models are the Geneva and Padova tracks (see Schaller et al., 1992; Meynet et al., 1994; Bertelli et al., 1994), which have been extensively used since then for evolutionary synthesis models and other applications. An illustration of such tracks for zero metallicity, and a comparison with 1/50 Z⊙ and solar metallicity (Z⊙) is shown in Fig. 1. One of the main, if not the main property distinguishing PopIII stars from others is clearly apparent from this figure: the fact that massive ( M⊙) stars are much hotter than their counterparts at non-zero metallicity. For the most massive stars their effective temperature can reach up to K on the zero-age main sequence (ZAMS). These differences has several important observational consequences, which are discussed below. A detailed discussion of the peculiarities of interior models of PopIII stars and the literature before 2001 is given in Marigo et al. (2001).
Since the stellar evolution models computed in the 1990ies including numerous physical processes among which in particular mass loss, large efforts have been undertaken to describe other processes affecting the interior evolution of stars, such as stellar rotation, magnetic fields, and the various transport mechanisms related to it. For reviews on these issues see e.g. Maeder & Meynet (2000, 2012) The impact of other, maybe more “exotic” phenomena, like possible variations of the fine-structure constant on stellar properties at very low metallicity have e.g. been explored by Ekström et al. (2010).
Several arguments, both observational and theoretical, indicate that the importance of rotation becomes stronger for low metallicities (see e.g. Maeder et al., 1999; Chiappini et al., 2006). However, the predicted stellar tracks depend strongly on the initial rotational velocity (a free parameter) and its history (which is predicted from the model following also the evolution of angular momentum), which are very uncertain, and difficult to constrain at (very) low metallicity. In consequence, the impact of stellar rotation on predictions for integrated stellar populations remains currently poorly known. Preliminary explorations of the impact of stellar rotation, mostly at solar metallicity, have been presented by Vázquez et al. (2007), Leitherer & Ekstrom (2011), and Levesque et al. (2012, submitted).
Recent PopIII tracks including the effects of stellar rotation and magnetic fields are presented in Ekström et al. (2008) and Yoon et al. (2012). For the initial rotational velocities chosen in the former paper, rotation has a small impact on the evolution in the HR-diagram and hence on predictions from synthesis models. However, the surface abundances of these stars are significantly modified, with several implications on nucleosynthesis and chemical evolution. Effects with potential impact on evolutionary synthesis models can be found for very high rotation rates (cf. Yoon et al., 2012), when stars are very strongly mixed, following a nearly homogeneous evolution, which implies much hotter temperatures and a blue-ward evolution. In this case properties such as their UV and ionizing flux are significantly altered, leaving imprints on the spectra predicted from stellar populations containing such stars. However, the distribution of rotational velocities remains poorly know, especially at very low metallicity, and hence the proportion of stars with properties significantly altered by rotation are not known. Schaerer (2003) has explored in a simple way the possible impact of very hot, homogeneous PopIII stars on the hardness of the ionizing spectrum of stellar populations. It is quite evident that we currently do not have a clear view of the impact stellar rotation and magnetic fields may have on evolutionary synthesis models, quite independently of metallicity. Progress in these areas is ongoing.
Other issues of general importance for synthesis models include e.g. the importance of thermally-pulsating asymptotic giant branch (TP-AGB) stars, whose contribution to the integrated light is being debated (see Maraston, 2005, 2011b, and references therein), and the recurrent question of the importance of binary stars (cf. Vanbeveren et al., 1998; Schaerer & Vacca, 1998; Belkus et al., 2003; Dionne & Robert, 2006; Eldridge, 2011) For our present objective, first galaxies, uncertainties related to TP-AGB stars are not a major concern, since we are dealing with young stellar populations and focussing on the UV to optical (rest-frame) domain, where these stars can safely be neglected. The evolution of close massive binary stars can alter the predicted spectra of young stellar populations, as illustrated e.g. recently by Eldridge (2011). However, the physics of these stars is even more complex than that of single stars, and depends on a number of additional, poorly constrained parameters. In any case, it is important that the predictions from stellar evolution models be compared to and tested against direct stellar observations in our Galaxy and in the nearby Universe. This includes e.g. observations of individual stars in clusters, their basic stellar parameters and surface abundances, color-magnitude diagrams, integrated colors of clusters, statistics of stars of different types and trends with metallicity etc. Such comparisons have e.g. been carried out with the (non-rotating) Padova and Geneva models (cf. Maeder & Meynet, 1994; Bruzual, 2003; Bruzual & Charlot, 2003; Massey, 2003; Meynet & Maeder, 2005), and are being carried out for the latest tracks including stellar rotation. They serve thus also to “calibrate” uncertainties or unknowns in the stellar models, and hence to place synthesis model predictions on the best ground.
2.2 Stellar atmospheres
It is well known that strong departures from local thermodynamic equilibrium (LTE) occur in the atmospheres of hot stars. To properly predict the emergent spectra of massive stars it is therefore essential to use non-LTE model atmospheres. This statement holds in particular also for low- and zero metallicities, as departures from LTE significantly alter the level populations of H and He, which – together with electron scattering – are the main opacity sources in stars of such composition. While generally stellar winds also affect the predicted spectra of massive star (e.g. Gabler et al., 1989), the mass outflow from very low metallicity stars is very low, and its effect can hence be safely neglected to compute the observable properties of PopIII and similar massive stars (cf. Schaerer, 2002; Kudritzki, 2002; Krtička & Kubát, 2006). Using non-LTE plane parallel model atmospheres is therefore sufficient for this purpose. For less extreme metallicities, appropriate model atmospheres describing main sequence stars, Wolf-Rayet stars with strong winds, and also cooler stars must be combined (cf. Conti et al., 2008) to achieve the most reliable synthesis model predictions (e.g. Leitherer et al., 1999; Smith et al., 2002).
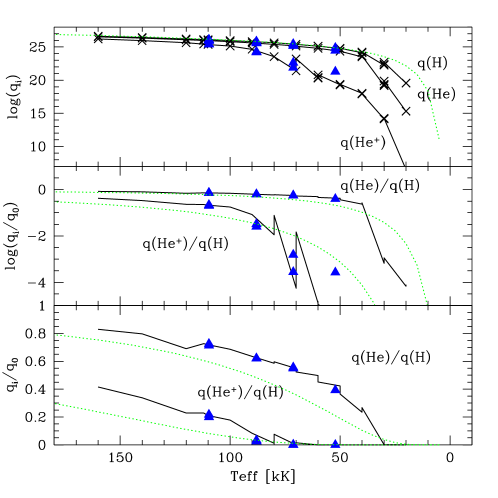
[width=0.8angle=90,trim=0cm 13cm 1cm 1cm,clip]15236fg20.ps
The predicted ionizing fluxes of H, He, and He+ from PopIII stars as a function of effective temperature is shown in Fig. 2. For comparison, the same values predicted using simple black-body spectra are also shown. While for 40 kK black bodies provide a good approximation to the total number of H ionising photons (i.e. at energies 13.6 eV), this is not the case for the shape of the spectra at higher energies, for the number of He and He+ ionizing photons, and for other features such as the Lyman break (cf. Schaerer, 2002). Also, using black-body spectra is a bad approximation to compute observable properties such as UV fluxes and emission line strengths (equivalent widths), since black-bodies do not reproduce the main bound-free edges, which significantly shape true stellar spectra. See Fig. 3 for an illustration. In short, appropriate state-of-the-art stellar atmosphere models should be used for reliable predictions both of individual stars and integrated stellar populations.
2.3 IMF
As for other ingredients summarized above, the stellar initial mass function (IMF) is a separate topic, to which many papers and conferences are devoted (see e.g. Gilmore & Howell, 1998; Bastian et al., 2010; Treyer et al., 2011)
In the nearby Universe the IMF is well described by a log-normal function for masses below M⊙, and by a power-law above that (Chabrier, 2003), as already found e.g. in the pioneering study of Salpeter (1955). Other authors approximate the IMF by piecewise power laws (Kroupa, 2001). In our Galaxy and in other nearby systems it is found that the IMF is only weakly dependent on environnent (Chabrier, 2003; Bastian et al., 2010). For obvious reasons it is not possible to constrain the IMF in the same manner (e.g. by direct star counts) outside the local Group. Hence our empirical knowledge on the IMF and possible variations with metallicity, stellar density, UV radiation field and other factor which may influence it, is very limited.
For many/most observables measurable for high-redshift, star-forming galaxies only the upper part of the IMF is relevant, since massive stars largely dominate the luminosity in integrated stellar populations. As a reasonable rule of thumb one may therefore simply rescale the results derived for one given IMF to those expected for another IMF differing in the domain of low stellar masses (i.e. typically at M⊙). This is e.g. used to “correct” results from synthesis models computed for a Salpeter IMF extrapolated down to 0.1 M⊙ to those expected for a more realistic IMF below 1 M⊙. However, the applicability of this “rule” depends on the age and star-formation history, and on the observable used.
Several studies, following different arguments have suggested deviations from the “local” IMF in distant galaxies with deviations depending on environment, galaxy type, gas density, metallicity and other factors. For an overview over this vast topic the reader is referred to a recent conference proceedings on the IMF (Treyer et al., 2011). For metal-poor environments and Population III stars, simulations have long suggested a preferential mass scale much higher than in the local Universe, with ”typical” masses of the order of 10–100 M⊙. See the chapters of Glover and Johnson in this book, and also recent conference proceedings on the first stars (e.g. Hunt et al., 2008; Whalen et al., 2010). This difference, basically due to significantly reduced cooling of metal-poor or free gas, is predicted to occur below a certain critical metallicity Z⊙ (Schneider et al., 2002, 2003). If correct, this implies a different, more massive IMF, at least below this metallicity threshold. Accordingly various parametrisations of the IMF have been used in this domain (see e.g. Larson, 1998; Tumlinson, 2006; Raiter et al., 2010b) . However, as already mentioned above, our knowledge of the IMF, especially in such extreme conditions remains very limited, and synthesis models can simply assume different cases and examine their implications.
Synthesis models also generally make the assumption of a continuous, well-populated IMF, which is correct for stellar systems with a large enough number of stars. However, in “small” stellar populations the analytic statistical description of the IMF will break down, and sampling of the IMF with a small/finite number of stars may lead to significant differences, due to the progressive absence of massive stars. Examples of such “stochastic” IMF effects on colors, ionizing fluxes and others have been illustrated by various authors (see Cerviño et al., 2000; Cerviño & Luridiana, 2006; Bruzual, 2002, and references therein). Typically stochastic effects are found to be significant for cluster masses below M⊙ or for low star formation rates SFR 1 M⊙ yr-1, although this limit again depends on the observable of interest (Cerviño et al., 2000; Fumagalli et al., 2011). For small entities, such as the first galaxies, stochasticity may thus be important for some cases.
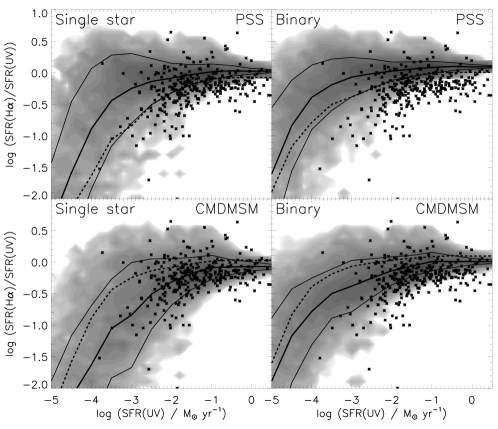
The question of a stochastically sampled IMF is also related to the concept of the integrated galactic initial mass function (IGIMF) introduced by Kroupa and collaborators (see e.g. Pflamm-Altenburg et al., 2007; Weidner & Kroupa, 2006). Various applications of synthesis models implementing a stochastic IMF can e.g. be found in Pindao et al. (2002), Fumagalli et al. (2011), and Eldridge (2011). For example, a stochastic IMF leads to a significant scatter in the relative H and UV output for populations with a low SFR (i.e. forming a small number of stars), as illustrated in Fig. 4. This is due to the fact that these two emissions originate from stars of somewhat different mass regimes, H being due to more massive stars than the UV continuum. Since stochastic effects are of increasing importance for low mass / low SFR galaxies, this issue should be relevant for studies of the first galaxies. The implications remain largely to be worked out.
2.4 Star formation history
Star formation histories are a key ingredient for evolutionary synthesis models. As already mentioned above, simple stellar populations (SSPs) represent the basic units, and for any arbitrary star formation history (SFH), the integrated spectrum can be derived from SSPs by convolution. Historically, simple parametrisations of the SFH have been used, the most common one being a family of exponentially decreasing SFHs with SFR, where is a characteristic timescale. It is well known that such star formation histories are able of reproducing the observed spectro-photometric properties of present-day galaxies of all Hubble types (Larson & Tinsley, 1978; Tinsley, 1968; Kennicutt, 1998).
Constant SFR, corresponding to , is a limiting case often used to derive calibrations for the SFR from various observables (e.g. UV continuum, H recombination lines, bolometric luminosity etc.). See e.g. Kennicutt (1998); Schaerer (2000).
Depending on the application, other, more complex SFHs have been explored. Many numerical simulations of galaxy formation and evolution (semi-analytical models, hydrodynamic models and others) are now “coupled” with evolutionary synthesis models to predict observable properties consistent with their (complex) star formation histories.
For distant () galaxies SF histories and corresponding timescales are currently vividly debated. For example, simulations suggest rapid growth of galaxies with increasing star formation rates during the first Gyr of the Universe, i.e. at (Finlator et al., 2007, 2011). From the apparent tightness of the mass-SFR relation of galaxies at high redshift some authors argue for rising star formation histories for galaxies down to 2–3 (Maraston et al., 2010; Papovich et al., 2011). At somewhat lower redshift, other authors suggest e.g. “delayed” star formation histories SFR showing both phases of increasing (for ) and decreasing SFR (), and suggest relatively long timescales of several 100 Myr (Wuyts et al., 2011). From the clustering of 4–5 Lyman break galaxies (LBGs), Lee et al. (2009b) argue for relatively short duty cycles ( Gyr). Even shorter timescales and declining SFHs are favored from SED analysis of Lyman break galaxies at 3–6 with spectral templates accounting for nebular emission (Schaerer & de Barros, 2011, de Barros et al. 2012, in preparation). The question of star formation histories of distant galaxies is closely related to the debate about the main mode of star formation, i.e. schematically about the relative importance of (cold) accretion driven star formation and mergers (see e.g. Khochfar & Silk, 2011, and references therein) In any case the question of the “typical” star formation history of distant galaxies is not yet settled, and a large diversity of histories – more complicated than simple, parametrised functions – must occur in nature. Furthermore it is clear that predictions from evolutionary synthesis models strongly depend on this important quantity.
2.5 Nebular emission
Stars (and stellar populations) described above provide a dominant, but not the sole source of emission in the (rest-frame) UV, optical, and near-IR light of galaxies. Emission from ionized regions (the so-called Hii regions) of the surrounding ISM is another important contribution, which needs to be taken into account to describe/predict the spectra or SEDs of galaxies in this part of the electromagnetic spectrum. Hence this should, in general, be treated (added) to the prediction from “standard” evolutionary synthesis models describing stellar emission only.
Most galaxy types across the Hubble sequence show at least some signs of emission lines in the optical. Their strength increases towards late types and irregular galaxies, basically due to an increasing ratio of present over average past star formation (cf. Kennicutt, 1998). Nearly by definition, nebular emission is associated with star-forming galaxies, since – as long as stars more massive than 5–10 M⊙ are formed – star formation always implies the emission of UV photons with energies 13.6 eV capable of ionizing H and other elements in the ISM, causing a plethora of recombination lines. In addition several processes in Hii regions, including recombination and 2-photon emission from the 2 2S level of hydrogen, produce a continuum emission longward of Ly whose emissivity increases with wavelength (Osterbrock & Ferland, 2006). Hence, nebular emission implies a priori both line and continuum emission. An illustration of the three emission components, stars, nebular lines, and nebular continuum, observed in metal-poor, nearby galaxies is shown in Fig. 5.

To first order, the strength/luminosity of both lines and nebular continuum emission depends on the flux/luminosity of ionizing photons in the Lyman continuum denoted here by , as can be derived from well known nebular physics, assuming e.g. so-called case A or B and typical nebular densities and temperatures (Osterbrock & Ferland, 2006). In this approximation it is straightforward to predict the emission from the major H and He recombination lines and continuum emission for a given source spectrum, such as calculated by evolutionary synthesis models. For other emission lines from Hii regions, mostly forbidden metal-lines (in the optical domain), full photoionization models need to be computed, or other prescriptions be used.
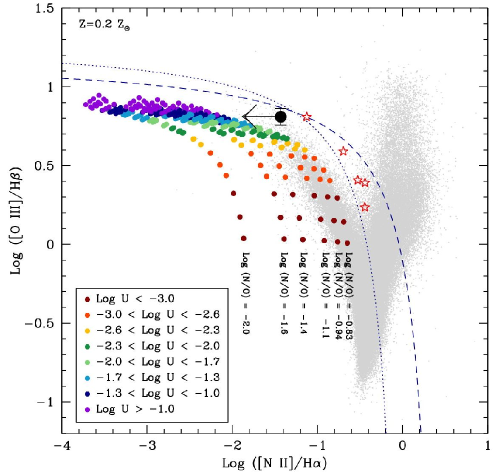
To second order nebular emission depends on the conditions in the nebula/ISM, which are primarily described by the electron temperature and density (, ), and most importantly on the ionization parameter . The latter depends on the radiation field, geometry, and density, and in general the nebular conditions also depend on metallicity. It is well known that Hii regions and galaxies at low metallicity show higher excitation and stronger optical emission lines, as illustrated e.g. in nebular diagnostic diagrams (Baldwin et al., 1981; Veilleux & Osterbrock, 1987), an example of which is shown in Fig. 6.
Since both the excitation of the ionized gas and the ionizing flux increase with decreasing metallicity, nebular emission must on average be stronger in unevolved/early galaxies than in present-day galaxies. How this affects various observables will be discussed in detail below.
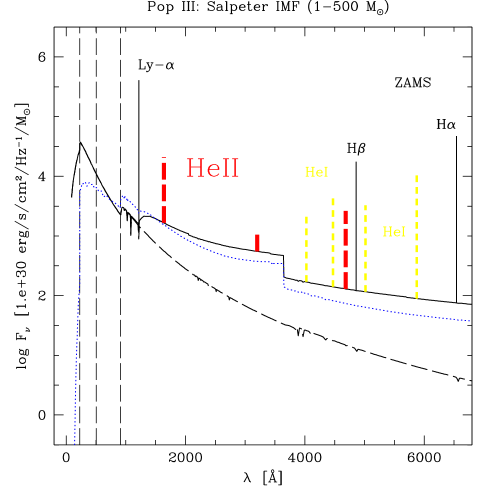
Indeed, for Population III stars and for ensembles thereof, Schaerer (2002) has demonstrated that nebular continuum emission dominates the spectrum at wavelength longward of Ly, as illustrated in Fig. 7. At higher metallicities the effect can also be significant, as discussed below. In some metal-poor, nearby galaxies, nebular continuum emission is readily observable in the UV-optical domain (see Fig. 5), and signs of nebular emission are frequently observed in spectra and photometry of starburst galaxies, e.g. in diffuse, outer regions, or in the near-IR domain in young star-forming galaxies such as Hii galaxies, blue compact dwarfs, and similar objects (cf. Izotov et al., 1997; Papaderos et al., 2003; Izotov et al., 2001; Vanzi et al., 2002; Guseva et al., 2004). At high redshift a peculiar, lensed galaxy (the so-called Lynx arc at ) has been found, whose spectrum appears to be dominated by nebular continuum emission and lines (Fosbury et al., 2003). A similar explanation has been suggested for a galaxy (Raiter et al., 2010a), although alternative explanations based on more conventional galaxy SEDs can also be found (Vanzella et al., 2010). In any case, the objects and conditions mentioned here represent probably just somewhat extreme examples illustrating the potential effects of nebular emission, and their detailed importance needs to analyzed on a case-by-case basis. However, there is growing evidence that nebular emission plays a role for the interpretation of observations of many/most Lyman break and Ly emitter galaxies at (cf. Schaerer & de Barros, 2011, and discussion below).
Several evolutionary synthesis models, such as PÉGASE, GALEV and others have long included nebular emission (continuum emission and also lines in some cases, and relying on different assumptions) (cf. Fioc & Rocca-Volmerange, 1999; Leitherer et al., 1999; Charlot & Longhetti, 2001; Anders & Fritze-v. Alvensleben, 2003; Zackrisson et al., 2008). However, other widely used codes (e.g. Bruzual & Charlot, 2003) neglect this component. To interpret emission line observations of Hii regions and galaxies, the stellar spectra predicted by evolutionary synthesis codes have often been used as input for photoionisation models (Garcia-Vargas et al., 1995; Stasińska & Leitherer, 1996; Stasińska et al., 2001; Kewley et al., 2001) Recently, nebular emission has again received considerable attention, in particular for the interpretation of photometric observations of distant Lyman break galaxies (LBGs) and Ly emitters (LAE) as discussed below (Schaerer & de Barros, 2009, 2010; Ono et al., 2010; Schaerer & de Barros, 2011; Acquaviva et al., 2011).
Now that all emission sources have been “assembled”, we need to briefly discuss absorption/attenuation professes occurring along the lines-of-sight to the observer.
2.6 Attenuation law
To compare predictions of evolutionary synthesis model with observations, the effect of interstellar reddening (extinction and/or attenuation) obviously needs to be taken into account. Simple prescriptions are generally used, describing e.g. the mean observed attenuation law of star-forming galaxies (e.g. the “Calzetti law” Calzetti, 2001) or various laws describing extinction in the Galaxy or the SMC. At very high redshift Gallerani et al. (2010) have recently argued for an attenuation law differing somewhat from the Calzetti law, probably due to different dust composition from supernovae dominating in the early Universe.
In the nearby Universe, stellar emission is generally found to be less attenuated than emission lines Calzetti (2001), which is attributed to geometrical effects. If this also applies to distant star-forming galaxies remains, however, controversial and may vary from case to case (e.g. Hainline et al., 2009; Yoshikawa et al., 2010). Other complication arise e.g. in the presence of multiple stellar populations suffering from different attenuations. More complex prescriptions and additional assumptions are needed to describe such cases (see e.g. Charlot & Fall, 2000; Granato et al., 2000).
In concrete applications of synthesis models to fitting (restframe) UV–optical photometric observations of star-forming galaxies attenuation/extinction is often degenerate with the age of the stellar population, since both lead to a redder SED on average. This well-known age–reddening degeneracy is illustrated e.g. in studies of simple stellar populations (see Cid Fernandes & González Delgado, 2010), distant star-forming galaxies (Pelló et al., 1999), distant red galaxies Pozzetti & Mannucci (2000), and in many other works. Obviously, the use of other, more sensitive indicators of age and/or attenuation, e.g. spectral lines, the Balmer break etc. Cid Fernandes et al. (cf. 2001), can reduce such degeneracies. A more detailed discussion of this and other issues related to the fitting of observed SEDs and spectra is beyond the scope of this Chapter.
2.7 IGM
Finally, the collective effect of the Lyman forest on predicted spectra of distant galaxies must also to taken into account. Indeed for redshifts above 3–4 the IGM significantly reduces the flux shortward of Ly in the restframe of the galaxy causing the Lyman (continuum) break at 912 Å to shift rapidly to Ly ( 1216 Å). Generally the average IGM attenuation is described by a simple expression derived from statistical analysis of the Ly forest, e.g. following Madau (1995) or recent updates of this work (Faucher-Giguère et al., 2008).
A related, important question in several contexts concerns the transmission of Ly photons emitted by high redshift galaxies. Indeed, as strong Ly emission is one of the expected signatures of primordial and very metal-poor stellar populations (cf. below), knowing its escape fraction out of galaxies and the subsequent transmission through the surrounding IGM are of fundamental importance. By the same token, observations of Ly emission (e.g. the Ly luminosity function of galaxies) and its evolution with redshift are used to constrain the IGM transmission and hence the reionization history of the Universe. For more information on these related topics we refer the reader to a vast literature including e.g. Haiman (2002); Fan et al. (2006); Schaerer (2007); Hayes et al. (2011); Dayal et al. (2011); Lidman et al. (2012) and references therein.
3 From present-day metallicities back to the first galaxies
The Starburst99 evolutionary synthesis models (Leitherer et al., 1999) and the models of Schaerer (2002, 2003) allow one to examine in detail the dependence of the expected observational properties of star-forming galaxies with metallicities from current (solar) metallicities to metal-poor and metal-free cases. Furthermore Schaerer (2002, 2003) and Raiter et al. (2010a) also present calculations for a variety of different IMFs, such that IMF or combined IMF/metallicity changes can be examined. We here summarize the behavior of some of the main observables based on these models.
3.1 UV–optical: stellar and nebular continuum emission
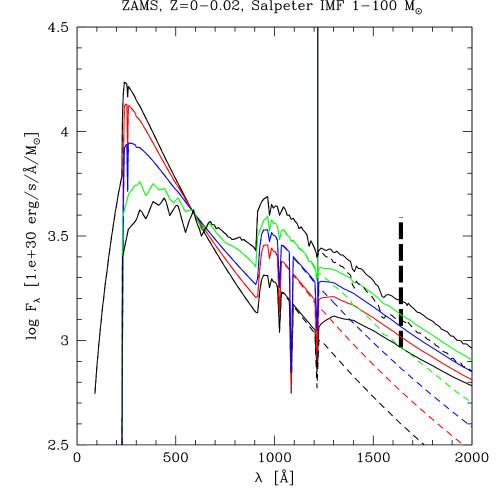
Figure 8 shows variations of the UV spectrum, including the ionizing ( Å) and non-ionizing part ( 912 Å) of a young stellar population with metallicity. Three main features are immediately clear: First, due to the increase of the average stellar temperature, the stellar spectrum becomes harder/bluer with decreasing metallicity . Second, the contribution of nebular continuum emission increases concomitantly. At young ages, the continuum longward of Ly ( Å) will be dominated by nebular emission. Finally, H and He emission lines become also stronger with decreasing (cf. below). The models in Fig. 8 assume so-called case B recombination, i.e. in particular that all ionizing photons are absorbed within the surrounding Hii region. This case obviously maximizes the nebular emission, whereas in a more general case where a fraction of Lyman continuum photons escape, nebular emission will be decreased; see e.g. Inoue (2011) and Fig. 9.
The color of the UV continuum and its variations can be quantified e.g. by the exponent of a power law adjusted to a specific spectral region. This so-called “-slope” determined from models and measured by spectroscopy or photometry is often used in the literature, in particular to estimate the amount of dust attenuation in high-z star-forming galaxies (see e.g. Meurer et al., 1999; Bouwens et al., 2009, and also the Chapter by Dunlop in this book).
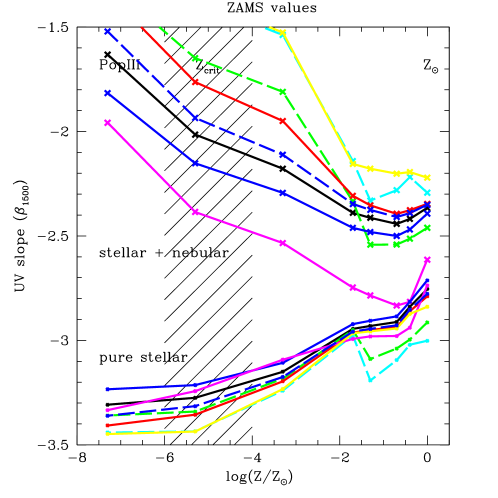
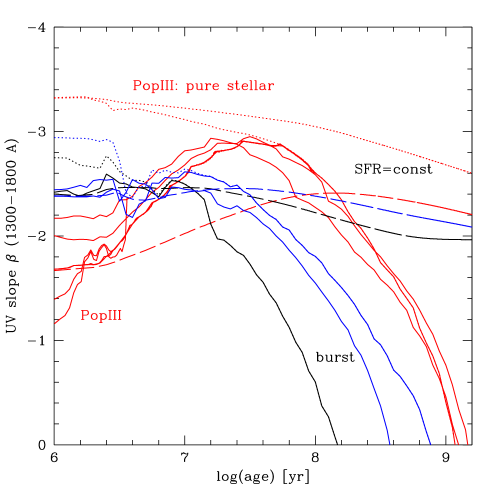
Figure 10 shows the dependence of the predicted -slope (here measured between 1300 and 1800 Å) of a young (zero age) population on metallicity and on the IMF (coded by different colors). Fig. 11 shows the same quantity as function of age for instantaneous bursts and constant SFR. From Fig. 10 we see how the stellar spectrum steepens (becomes bluer) with decreasing . However, once nebular emission is taken into account (here with =0) the UV spectrum becomes significantly flatter and the trend with metallicity even inverses! In short, the UV slope cannot be a good metallicity indicator. Figure 11 shows the rapid evolution of on timescales of 50–100 Myr. For constant SFR, reaches the typical asymptotic value of to , the precise value depending on the wavelength base used to define . Shifts of 0.1–0.3 in can be typical, as illustrated e.g. by Raiter et al. (2010b). For PopIII we see that the nebular contribution vanishes after Myr in a burst; between ages of 10–100 Myr an integrated population can reach a very blue spectrum with –3. Otherwise, and for more extended periods of star formation it is difficult, if not impossible, to obtain a UV spectrum steeper than , except if a significant fraction of Lyman continuum photons are “leaking” (i.e. ). Overall, the two figures show in particular the following: First, in principle metallicity cannot be inferred from the observed UV slope (cf. Schaerer & Pelló, 2005). Second, very steep/blue UV spectra () are not predicted for very metal-poor, primordial, populations, except if nebular emission is “suppressed”.
Some authors have indicated the possibility of unusually blue UV slopes in galaxies (Bouwens et al., 2010). However, the significance of these findings is low (Schaerer & de Barros, 2010; Finkelstein et al., 2010), and independent and more recent measurements (Castellano et al., 2011; Bouwens et al., 2011; Dunlop et al., 2012) do not show indications for exceptional populations or conditions (PopIII and strong leakage of Lyman continuum photons). Other observational aspects related to the UV slope of distant star-forming galaxies are discussed in the Chapter of Dunlop.
3.2 Ionizing photon production
To quantity the contribution of galaxies to cosmic reionization, and to predict their observable spectra it is important to know the amount of energy or photons emitted in the Lyman continuum, i.e. at Å or at energies eV. This quantity is straightforwardly predicted by evolutionary synthesis models, and is generally expressed as a photon flux (e.g. in units of photons per second) normalized for example per unit stellar mass, per unit SFR, or so. Another, observationally relevant way to express the Lyman continuum flux is by normalizing it to the UV output of the same stellar population, since the latter is a direct observable. This prediction is shown, for a constant star formation rate over relatively long timescales, as a function of metallicity and for different IMFs in Fig. 12, taken from Raiter et al. (2010b).
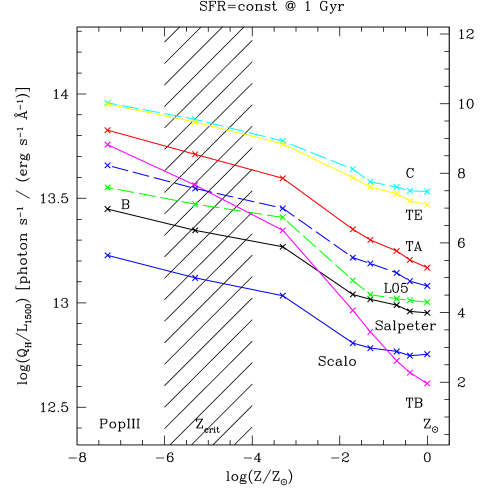
As expected increases with decreasing metallicity, since the ionizing flux depends very strongly on the effective stellar temperature and hence increases more rapidly than the UV luminosity. The IMF dependence also behaves as expected, with the IMFs favouring the most massive stars showing also the highest the ratios, since increases more rapidly with stellar mass than the UV luminosity. For constant SFR and for a fixed IMF, the increase of the relative ionizing power from solar metallicity to Pop III is typically a factor 2 to 3. When considering an IMF change from Salpeter to a massive IMF (i.e. all cases except Salpeter and Scalo) the increase of is larger, approximately 0.6 to 1 dex between solar and zero metallicity. For a very young (zero age) population the Lyman continuum production increases typically by 40 %.
Obviously, the ionizing photon output also depends on age and the assumed star formation history, not illustrated here (see e.g. Schaerer, 2002, 2003; Raiter et al., 2010b, where other normalisations are also used). For example, for zero age stellar populations the ionizing photon output per UV flux, , is higher than shown here, typically by up to a factor 2–4 depending on the IMF (see Fig. 1 of Raiter et al., 2010b). For very “massive” IMFs (i.e. IMFs favoring very massive stars) the predictions shown in Fig. 12 for constant star formation over long timescales (up to 1 Gyr) are of course very similar to those for much shorter, probably more realistic timescales for the first galaxies, since in any case the lifetimes of the bulk of the stars is much shorter than 1 Gyr. For general ages and star formation histories these quantities can be derived from the available data files of the models.
3.3 Ly emission
Given predictions for the Lyman continuum flux from a population, the flux in the different H and He recombination lines and nebular continuum emission from the surrounding Hii region can easily be computed, as described above (Sect. 2.5), using simple case A or B recombination theory or computing detailed photoionization models. The equivalent widths of these lines – a very useful measure of their strength – can also be computed, given the stellar and nebular continuum.
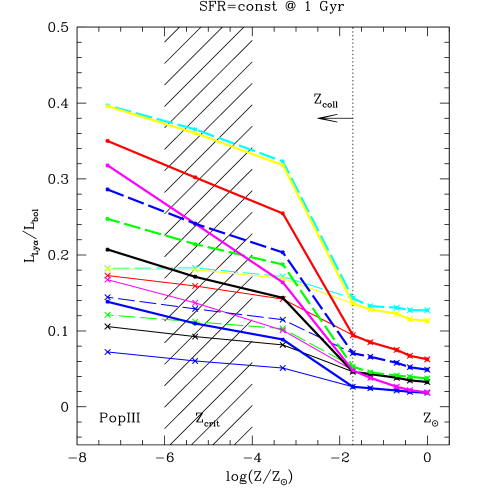
Since intrinsically the strongest line, and conveniently located in the rest frame UV domain, the Ly line is well known to be central to many studies of distant/primeval galaxies, in particular since the early work of Partridge & Peebles (1967) and the discovery of large populations of high redshift galaxies (e.g. Hu et al., 1998; Ouchi et al., 2008, and many other papers on such observations). Before the era of synthesis models and based on relatively crude assumptions, Partridge & Peebles (1967) estimated that up to 10% of the bolometric luminosity of primeval galaxies could be emitted in the Ly line. For constant star formation the most recent update, using our current knowledge of stellar evolution, atmospheres and the Salpeter IMF, place this number at 3 % for solar metallicity, as shown in Fig. 13. For the same IMF this fraction is expected to be significantly higher at low metallicity, especially below Z⊙, where departures from case B (due to collisional effects because of the high electron temperature in the nebula) significantly increase the ionization and hence also recombination rates, as recently showed by Raiter et al. (2010b). As illustrated in Fig. 13, the Ly line can therefore carry up to 20–40% (depending on the IMF) of the bolometric luminosity in primordial gas. As already discussed above for the ionizing photon flux, the precise fraction of the Ly luminosity obviously also depends on the age and star formation history. In any case, for the most extreme cases shown here (with IMFs dominated by massive stars), the predictions in Fig. 13 do not vary much with age, since the bulk of stars in such populations have anyway short lifetimes.

The maximum strength of Ly, measured by its equivalent width , is recognized as an interesting diagnostic of young, metal-poor/metal-free stellar populations in the first galaxies. Indeed, very high equivalent widths – well beyond the maximum of 200–250 Å predicted for solar metallicities – are expected for such populations. As such, or together with other unique spectral features of He ii discussed below, this line is of great interest to search for “unusual” stellar populations (see e.g. Malhotra & Rhoads, 2002). While various initial predictions of the Ly equivalent widths have yielded somewhat different results (see e.g. Tumlinson et al., 2001; Bromm et al., 2001), it is now clear that non-LTE atmosphere models, the treatment of nebular emission, and departures from case B, are essential ingredients to properly predict the strength and equivalent widths of Ly emission from very metal-poor populations (see Schaerer, 2002, 2003; Raiter et al., 2010b).
With these ingredients, the maximum predicted as a function of metallicity and for different IMFs reaches 2000 Å in the rest-frame (for a Salpeter IMF), or higher for IMFs favoring more massive stars, as illustrated in Fig. 14. In principle, observations of such large equivalent widths of Ly, if attributable to photoionization from stars (as opposed to non-thermal sources), should be strong sign-posts of extreme conditions (metallicity and/or IMFs) expected in the first galaxies. Possible complications for the application of such a diagnostic include the effect of the IGM and dust/radiation transfer inside galaxies, which can significantly reduce the Ly flux (and more so than the nearby UV continuum), and hence reduce . Furthermore the Ly line emission varies rapidly with time (on timescales of Myr). Neufeld (1991) has suggested that radiation transfer in a clumpy ISM could increase , which, if applicable, could complicate the interpretation of high objects. In any case it is clear that galaxies with unusually high Ly equivalent widths ( 200–250 Å) are interesting candidates worth examine further in searches for very metal-poor and PopIII galaxies.
3.4 Hardness of the ionizing spectrum and Helium line emission from the first galaxies
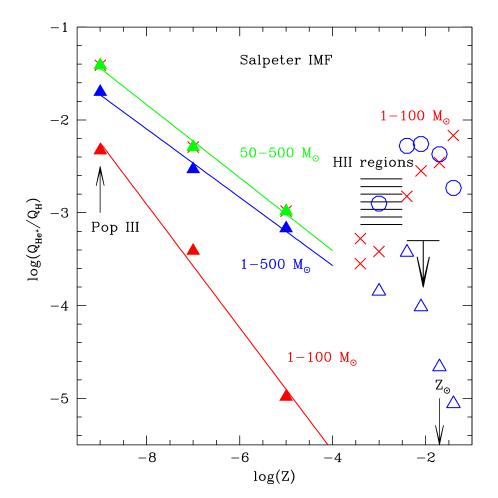
As already mentioned above, the first stellar populations are expected to contain unusually hot massive stars whose ionizing spectra will be harder than that of “normal” present-day massive stars. As a consequence these stars will emit in particular more ionizing photons above 54 eV ( 228 Å), the energy required to fully ionize Helium in the ISM surrounding these stars. This will give rise to recombination lines of He ii observable in the UV and optical domain (e.g. He ii 1640, He ii 4686), which should therefore be a fairly unique signature of these energetic, metal-poor stars.
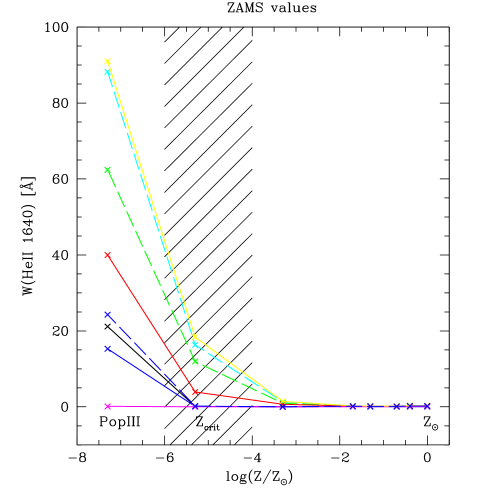
The use of He ii lines to identify PopIII stars/galaxies was discussed by Tumlinson & Shull (2000); Tumlinson et al. (2001); Bromm et al. (2001); Oh et al. (2001); Schaerer (2002, 2003), who present predictions for the strength of these lines. Schaerer (2003) and more recently Raiter et al. (2010b) have discussed the transition from zero metallicity to present-day conditions. The predicted hardness of the ionizing flux of starbursts at different metallicities and the behavior of the He ii 1640 line as an example, are shown in Figs. 15 and 16. The main result is indeed a strong increase of the hardness of the ionizing flux, typically by 2 orders of magnitudes from metallicities 1/50 Z⊙ to PopIII (zero metallicity). The (maximum) equivalent width of He ii 1640 (again taking the “dilution” by both the stellar and nebular continuum into account) is generally very low. Values above 5 Å (rest frame) are only expected for young, very metal-poor stellar populations. One should, however, remember that these predictions are based on simple assumptions (case B, ionization bounded regions), which may not always apply.
Johnson et al. (2009) have computed the emission in H and He ii recombination lines from hydrodynamic simulations taking into account the (time-dependent) leakage of Lyman continuum and He+ ionizing photons. They find a smaller leakage for the higher energy photons, as expected, since for stellar sources these less abundant photons are absorbed closer to the source than H ionizing photons. They therefore conclude that the He ii equivalent width should indeed be a fairly robust indicator for PopIII.
As for Ly, the prediction of the intrinsic emission in Helium lines may also be more complicated than expected from simple “photon-counting” assumed for case B (and implemented in most synthesis models). The basic reason for this is that both H and He in the ISM compete for ionizing photons, which leads to a lower He+ ionization rate in regions of low ionization parameter. This effect, already discussed by Stasińska & Tylenda (1986) for planetary nebulae, implies that the He ii line flux may be lower than predicted by evolutionary synthesis models, as shown by Raiter et al. (2010b). Detailed photoionization models are necessary to properly account for this effect.
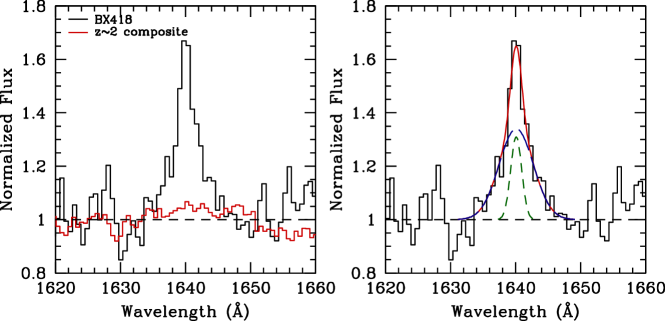
Finally – as always – it is also useful and important to examine what is known empirically about He ii emission. As well known, some stars (mostly the so-called Wolf-Rayet stars, evolved massive stars) show emission in He ii lines, and these lines are visible in the integrated spectra of some galaxies (sometimes eluded to as Wolf-Rayet galaxies, cf. Conti, 1991; Schaerer et al., 1999; Brinchmann et al., 2008). The He ii 1640 line is also seen in some spectra (individual or stacked) of high redshift galaxies (e.g. Shapley et al., 2003; Erb et al., 2010), as shown in Fig. 17. The observed equivalent widths remain, however, small compared to the values expected at very low metallicities. Due to the strong winds in the atmospheres of Wolf-Rayet stars these lines are broad, extending typically up to several thousand km/s (Conti et al., 2008). In spectra of sufficient signal-to-noise and spectral resolution it should therefore be possible to separate any stellar emission from nebular He ii emission (cf. Fig. 17). Nebular He ii emission is observed in some low-metallicity Hii regions and starburst galaxies in the nearby/low- Universe (see e.g. Schaerer et al., 1999, for a compilation and references therein). The hardness of the ionizing flux inferred from the relative He ii 4686/H intensities is shown by the shaded region in Fig. 15; it is lower by 1–1.5 orders of magnitude than what is expected for PopIII dominated objects! However, the origin of nebular He ii emission in nearby objects remains difficult to understand in many cases and several sources/mechanisms may contribute to it (see e.g. Schaerer, 1996; Izotov et al., 2001; Thuan et al., 2004; Kehrig et al., 2011; Shirazi & Brinchmann, 2012).
Despite these open questions, the prediction of very hard spectra from primordial stars and stellar populations remains quite solid, with the main uncertainty probably being the IMF of these stars. Signatures from He ii emission should therefore be a crucial tool for observational searches of the first stellar generations.
4 The main observables and how to distinguish Population III?
From the predictions from evolutionary synthesis models discussed in the previous Section it is already apparent how PopIII or very metal-poor populations can be distinguished from those of “normal” metallicities, mostly using H and He recombination lines. Other diagnostics can be derived from integrated colors, at least to some extent. Obviously, direct measurements of metallicity are a third way to tackle this question observationally. We here briefly summarize/describe these various diagnostics.
4.1 Hydrogen and Helium lines
The predicted behavior of recombination lines of H and He+ with metallicity has already been discussed above. In short, unusually strong Ly emission (say 250 Å) and/or strong He ii emission are among the best indicators expected for very metal-poor stellar populations, due to their unusually high temperatures plus possibly a more “massive” IMF (i.e. favoring more massive stars).
4.2 Metal lines
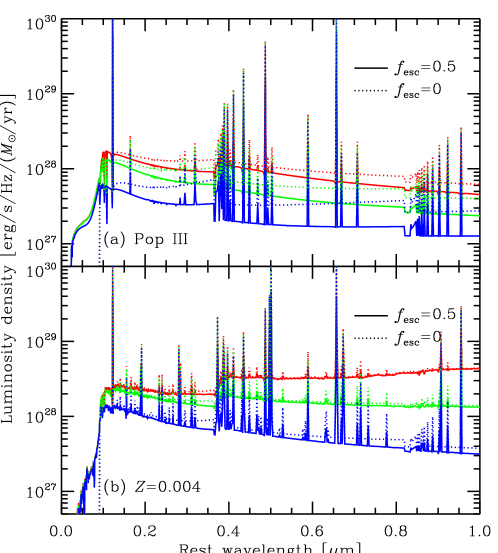
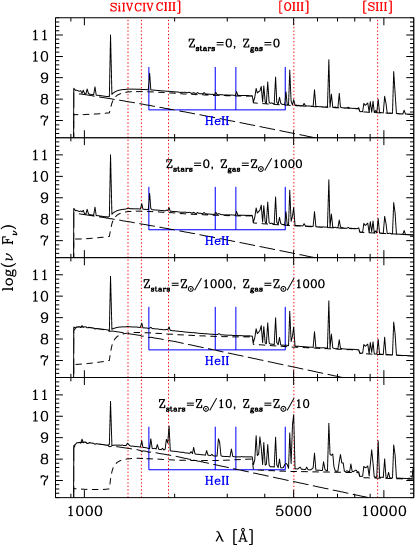
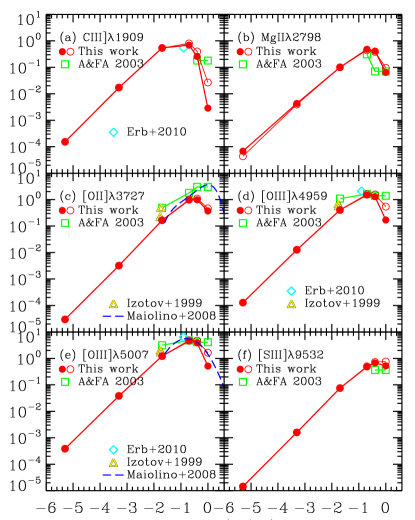
The relative line intensities of emission lines from all elements can be predicted from photoionization models, such as Cloudy (Ferland et al., 1998). Figure 18 shows the predicted spectra and strengths of several of the strongest lines from photoionization models as a function of metallicity. The left panel shows the overall SED including H and He lines for nebulae computed with blackbody spectra from calculations of Panagia (2005); the right panel the relative intensity of selected metal lines in the (rest frame) UV and optical domain computed using realistic SEDs from synthesis models (Inoue, 2011). As well known, the intensity of the forbidden oxygen lines peaks at low metallicities ( 1/50), and it is found to decrease monotonously to lower metallicity. Measuring e.g. a line ratio of [O iii] 5007/H would indicate metallicities below Z⊙ (or alternatively 4), which could be feasible with NIRSpec on the James Webb Space Telescope (JWST), according to Panagia (2005) and Inoue (2011). For more information on the feasibility of such observations see also the Chapter by Stiavelli.
4.3 Peculiar colors
Several recent papers have examined/proposed various criteria which could be used to distinguish PopIII from other stellar populations at high redshift, based on photometry/colors (see Inoue, 2011; Zackrisson et al., 2011a, b).
As already discussed above (Sect. 3.1), the UV slope is difficult to use as a metallicity indicator due to degeneracies between age/star-formation history and metallicity, and due to the contribution of nebular continuum emission which considerably “dampens” the metallicity dependence of the UV slope on metallicity. In cases of a large escape fraction of the Lyman continuum flux the latter difficulty is of course not present. Predicted magnitudes and colors for different populations and variable escape fractions are presented in Inoue (2011); Zackrisson et al. (2011b).
Zackrisson et al. (2011b) have proposed that PopIII galaxies at with low escape fractions can be distinguished from metal-rich objects based on two colors between 4.4 and 7.7 m, which could be measured with the NIRCam and MIRI instrument on the the JWST. The basis for such a distinction is the presence of strong H lines (H) and the absence of [O iii] 4959,5007 in these filters at these redshifts.
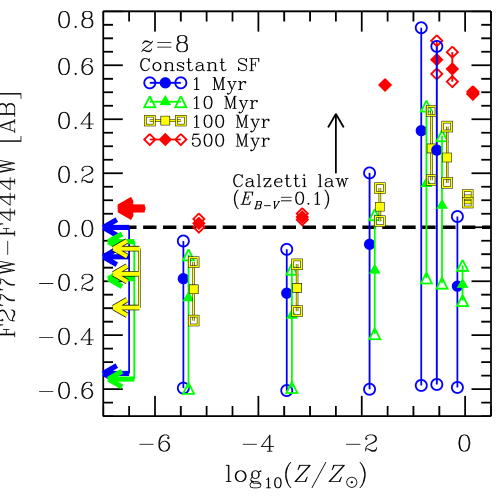
Other criteria to select very metal-poor galaxies exploit the expectation of very blue colors between the UV and optical domain, which can to some extent be quite independent of nebular emission, i.e. of the escape fraction (Inoue, 2011). Indeed, in case of strong nebular emission, the UV continuum should be strong with a Balmer jump in emission, and emission lines weak in the optical (due to low metallicity). If in contrast the escape fraction was large, one recovers again the intrinsically blue stellar spectrum. In both cases one therefore expects a fairly blue UV–optical color. At , for example, the color could be measured between 2.7 and 4.4 m with the JWST; the corresponding predictions are shown in Fig. 19. They show how such a blue color could be exploited to select very metal-poor ( Z⊙) galaxies, although in some conditions an overlap also exists with higher metallicities.
PopIII or very metal-poor galaxies with strong Ly emission (cf. Sect. 3.3) could also be detected due to the excess caused by this line. For example at 8–9 this can cause an unusually blue color, as shown by Pello & Schaerer (2003) and discussed in detail by Zackrisson et al. (2011a). In any case, it is clear that nebular emission (both lines and continua) can significantly contribute to broad-band fluxes (Schaerer & de Barros, 2009, 2010, 2011), and Schaerer et al. (2011) have recently shown that SED modeling techniques can recover the strength of Ly emission from current broad-band photometric surveys of 3–6 galaxies. This demonstrates that various photometric criteria and SED fitting methods should also be able to select peculiar objects, such as very metal-poor galaxies and PopIII dominated objects.
5 Conclusion
As should be clear from the onset, evolutionary synthesis models are an important, fundamental tool to interpret a wide variety of extra-galactic observations, from the nearby Universe to the most distant, first galaxies. They are commonly used to render complex state-of-the-art simulations of the Universe “visible”, i.e. to translate physical properties of simulated galaxies into observables. Finally, they are also key for many “prospective” studies, such as for the preparation of new missions, to guide observers searching for Population III objects etc.
Conceptually simple, synthesis models basically gather what is known about star-formation (the IMF and star-formation history), stellar evolution and atmospheres, and some additional emission processes, to predict the temporal evolution of the spectrum of an integrated stellar population. For this reason, synthesis models can basically only be as good/reliable as their input physics is. Therefore regular updates are necessary, and it is important to keep problems and limitations of these “ingredients” and assumptions in mind.
For the spectral modeling of first galaxies, very metal-poor galaxies, and Population III objects, one of the major unknowns is certainly the stellar initial mass function. The evolution of massive stars especially at low metallicities, observationally inaccessible in the nearby Universe, remains also uncertain and efforts are ongoing to properly account for the effects of rotation, magnetic fields and related processes. The star formation histories of young, distant galaxies are probably complex and fairly stochastic at least on short time scales. Some of these questions have been addressed above, at least schematically (Sect. 2).
In any case, combining the best of our knowledge evolutionary synthesis models represent a very useful and important tool for studies of galaxy formation and evolution, from the nearby Universe back to first galaxies.
Acknowledgements.
I have benefitted from many interesting and stimulating discussions and collaborations with colleagues during the past years. I wish to thank them here collectively for this. I acknowledge support from the Swiss National Science Foundation.References
- Acquaviva et al. (2011) Acquaviva, V., Gawiser, E., & Guaita, L. 2011, ApJ, 737, 47
- Anders & Fritze-v. Alvensleben (2003) Anders, P. & Fritze-v. Alvensleben, U. 2003, A&A, 401, 1063
- Baldwin et al. (1981) Baldwin, J. A., Phillips, M. M., & Terlevich, R. 1981, PASP, 93, 5
- Bastian et al. (2010) Bastian, N., Covey, K. R., & Meyer, M. R. 2010, ARA&A, 48, 339
- Belkus et al. (2003) Belkus, H., Van Bever, J., Vanbeveren, D., & van Rensbergen, W. 2003, A&A, 400, 429
- Bertelli et al. (1994) Bertelli, G., Bressan, A., Chiosi, C., Fagotto, F., & Nasi, E. 1994, A&AS, 106, 275
- Bouwens et al. (2009) Bouwens, R. J., Illingworth, G. D., Franx, M., et al. 2009, ApJ, 705, 936
- Bouwens et al. (2011) Bouwens, R. J., Illingworth, G. D., Oesch, P. A., et al. 2011, ArXiv e-prints
- Bouwens et al. (2010) Bouwens, R. J., Illingworth, G. D., Oesch, P. A., et al. 2010, ApJL, 708, L69
- Brinchmann et al. (2008) Brinchmann, J., Kunth, D., & Durret, F. 2008, A&A, 485, 657
- Bromm et al. (2001) Bromm, V., Kudritzki, R. P., & Loeb, A. 2001, ApJ, 552, 464
- Bruzual (2002) Bruzual, G. 2002, in IAU Symposium, Vol. 207, Extragalactic Star Clusters, ed. D. P. Geisler, E. K. Grebel, & D. Minniti, 616
- Bruzual & Charlot (2003) Bruzual, G. & Charlot, S. 2003, MNRAS, 344, 1000
- Bruzual (2003) Bruzual, A., G. 2003, in Galaxies at High Redshift, ed. I. Pérez-Fournon, M. Balcells, F. Moreno-Insertis, & F. Sánchez, 185–221
- Bruzual (2011) Bruzual, A., G. 2011, in Revista Mexicana de Astronomia y Astrofisica Conference Series, Vol. 40, Revista Mexicana de Astronomia y Astrofisica Conference Series, 36–41
- Calzetti (2001) Calzetti, D. 2001, PASP, 113, 1449
- Castellano et al. (2011) Castellano, M., Fontana, A., Grazian, A., et al. 2011, ArXiv e-prints
- Cerviño & Luridiana (2006) Cerviño, M. & Luridiana, V. 2006, A&A, 451, 475
- Cerviño et al. (2000) Cerviño, M., Luridiana, V., & Castander, F. J. 2000, A&A, 360, L5
- Cerviño et al. (2002) Cerviño, M., Mas-Hesse, J. M., & Kunth, D. 2002, A&A, 392, 19
- Chabrier (2003) Chabrier, G. 2003, PASP, 115, 763
- Charlot & Fall (2000) Charlot, S. & Fall, S. M. 2000, ApJ, 539, 718
- Charlot & Longhetti (2001) Charlot, S. & Longhetti, M. 2001, MNRAS, 323, 887
- Chiappini et al. (2006) Chiappini, C., Hirschi, R., Meynet, G., et al. 2006, A&A, 449, L27
- Cid Fernandes & González Delgado (2010) Cid Fernandes, R. & González Delgado, R. M. 2010, MNRAS, 403, 780
- Cid Fernandes et al. (2001) Cid Fernandes, R., Sodré, L., Schmitt, H. R., & Leão, J. R. S. 2001, MNRAS, 325, 60
- Conti (1991) Conti, P. S. 1991, ApJ, 377, 115
- Conti et al. (2008) Conti, P. S., Crowther, P. A., & Leitherer, C. 2008, From Luminous Hot Stars to Starburst Galaxies (Cambridge University Press)
- Dayal et al. (2011) Dayal, P., Maselli, A., & Ferrara, A. 2011, MNRAS, 410, 830
- Dionne & Robert (2006) Dionne, D. & Robert, C. 2006, ApJ, 641, 252
- Dunlop et al. (2012) Dunlop, J. S., McLure, R. J., Robertson, B. E., et al. 2012, MNRAS, 420, 901
- Ekström et al. (2010) Ekström, S., Coc, A., Descouvemont, P., et al. 2010, A&A, 514, A62
- Ekström et al. (2008) Ekström, S., Meynet, G., Chiappini, C., Hirschi, R., & Maeder, A. 2008, A&A, 489, 685
- Eldridge (2011) Eldridge, J. J. 2011, ArXiv e-prints
- Erb et al. (2010) Erb, D. K., Pettini, M., Shapley, A. E., et al. 2010, ApJ, 719, 1168
- Fan et al. (2006) Fan, X., Carilli, C. L., & Keating, B. 2006, ARA&A, 44, 415
- Faucher-Giguère et al. (2008) Faucher-Giguère, C.-A., Prochaska, J. X., Lidz, A., Hernquist, L., & Zaldarriaga, M. 2008, ApJ, 681, 831
- Ferland et al. (1998) Ferland, G. J., Korista, K. T., Verner, D. A., et al. 1998, PASP, 110, 761
- Finkelstein et al. (2010) Finkelstein, S. L., Papovich, C., Giavalisco, M., et al. 2010, ApJ, 719, 1250
- Finlator et al. (2007) Finlator, K., Davé, R., & Oppenheimer, B. D. 2007, MNRAS, 376, 1861
- Finlator et al. (2011) Finlator, K., Oppenheimer, B. D., & Davé, R. 2011, MNRAS, 410, 1703
- Fioc & Rocca-Volmerange (1999) Fioc, M. & Rocca-Volmerange, B. 1999, A&A, 351, 869
- Fosbury et al. (2003) Fosbury, R. A. E., Villar-Martín, M., Humphrey, A., et al. 2003, ApJ, 596, 797
- Fumagalli et al. (2011) Fumagalli, M., da Silva, R. L., & Krumholz, M. R. 2011, ApJL, 741, L26
- Gabler et al. (1989) Gabler, R., Gabler, A., Kudritzki, R. P., Puls, J., & Pauldrach, A. 1989, A&A, 226, 162
- Gallerani et al. (2010) Gallerani, S., Maiolino, R., Juarez, Y., et al. 2010, A&A, 523, A85
- Garcia-Vargas et al. (1995) Garcia-Vargas, M. L., Bressan, A., & Diaz, A. I. 1995, A&AS, 112, 13
- Gilmore & Howell (1998) Gilmore, G. & Howell, D., eds. 1998, Astronomical Society of the Pacific Conference Series, Vol. 142, The Stellar Initial Mass Function (38th Herstmonceux Conference)
- Granato et al. (2000) Granato, G. L., Lacey, C. G., Silva, L., et al. 2000, ApJ, 542, 710
- Guseva et al. (2006) Guseva, N. G., Izotov, Y. I., & Thuan, T. X. 2006, ApJ, 644, 890
- Guseva et al. (2004) Guseva, N. G., Papaderos, P., Izotov, Y. I., Noeske, K. G., & Fricke, K. J. 2004, A&A, 421, 519
- Haiman (2002) Haiman, Z. 2002, ApJL, 576, L1
- Hainline et al. (2009) Hainline, K. N., Shapley, A. E., Kornei, K. A., et al. 2009, ApJ, 701, 52
- Hayes et al. (2011) Hayes, M., Schaerer, D., Östlin, G., et al. 2011, ApJ, 730, 8
- Hu et al. (1998) Hu, E. M., Cowie, L. L., & McMahon, R. G. 1998, ApJL, 502, L99+
- Hunt et al. (2008) Hunt, L. K., Madden, S., & Schneider, R., eds. 2008, IAU Symposium, Vol. 255, Low-Metallicity Star Formation: From the First Stars to Dwarf Galaxies
- Inoue (2011) Inoue, A. K. 2011, MNRAS, 415, 2920
- Izotov et al. (2001) Izotov, Y. I., Chaffee, F. H., & Schaerer, D. 2001, A&A, 378, L45
- Izotov et al. (1997) Izotov, Y. I., Lipovetsky, V. A., Chaffee, F. H., et al. 1997, ApJ, 476, 698
- Johnson et al. (2009) Johnson, J. L., Greif, T. H., Bromm, V., Klessen, R. S., & Ippolito, J. 2009, MNRAS, 399, 37
- Kehrig et al. (2011) Kehrig, C., Oey, M. S., Crowther, P. A., et al. 2011, A&A, 526, A128
- Kennicutt (1998) Kennicutt, Jr., R. C. 1998, ARA&A, 36, 189
- Kewley et al. (2001) Kewley, L. J., Dopita, M. A., Sutherland, R. S., Heisler, C. A., & Trevena, J. 2001, ApJ, 556, 121
- Khochfar & Silk (2011) Khochfar, S. & Silk, J. 2011, MNRAS, 410, L42
- Kroupa (2001) Kroupa, P. 2001, MNRAS, 322, 231
- Krtička & Kubát (2006) Krtička, J. & Kubát, J. 2006, A&A, 446, 1039
- Kudritzki (2002) Kudritzki, R. P. 2002, ApJ, 577, 389
- Larson (1998) Larson, R. B. 1998, MNRAS, 301, 569
- Larson & Tinsley (1978) Larson, R. B. & Tinsley, B. M. 1978, ApJ, 219, 46
- Lee et al. (2009a) Lee, J. C., Gil de Paz, A., Tremonti, C., et al. 2009a, ApJ, 706, 599
- Lee et al. (2009b) Lee, K.-S., Giavalisco, M., Conroy, C., et al. 2009b, ApJ, 695, 368
- Leitherer & Ekstrom (2011) Leitherer, C. & Ekstrom, S. 2011, ArXiv e-prints
- Leitherer et al. (1999) Leitherer, C., Schaerer, D., Goldader, J. D., et al. 1999, ApJS, 123, 3
- Lidman et al. (2012) Lidman, C., Hayes, M., Jones, D. H., et al. 2012, MNRAS, 2199
- Madau (1995) Madau, P. 1995, ApJ, 441, 18
- Maeder et al. (1999) Maeder, A., Grebel, E. K., & Mermilliod, J.-C. 1999, A&A, 346, 459
- Maeder & Meynet (1994) Maeder, A. & Meynet, G. 1994, A&A, 287, 803
- Maeder & Meynet (2000) Maeder, A. & Meynet, G. 2000, ARA&A, 38, 143
- Maeder & Meynet (2012) Maeder, A. & Meynet, G. 2012, Reviews of Modern Physics, 84, 25
- Malhotra & Rhoads (2002) Malhotra, S. & Rhoads, J. E. 2002, ApJL, 565, L71
- Maraston (2005) Maraston, C. 2005, MNRAS, 362, 799
- Maraston (2011a) Maraston, C. 2011a, in IAU Symposium, Vol. 277, IAU Symposium, ed. C. Carignan, F. Combes, & K. C. Freeman, 158–165
- Maraston (2011b) Maraston, C. 2011b, in Astronomical Society of the Pacific Conference Series, Vol. 445, Why Galaxies Care about AGB Stars II: Shining Examples and Common Inhabitants, ed. F. Kerschbaum, T. Lebzelter, & R. F. Wing, 391
- Maraston et al. (2006) Maraston, C., Daddi, E., Renzini, A., et al. 2006, ApJ, 652, 85
- Maraston et al. (2010) Maraston, C., Pforr, J., Renzini, A., et al. 2010, MNRAS, 407, 830
- Marigo et al. (2001) Marigo, P., Girardi, L., Chiosi, C., & Wood, P. R. 2001, A&A, 371, 152
- Mas-Hesse & Kunth (1991) Mas-Hesse, J. M. & Kunth, D. 1991, A&AS, 88, 399
- Massey (2003) Massey, P. 2003, ARA&A, 41, 15
- Meurer et al. (1999) Meurer, G. R., Heckman, T. M., & Calzetti, D. 1999, ApJ, 521, 64
- Meynet & Maeder (2005) Meynet, G. & Maeder, A. 2005, A&A, 429, 581
- Meynet et al. (1994) Meynet, G., Maeder, A., Schaller, G., Schaerer, D., & Charbonnel, C. 1994, A&AS, 103, 97
- Neufeld (1991) Neufeld, D. A. 1991, ApJL, 370, L85
- Oh et al. (2001) Oh, S. P., Haiman, Z., & Rees, M. J. 2001, ApJ, 553, 73
- Ono et al. (2010) Ono, Y., Ouchi, M., Shimasaku, K., et al. 2010, ApJ, 724, 1524
- Osterbrock & Ferland (2006) Osterbrock, D. E. & Ferland, G. J. 2006, Astrophysics of gaseous nebulae and active galactic nuclei
- Ouchi et al. (2008) Ouchi, M., Shimasaku, K., Akiyama, M., et al. 2008, ApJS, 176, 301
- Panagia (2005) Panagia, N. 2005, in Astrophysics and Space Science Library, Vol. 327, The Initial Mass Function 50 Years Later, ed. E. Corbelli, F. Palla, & H. Zinnecker, 479
- Papaderos et al. (2003) Papaderos, P., Izotov, Y. I., Noeske, K. G., et al. 2003, Ap&SS, 284, 619
- Papovich et al. (2011) Papovich, C., Finkelstein, S. L., Ferguson, H. C., Lotz, J. M., & Giavalisco, M. 2011, MNRAS, 412, 1123
- Partridge & Peebles (1967) Partridge, R. B. & Peebles, P. J. E. 1967, ApJ, 147, 868
- Pelló et al. (1999) Pelló, R., Kneib, J. P., Le Borgne, J. F., et al. 1999, A&A, 346, 359
- Pello & Schaerer (2003) Pello, R. & Schaerer, D. 2003, in Revista Mexicana de Astronomia y Astrofisica Conference Series, Vol. 16, Revista Mexicana de Astronomia y Astrofisica Conference Series, ed. J. M. Rodriguez Espinoza, F. Garzon Lopez, & V. Melo Martin, 225–228
- Pflamm-Altenburg et al. (2007) Pflamm-Altenburg, J., Weidner, C., & Kroupa, P. 2007, ApJ, 671, 1550
- Pindao et al. (2002) Pindao, M., Schaerer, D., González Delgado, R. M., & Stasińska, G. 2002, A&A, 394, 443
- Pozzetti & Mannucci (2000) Pozzetti, L. & Mannucci, F. 2000, MNRAS, 317, L17
- Raiter et al. (2010a) Raiter, A., Fosbury, R. A. E., & Teimoorinia, H. 2010a, A&A, 510, A109+
- Raiter et al. (2010b) Raiter, A., Schaerer, D., & Fosbury, R. A. E. 2010b, A&A, 523, A64
- Salpeter (1955) Salpeter, E. E. 1955, ApJ, 121, 161
- Schaerer (1996) Schaerer, D. 1996, ApJL, 467, L17
- Schaerer (2000) Schaerer, D. 2000, in Building Galaxies; from the Primordial Universe to the Present, ed. F. Hammer, T. X. Thuan, V. Cayatte, B. Guiderdoni, & J. T. Thanh Van , 389
- Schaerer (2002) Schaerer, D. 2002, A&A, 382, 28
- Schaerer (2003) Schaerer, D. 2003, A&A, 397, 527
- Schaerer (2007) Schaerer, D. 2007, ArXiv e-prints, 706
- Schaerer et al. (1999) Schaerer, D., Contini, T., & Pindao, M. 1999, A&AS, 136, 35
- Schaerer & de Barros (2009) Schaerer, D. & de Barros, S. 2009, A&A, 502, 423
- Schaerer & de Barros (2010) Schaerer, D. & de Barros, S. 2010, A&A, 515, A73+
- Schaerer & de Barros (2011) Schaerer, D. & de Barros, S. 2011, ArXiv e-prints
- Schaerer et al. (2011) Schaerer, D., de Barros, S., & Stark, D. P. 2011, A&A, 536, A72
- Schaerer & Pelló (2005) Schaerer, D. & Pelló, R. 2005, MNRAS, 362, 1054
- Schaerer & Vacca (1998) Schaerer, D. & Vacca, W. D. 1998, ApJ, 497, 618
- Schaller et al. (1992) Schaller, G., Schaerer, D., Meynet, G., & Maeder, A. 1992, A&AS, 96, 269
- Schneider et al. (2002) Schneider, R., Ferrara, A., Natarajan, P., & Omukai, K. 2002, ApJ, 571, 30
- Schneider et al. (2003) Schneider, R., Ferrara, A., Salvaterra, R., Omukai, K., & Bromm, V. 2003, Nature, 422, 869
- Shapley et al. (2003) Shapley, A. E., Steidel, C. C., Pettini, M., & Adelberger, K. L. 2003, ApJ, 588, 65
- Shirazi & Brinchmann (2012) Shirazi, M. & Brinchmann, J. 2012, ArXiv e-prints
- Smith et al. (2002) Smith, L. J., Norris, R. P. F., & Crowther, P. A. 2002, MNRAS, 337, 1309
- Stasińska & Leitherer (1996) Stasińska, G. & Leitherer, C. 1996, ApJS, 107, 661
- Stasińska et al. (2001) Stasińska, G., Schaerer, D., & Leitherer, C. 2001, A&A, 370, 1
- Stasińska & Tylenda (1986) Stasińska, G. & Tylenda, R. 1986, A&A, 155, 137
- Thuan et al. (2004) Thuan, T. X., Bauer, F. E., Papaderos, P., & Izotov, Y. I. 2004, ApJ, 606, 213
- Tinsley (1968) Tinsley, B. M. 1968, ApJ, 151, 547
- Tinsley (1980) Tinsley, B. M. 1980, Fundamentals of Cosmic Physics, 5, 287
- Treyer et al. (2011) Treyer, M., Wyder, T., Neill, J., Seibert, M., & Lee, J., eds. 2011, Astronomical Society of the Pacific Conference Series, Vol. 440, UP2010: Have Observations Revealed a Variable Upper End of the Initial Mass Function?
- Tumlinson (2006) Tumlinson, J. 2006, ApJ, 641, 1
- Tumlinson et al. (2001) Tumlinson, J., Giroux, M. L., & Shull, J. M. 2001, ApJL, 550, L1
- Tumlinson & Shull (2000) Tumlinson, J. & Shull, J. M. 2000, ApJL, 528, L65
- Vanbeveren et al. (1998) Vanbeveren, D., De Donder, E., van Bever, J., van Rensbergen, W., & De Loore, C. 1998, New Astronomy, 3, 443
- Vanzella et al. (2010) Vanzella, E., Grazian, A., Hayes, M., et al. 2010, A&A, 513, A20
- Vanzi et al. (2002) Vanzi, L., Hunt, L. K., & Thuan, T. X. 2002, A&A, 390, 481
- Vázquez et al. (2007) Vázquez, G. A., Leitherer, C., Schaerer, D., Meynet, G., & Maeder, A. 2007, ApJ, 663, 995
- Veilleux & Osterbrock (1987) Veilleux, S. & Osterbrock, D. E. 1987, ApJS, 63, 295
- Weidner & Kroupa (2006) Weidner, C. & Kroupa, P. 2006, MNRAS, 365, 1333
- Whalen et al. (2010) Whalen, D. J., Bromm, V., & Yoshida, N., eds. 2010, American Institute of Physics Conference Series, Vol. 1294, THE FIRST STARS AND GALAXIES: CHALLENGES FOR THE NEXT DECADE
- Wuyts et al. (2011) Wuyts, S., Förster Schreiber, N. M., Lutz, D., et al. 2011, ApJ, 738, 106
- Yoon et al. (2012) Yoon, S.-C., Dierks, A., & Langer, N. 2012, ArXiv e-prints
- Yoshikawa et al. (2010) Yoshikawa, T., Akiyama, M., Kajisawa, M., et al. 2010, ApJ, 718, 112
- Zackrisson et al. (2008) Zackrisson, E., Bergvall, N., & Leitet, E. 2008, ApJL, 676, L9
- Zackrisson et al. (2011a) Zackrisson, E., Inoue, A. K., Rydberg, C.-E., & Duval, F. 2011a, MNRAS, 418, L104
- Zackrisson et al. (2011b) Zackrisson, E., Rydberg, C.-E., Schaerer, D., Östlin, G., & Tuli, M. 2011b, ApJ, 740, 13