Characterizing the nature of Fossil Groups with XMM
Abstract
We present an X-ray follow-up, based on XMM plus Chandra, of six Fossil Group (FG) candidates identified in our previous work using SDSS and RASS data. Four candidates (out of six) exhibit extended X-ray emission, confirming them as true FGs. For the other two groups, the RASS emission has its origin as either an optically dull/X-ray bright AGN, or the blending of distinct X-ray sources. Using SDSS-DR7 data, we confirm, for all groups, the presence of an r-band magnitude gap between the seed elliptical and the second-rank galaxy. However, the gap value depends, up to mag, on how one estimates the seed galaxy total flux, which is greatly underestimated when using SDSS (relative to Sersic) magnitudes. This implies that many FGs may be actually missed when using SDSS data, a fact that should be carefully taken into account when comparing the observed number densities of FGs to the expectations from cosmological simulations. The similarity in the properties of seed–FG and non-fossil ellipticals, found in our previous study, extends to the sample of X-ray confirmed FGs, indicating that bright ellipticals in FGs do not represent a distinct population of galaxies. For one system, we also find that the velocity distribution of faint galaxies is bimodal, possibly showing that the system formed through the merging of two groups. This undermines the idea that all selected FGs form a population of true fossils.
keywords:
galaxies: formation – evolution – X-rays: galaxies: clusters – galaxies: groups: general1 Introduction
In the late eighties, Barnes (1989), using simulations, realized that a merging of a compact group of galaxies forms an elliptical galaxy over a short fraction of the Hubble time and the end product resembles a field elliptical. Later, Ponman & Betram (1993) studying HCG 62 has concluded that compact groups result from orbital decay of galaxies into an extended dark matter halo and the final system, a fossil group, would be a massive elliptical immersed in an extended halo of hot gas. The discovery of such a system by Ponman et al. (1994) rendered trustable the whole picture.
Operationally, FGs are systems exhibiting extended X-ray emission with L and the difference in magnitudes between the fossil galaxy and the second brightest in the group, , equals 2.0, in R-band (see La Barbera et al. 2009 for a discussion on this threshold limit). Only galaxies picked within a radius equal to half of the virial radius are considered. Several FG samples have been defined in the redshift range 0 z 0.6 (Vikhlinin et al. 1999; Romer et al. 2000; Jones et al. 2003; Ulmer et al. 2005: Santos et al. 2007; La Barbera et al. 2009; Voevodkin et al. 2010; Aguerri et al. 2011; Miller et al. 2011). Although the data on these systems is growing fast, their origin is still debatable. Dariush et al. (2007) used the Millennium Simulation to show how FGs assembled their dark matter halos. They find that FGs have already their mass in place by z1 while their non-FG systems are still accreting mass today. So, in this case non-FGs form later which is corroborated by the work of D’Onghia et al. (2005). This seems to be a possible alternative to the compact group merging scenario (Barnes 1989). However, La Barbera et al. (2009), examining a sample of 25 FGs and a similar control sample of non-FGs at z0.1, find no difference between structural and stellar population properties of FGs and non-FGs, suggesting that FGs may just represent a transient phase of mass assembly in the Universe. In fact, as shown by simulations, galaxy groups may undergo through a “fossil phase”, a stage characterized by a large magnitude gap, terminated by the infall of fresh galaxies from the surroundings (von Benda-Beckmann et al., 2008).
In this work, we study 6 FG candidates from our previous work (La Barbera et al.2009; hereafter LdC09), using dedicated XMM, and archival Chandra X-ray observations. This allows us to (i) assess the success rate of finding true FGs by combining SDSS and RASS data (as in LdC09); and (ii) highlight some important pitfalls in the approaches commonly used to search for FGs. We revisit the issue of the similarity between seed ellipticals of FGs and non-fossil galaxies using all the available data for these systems, namely, the density excess of neighbouring faint galaxies, distance from the red sequence in the color–magnitude diagram, structural parameters such as (parametrizing the deviation of galaxy isophotes from the elliptical shape, see e.g. Bender & Möllenhoff 1987) and internal color gradients, ages, metallicities, and -enhancement. All these informations with the X-ray properties, for the first time presented here, form the basic data set used in the analysis.
This manuscript is organized as follows: Section 2, discusses how the sample of FG candidates was selected; Section 3 presents the new XMM observations, data reduction and how the X-ray analysis was conducted; In Section 4 we discuss the main pitfalls of the optical definition of an FG, while in Section 5 we analyze the velocity distribution of group galaxies for the X-ray confirmed FGs; Section 6 deals with the number density of FGs, and the comparison of the properties of fossil and non-fossil galaxies. In Section 7 we summarize the main findings of this contribution. Throughout the paper, we adopt the cosmology , , .
2 The Sample
The sample of six FG candidates studied here was taken from LdC09, where we have defined a sample of 29 nearby () FG candidates, by combining SDSS and RASS data. The selection of FG candidates was based on the volume-complete catalogue of all galaxies with r-band magnitude and spectroscopic redshift between and from SDSS-DR4. We defined as FGs those elliptical galaxies with no companion brighter than a given magnitude gap, , within a maximum projected radius, , and within a maximum redshift difference, . As a compromise between the number of selected FG candidates and that of false FG detections, we set , , and . We notice that these criteria are not the same as those of , and proposed, on a qualitative basis, by Jones et al. 2003 (hereafter J03), and widely adopted in the literature (but see, for instance, Voevodkin et al. 2010). We revisit this issue in Sec. 4. We excluded galaxies with AGN signatures in the optical spectra, and those close (within ) to a rich cluster. Finally, we chose only the 29 systems with significant X-ray emission from the RASS, 25 of which being classified as extended relative to the RASS PSF. All systems turned out to have X-ray luminosity larger than , i.e., the J03 threshold to qualify a system as an FG. We have started a program to observe the 29 FG candidates of LdC09 with XMM, to better characterize their X-ray emission. Because of the low S/N and angular resolution of the RASS, the X-ray emission of each system requires confirmation through dedicated follow-up observations. In the present work, we analyze data for six candidates, five of which classified as X-ray extended by LdC09 (i.e. FG1, FG3, FG4, FG12, FG14), and the remaining one (FG27) uncertain. Throughout the paper, FG candidates are indicated with the same ID number as in LdC09 (see their table 2). We also compare the properties of seed ellipticals in the four (out of six) confirmed FGs with those of non-fossil ellipticals. To this effect we select the 15 “field” ellipticals brighter than (i.e. the faint magnitude limit of seed ellipticals in our sample of confirmed FGs), out of the list of 66 “field” galaxies with significant X-ray emission presented by LdC09. We notice that 7 (out of 29) FG candidates in LdC09 have seed ellipticals brighter than , making the present sample of confirmed FGs representative (although small) of the brightest seed population of FGs.
3 X-ray data
3.1 Observations and data reduction
Only 2 out of 29 FG candidates from LdC09 had archival, good-resolution ( FWHM PSF) X-ray observations. In Cycle 8, we submitted an XMM proposal to get X-ray data for the remaining FGs. The proposal was approved with priority , allowing us to gather data for four more candidates. In Table 1 we present the final list of the available archival and proprietary observations. The proprietary data were obtained by the EPIC camera on board of XMM between September and December 2009 (PI M.Paolillo). Since the observations were scheduled with C priority, the actual observing times exceeded by a factor of the requested one. However, several of our observations were affected by strong flares, reducing the actual useful data.
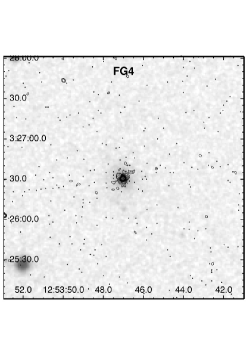
The XMM data (including archival ones) were reduced and calibrated with the standard SAS software v10.0.0; to maximize the S/N of the data we removed periods affected by very strong flares. Sometimes, where flares affected the whole observation, we retained the data sections were flares were less severe (see Table 1). While in such cases the data quality is far from being optimal, it allowed us to investigate the FG nature of our targets (see below). For FG4, the inspection of the standard Chandra pipeline products clearly showed that the X-ray emission is resulting from a point-like source, and no additional reduction was performed.
| id | RA, Dec | Obs.date | Total Exp.time | Removed flaring | Obs.id. |
|---|---|---|---|---|---|
| (ks) | fraction | (XMM/Chandra) | |||
| FG1 | 13:09:19 –01:37:21 | 2005-06-18 | 16.9 | 40% | XMM-0201750201 |
| FG3 | 07:55:44 +41:12:14 | 2009-10-04 | 16.4 | 35% | XMM-0605391601 |
| FG4 | 12:53:47 +03:26:30 | 2007-03-04 | 8.1 | – | Chandra-8247 |
| FG12 | 12:46:51 +00:17:49 | 2009-12-21 | 9.9 | 10% | XMM-0605390501 |
| FG14 | 07:51:58 +20:44:56 | 2009-09-30 | 18.9 | 5% | XMM-0605391501 |
| FG27 | 01:20:23 –00:04:44 | 2009-12-26 | 7.8 | 5% | XMM-0605391101 |
3.2 X-ray analysis
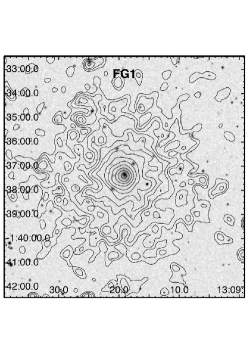
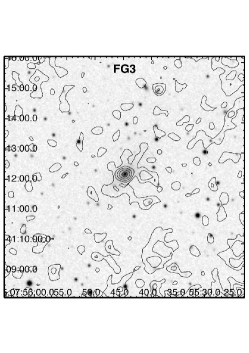
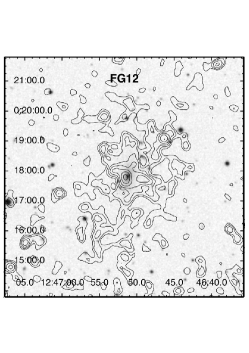
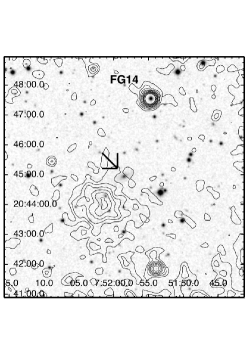
As a first step in confirming the FG nature of our candidate groups, we extracted X-ray images in the 0.5-2 keV band, where the thermal emission resulting from the diffuse plasma is expected to peak, for all sources imaged by XMM. To this end, we combined the MOS1 and MOS2 detectors. The PN camera was not used since it is generally characterized by a higher background level (especially during flaring events) and often the inter-chip gap falls close to our targets, making an assessment of the source extension more complex. In all cases, however, the results of the PN camera agreed with those derived from the MOS detectors, although with a lower S/N. The images of our targets are shown in Figure 1.
The images clearly reveal the extended nature of the X-ray emission in FG1, FG12, and FG27. FG3 is fainter and, while the data suggest the presence of extended emission, a nuclear component may account for part of the X-ray flux 111However, as discussed in our previous work (La Barbera et al., 2009), this system shows no AGN signature in the optical spectrum of its seed galaxy.. We also point out that the X-ray extension parameter reported in Tab. 2 is actually a lower limit, considering the relatively high background of the XMM data. FG14 represents a unique case, where there is indeed extended X-ray emission, but the X-ray centroid is clearly offset from the early-type seed galaxy of the FG candidate. In fact, the X-ray centroid is centered on a background cluster, FSVS_CL J075202+204352 at (Söchting et al., 2006), and is almost certainly associated with the latter. The X-ray emission detected in La Barbera et al. (2009) is very likely because of a combination of the background cluster and two additional bright AGNs, visible to the north and south of our target early-type galaxy.
As mentioned in 3.1, FG4 only has Chandra data. In such case the inspection of the pipeline standard products clearly shows that most of the emission is produced by a nuclear point-like source within the galaxy core; i.e., an AGN, with no residual extended emission detectable in the galaxy outskirts. Since the selection of FG candidates by LdC09 was performed by excluding galaxies with AGN signatures in the optical spectra, based on Baldwin, Phillips, Terlevich (1981) diagnostic diagrams, we conclude that FG4 is one of the rare cases of optically dull/X-ray bright AGNs, expected to be present in of our targets (see e.g. Anderson et al., 2007; Tozzi et al., 2006).
| id | redshift | model | kT | L | extension | ||
|---|---|---|---|---|---|---|---|
| (keV) | ( cm-2) | () | ( erg s-1) | (kpc) | |||
| FG1 | Mekal | ||||||
| FG3 | Mekal | [] | |||||
| FG4 | – | – | – | – | pointlike | ||
| FG12 | Mekal | ||||||
| FG14 | – | – | – | – | – | – | |
| FG27 | Mekal |
The extension parameter refers to the maximum distance out to which we could detect X-ray emission. For FG3 we are using EPIC-M1 derived values since this detector has the best S/N. Values between brackets were held fixed in the fit. FG4 and FG14 were not fitted since there is no detectable hot ISM emission.
For the FG candidates with detectable extended emission, we extracted spectra from the 3 XMM detectors within 200 kpc, and did a spectral fit using the XSpec v12.6 package. FG 4 and FG14 were not analyzed since, as discussed above, there is no evidence of thermal plasma filling the FG potential well. We used a Mekal (Mewe et al., 1985; Liedahl et al., 1995) plus photoelectric absorption spectral model, obtaining the estimates of the hot ISM parameters reported in Table 2. The measured X-ray temperatures and metallicities are in agreement with those expected in galaxy groups and clusters, while the hydrogen column density is mostly consistent with the galactic value (see, e.g., Johnson et al. 2009; Rasmussen & Ponman 2007; Mulchaey 2000 and references therein); additional absorption may be present only in FG3, but here the uncertainties are so large (due to the low fluxes and large background contamination) that we do not consider this conclusive evidence of intrinsic absorption in this system. While a simple one–temperature plasma model may yield sub-solar abundances, we point out that the derived parameters are not unusual for galaxy groups. Moreover, multi-temperature fits are difficult given the low statistics and yield consistent (although very uncertain) results to those presented here.
In comparing our results with the X-ray luminosity threshold of adopted by Jones et al. (2003) to define an FG, we need to transform the – keV band into bolometric luminosities. The conversion factors lie in the range for the different groups. Hence, we find that 3 of our targets (FG1, FG12, and FG27) have luminosities in excess of the threshold at more than level. For FG3, the is still above the threshold, but only at the level. Finally, we can disprove the FG nature of FG4 and FG14, since they have no extended X-ray emission.
4 Fossilness criteria
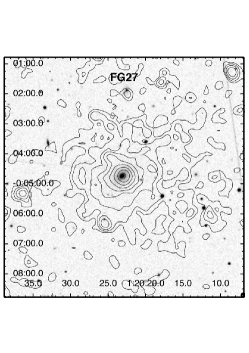
In this Section, we discuss if our X-ray confirmed FGs follow the fossilness criteria of J03, where FGs were defined as systems having a bright E galaxy, with no companion fainter than in R-band within , where is the virial radius of the group. Fig. 2 shows the radial and velocity offsets, and , as a function of the magnitude difference, – all these quantities being computed the seed elliptical – for all galaxies in a region of radius around each FG 222The radius of corresponds to at (i.e. the median redshift of the FG sample).. Filled circles correspond to galaxies with spectroscopic redshift available from SDSS, within 333 These galaxies are likely associated to the FGs, considering that in each field of view there are many objects within but no galaxies in the range of . to the seed elliptical, while empty circles are galaxies with no spectra from SDSS. Dotted (dashed) rectangles correspond to the criteria of J03 (LdC09) to define an FG. The radius of has been estimated as in J03, converting the X-ray temperature of a given FG (from Tab. 2) into , by using the relationship between X-ray temperature and virial radius of Evrard, Metzler, & Navarro (1996). We point out that the radial distances shown in Fig. 2 () are larger that the distances where we could detect the XMM emission, this being in the range of (FG3) to (FG1) of the virial radii.
For all four systems, no galaxy is found within the dashed regions, i.e. the systems are certainly fossils based on the and criteria of LdC09 (see Sec. 2). Notice that this is not a trivial result, as in LdC09, with the aim of minimizing the fraction of FG detections by chance, we searched for fossil systems by considering only galaxies within to the seed galaxy. Two groups (FG3 and FG12) can be classified as fossils also based on the J03 criteria (as there is no companion galaxy within the corresponding dotted regions in Fig. 2). FG27 would be still classified as fossil within , if we slightly relax the criterium ( instead of mags), while for FG1 four galaxies (two of which having SDSS spectroscopy) would invalidate the J03 definition of an FG. However, one should notice that to date there is no objective definition of what an FG is, and different criteria can lead to different samples of FGs (as discussed, e.g., by Voevodkin et al. 2010). For instance, the criteria of LdC09 have been introduced to minimize the number of spurious (relative to genuine) FG detections from SDSS data, while the criteria of J03 are based on (rather qualitative) physical arguments, e.g. the fact that the maximum observed magnitude gap of galaxy groups is rarely larger than – and is approximately the radius within which orbital decay by dynamical friction predicts that galaxies will fall into the center of a group within an Hubble time (assuming a given galaxy ratio). Moreover, one should notice that classifying a group as fossil may depend on how one estimates galaxy magnitudes (Voevodkin et al., 2010), as some galaxies may enter/exit the magnitude gap depending the way their magnitude is estimated.
To analyze this issue, we have selected, for each FG, all galaxies with a (Petrosian) magnitude 444We use Petrosian magnitudes as they provide the best proxy to the total flux of a galaxy. However, using model magnitudes would not change at all the results presented here. gap ( the seed E) of mags, and within Mpc to the position of the seed galaxies. We reprocessed all these galaxies with the software 2DPHOT (La Barbera et al., 2008), fitting galaxy images with 2D seeing-convolved Sersic models. Red crosses in Fig. 2 show how the – diagram changes when using Sersic, rather than Petrosian (i.e. SDSS), magnitudes. Interestingly, using Sersic fitting changes dramatically the – plot, making all four systems to be classified as fossils, despite the set of criteria (J03 vs. LdC09) used. This is due to the fact that bright ellipticals, like the FG seed galaxies, are described by a high Sersic profile, for which Petrosian magnitudes tend to underestimate significantly the total flux (see, e,g., Graham et al. 2005). Since this effect is less pronounced for fainter galaxies (having lower , because of the luminosity– relation), using Petrosian (rather than Sersic) magnitudes tends to decrease the magnitude gap, hence, decreasing the number of systems classified as fossils. While this exercise shows that at least three of the four groups considered here (FG3, FG12, and FG27) can be robustly classified as fossils (i.e. independent of the fossilness criteria and magnitude gap definition), it also suggests that many FGs may be actually being missed by currently available catalogs of FG candidates from SDSS (e.g. LdC09, Santos et al. 2007), which are based on Petrosian/model magnitudes to establish the magnitude gap (see also Harrison et al. 2012).
Recently, Dariush et al. (2010) (hereafter DRP10) suggested that 14, i.e. the magnitude difference between the first- and fourth-rank group galaxy within , is a more effective parameter to pick-up early-formed systems in the Millenium simulation than 12 (i.e. in our notation above). A criterium of would allow one to select more groups with early-assembly epoch than . From an observation viewpoint, as seen in the lower panels of Fig. 2, computing 14 is not trivial, as the chance of finding galaxies without redshift from SDSS is larger when computing 14 than 12. For FG27, we see that 14 is , independent of the magnitudes one adopts (Petrosian vs. Sersic). For FG12, there are two galaxies without redshift from SDSS that can significantly affect the estimate of 14, changing it from to when considering or not the two galaxies as group members. The same happens for FG3, while for FG1 one can notice that using Petrosian magnitudes gives , while Sersic magnitudes would imply . In essence, one system (FG27) fulfills the 14 criterium introduced by DRP10, while for the other three groups the computation of 14 is hampered by the SDSS spectroscopic incompleteness as well as the issue of how one estimates the total flux of the FG seed elliptical.
5 Velocity distribution of FG galaxies
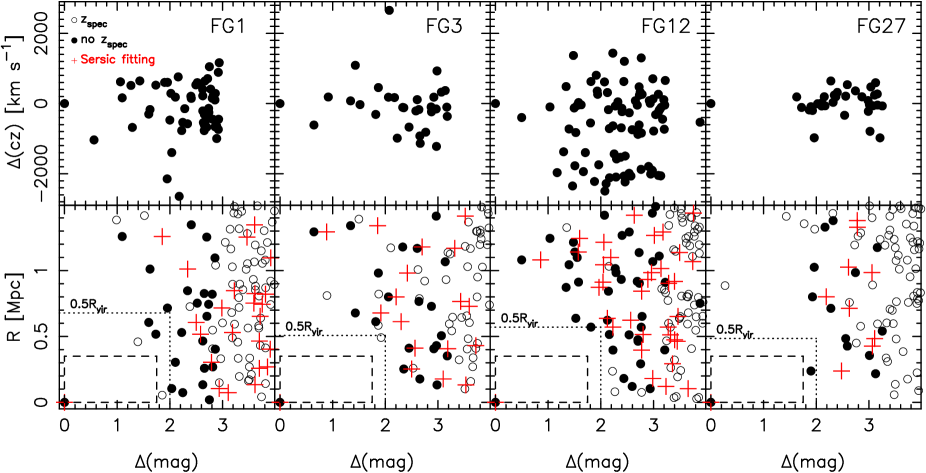
The upper panels of Fig. 2 show that for each FG there are many galaxies with spectroscopic redshift close to the redshift of the seed elliptical (within and within a radius of Mpc). Using the bi-weight statistics (Beers, Flynn, Gebhardt, 1990), we estimate a velocity dispersion (within Mpc) of (FG1), (FG3), (FG12), and (FG27), where uncertainties are estimated through bootstrap estimates of . For FG12, the velocity offset distribution suggests that the system has complex dynamics, as testified by the high estimate, with some galaxies having velocity offsets within , and the remaining galaxies being below . This is quite surprising, considering that FGs are expected to be evolved systems that assembled a large fraction of their mass at high redshift (e.g. D’Onghia et al. 2005; Dariush et al. 2007, 2010). Interestingly, a bimodal velocity distribution for a (non-fossil) galaxy group () has also been detected by Rasmussen et al. (2006). The authors associated the bimodal behaviour of the velocity distribution to the merging of two subgroups, but found no convincing evidence that the velocity substructures had any spatial segregation on the sky. Fig. 3 plots the spatial distribution of galaxies in the field-of-view around FG12, within a distance of Mpc to the seed galaxy, and absolute velocity offset . Galaxies with (filled circles) define the main body of the structure, with a velocity dispersion of and a remarkably elongated shape, aligned to the X-ray halo (see Fig. 1). On the other hand, galaxies with (empty circles) are preferentially located outside the main body of the structure, with a small aggregation at deg and deg, in the orthogonal direction the elongation of the main structure 555Selecting only the six galaxies that define the small clump at deg and deg, we find a velocity dispersion of –, i.e. significantly smaller than that of the main structure.. We suggest that FG12 might be the result of the collision of two groups of galaxies that triggered the merging of galaxies, leading to the formation of the FG seed elliptical. Hence, the faint galaxies we see at as well as the small clump at deg and deg would be just the relics of such collision. The complex velocity distribution of this system as well as its elongated shape reveals that not all the FGs are true fossils, as commonly believed.
In order to assess how frequent systems like FG12 are, we have used the group/cluster sample defined by La Barbera et al. (2011), selecting a well controlled subsample of 82 groups with similar mass (0.6 10) and redshift () as for FG12. The mass for FG12 was estimated based on the X-ray luminosity listed in Tab. 2 and the scaling relation presented in Lopes et al (2009). We quantified the frequency of systems like FG12 using the code (using the R language and environment – R development Core Team), which finds the number of significant and independent modes in the velocity distribution. From the control sample of 82 groups, we find that only 12 (15%) exhibit a second component in the velocity distribution as important as in FG12. The importance of the second component was measured as the relative number of galaxies in the second mode the number of galaxies in the main component (i.e. the one with largest number of galaxies) that represents the group. This can be done because we are measuring the number of galaxies down to the same limiting magnitude and within 2.5 Mpc from the center for all systems. If we further restrict to groups whose two components have a redshift difference , which is the value for FG12, then we reduce to 4 groups (). Considering that FG12 is the only of its kind out of 4 FGs (), and that in our control sample we find only , or maximum 15%, it seems that the dynamical status of FG12 is truly linked to its ”fossilness“, namely the merging of two groups causes the magnitude gap, contaminating a true sample of fossil systems. A larger sample of FGs is of paramount importance to establish the importance of such effect though 666In a forthcoming contribution, we plan to investigate in more detail the merging hypothesis by studying the properties of the galaxy population of FG12.

6 Comparison to the findings of LdC09
6.1 Number density of FGs
In LdC09 we defined a sample of FG candidates, being classified as X-ray extended according to RASS data, and the remaining being uncertain, having an X-ray extension consistent with that of the RASS PSF. With XMM, we have observed one of the uncertain systems (), concluding that, indeed, this is a true FG. Therefore, we recompute here the number density estimate of FGs using all the candidates selected in our previous work. Based on the XMM plus Chandra data, we estimate the success rate of finding true FGs as (confirmed)/(observed). At , where the sample of LdC09 is reasonably (X-ray) complete (as one can see by considering the distribution of FG candidates from LdC09; see panel (b) of their fig. 11), we previously found 21 (out of 29) FG candidates over the sky area of SDSS-DR4 ( square degrees) in the redshift range , implying an FG number density of . Multiplying this estimate by , we obtain a corrected number density 777This figure assumes that is independent of . Whilst this might not be the case, our number of confirmed FGs is still too small to assess this issue. of . Given an uncertainty of in the success rate (assuming binomial statistics for , see Cameron 2011), this density estimate turns out to be significantly smaller wrt that found by Vikhlinin et al. (1999) () but fully consistent with the expectation from cosmological simulations 888Based on simulations, several studies have estimated the expected number density of fossil-like systems, finding large discrepancies (see Milosavljević et al. 2006; Sales et al. 2007; van den Bosch et al. 2007). In contrast to Dariush et al. (2007), these studies analyze optically-defined fossil systems, preventing a direct comparison to our number density estimate. of Dariush et al. (2007) (). We remark, however, that the sample of FGs we have confirmed so far is still small. Moreover, current FG samples may be missing a significant number of systems, because of the way the magnitude gap is characterized (see Sec. 4).
6.2 Properties of fossil vs. non-fossil ellipticals
In LdC09, we have compared several properties of FG seed ellipticals with those of non-fossil galaxies, finding no significant difference between these two populations. This result applies to the 25 FG candidates classified as X-ray extended based on RASS data. As shown in the present paper, only some of these systems are true fossils, which could invalidate our previous results. To address this issue, we compare here the average properties of brightest galaxies in the four confirmed FGs with those of 15 non-fossil ellipticals selected from the sample of LdC09 (see Sec. 2). We consider the main galaxy properties analyzed by LdC09, i.e. color indices, density excess of faint companions around each seed/non-fossil galaxy, effective radii and Sersic indices 999Reprocessing the SDSS images of FG galaxies (see Sec. 4), we found that we previously underestimated the Sersic (effective radius) of the FG1 seed E by ( dex). For a more direct comparison with our previous study, we use here the values of and presented in tab. 2 of LdC09, but we verified that none of the present conclusions would be altered by updating the structural parameters. (in g- and r-band), isophotal parameter shape (), internal optical color gradients (), offset from the color–magnitude relation, central velocity dispersion, as well as stellar population parameters (age, metallicity, /Fe abundance ratio) computed within the SDSS fiber aperture. For non-fossil galaxies, these quantities are reported in Tab. 3, while all properties of FG ellipticals are reported in tab. 2 of LdC09. Tab. 4 compares the median values of all relevant galaxy properties between the two samples. On average, we do not find any significant difference, although, admittedly, our sample of confirmed FGs is still small. We also list the p-value for the two sample t-test using a permutation test ( in R Language), which indicates when two quantities can be drawn from the same parent population. As one can see from the Table, only , the offset from the color-magnitude relation, shows a tendency to be different between FGs and non-fossil ellipticals. Interestingly, although the sample of non-fossil galaxies is four times larger than that of fossils, the error on the median value of some galaxy properties (in particular, and ) is larger for non-fossils, reflecting a larger scatter ( fossils) in the distributions of these properties. The same result was also reported by LdC09 and indicates that the formation of non-fossil ellipticals is more heterogeneous than that of fossils, i.e. might involve a wider range of physical processes (e.g. both dry and gas-rich mergers). This result seems consistent with the lack of star-forming (satellite) galaxies in FGs, as recently found by Pierini et al. (2011). Still in agreement with LdC09, we find that fossil E’s have on average boxy isophotal shape (i.e. ), with FG1 being the only case with (disky isophotes). As already noticed by LdC09, this result contrasts to that of Khosroshahi et al. (2006) who found first-rank galaxies of FGs to have preferentially disky isophotes, pointing to gas-rich mergers as the driving mechanism of their formation. On the other hand, Mendez-Abreu et al. (2011) have recently argued that dry mergers are the main drivers of the formation and subsequent evolution of seed E’s in FGs (see also Mendes de Oliveira et al. 2009), as also suggested by cosmological simulations (Díaz-Giménez, Muriel, Mendes de Oliveira, 2008), more consistent with our findings.
The result that fossil and (some) non-fossil ellipticals have, on average, similar (structural and stellar population) properties supports a scenario whereby fossils are just a transient phase in the life of galaxy groups (von Benda-Beckmann et al., 2008), and can be due to the fact that the magnitude gap allows one to pick up only a minority of the early-formed systems (DRP10).
| seed ETGs | non-FG ETGs | p-value | |
|---|---|---|---|
7 Summary
We have presented X-ray data for six FG candidates defined in our previous work as systems with significant magnitude gap, in the optical, between first- and second-rank galaxies, as well as significant X-ray emission from RASS. We confirm 4 out of 6 groups as true FGs, with extended X-ray emission and luminosity –, implying a success rate of when searching for these systems with SDSS+RASS. Contamination mainly comes from optically dull/X-ray bright AGNs (expected to be ), or blending of different X-ray sources around the target elliptical.
We analyze the distribution of galaxies around each confirmed FG, and compare the properties of (confirmed) fossil and non-fossil ellipticals selected from our previous work (LdC09). The main results are the following:
- -
-
For all systems, we find many galaxies with SDSS spectroscopic redshift close to that of the seed elliptical, within a maximum distance of Mpc. The velocity dispersion of FGs ranges from to .
- -
-
All FGs exhibit a clear magnitude gap, , within a maximum radius, , from the seed galaxy. However, the values of and critically depend on how the total flux of the seed galaxy is estimated. Being bright ellipticals, seed galaxies have a surface brightness distribution well described by a Sersic profile with high (), implying that Petro/model magnitudes from SDSS tend to underestimate their total flux (by mag), and hence the magnitude gap. Considering that most works use a sharp value of (typically mags) to search for FGs, our finding means that current SDSS-based samples may actually miss a significant fraction of FGs. In particular, using and SDSS magnitudes, we would lack – systems, i.e. –, out of 4 FGs in our sample. This effect should be taken into account when comparing FG number densities to the expectations of cosmological simulations, potentially unaffected by such bias.
- -
-
We restrict the comparison of properties of seed–FG and non-fossil ellipticals to the sample of X-ray confirmed systems, finding no significant difference between the two populations, in agreement with LdC09. The only remarkable feature is the larger scatter of non-fossil (relative to fossil) galaxies for some properties (i.e. internal color gradients and isophotal shape parameter). We do not find FG ellipticals to have preferentially disky isophotes, i.e., they do not form preferentially through gas-rich mergers, as previously claimed in the literature.
- -
- -
-
Lastly, we find that galaxies around one of the X-ray confirmed FGs (FG12) shows a remarkably complex velocity distribution. Most galaxies have velocities within to the seed elliptical, defining a clearly elongated spatial distribution, approximately parallel to the X-ray emission. A secondary group of galaxies has average velocity offset of about to the seed. They are located more than Mpc () far from the main structure, with a clumpy spatial distribution. We argue that FG12 might be the result of the merging of two groups, that triggered the merging of galaxies, leading to the formation of the seed elliptical. This suggests that not all FGs are truly fossils, as commonly thought.
The present work points to the importance of next generation wide-area X-ray telescopes, such as eRosita (Cappelluti et al. 2011) and WFXT (Rosati et al.2011), to obtain large samples of FGs, allowing a robust comparison with predictions from cosmological simulations.
Acknowledgments
We are thankful to A. Dariush, E. D’Onghia, and A. Finoguenov for helpful comments and suggestions. MP and FLB acknowledge support from the ASI-INAF contract I/009/10/0. MP also acknowledges support from MIUR PRIN-2009. This paper uses data of SDSS-DR7. Funding for the SDSS and SDSS-II has been provided by the Alfred P. Sloan Foundation, the Participating Institutions, the National Science Foundation, the U.S. Department of Energy, the National Aeronautics and Space Administration, the Japanese Monbukagakusho, the Max Planck Society, and the Higher Education Funding Council for England. The SDSS Web Site is http://www.sdss.org/. The SDSS is managed by the Astrophysical Research Consortium for the Participating Institutions. The Participating Institutions are the American Museum of Natural History, Astrophysical Institute Potsdam, University of Basel, University of Cambridge, Case Western Reserve University, University of Chicago, Drexel University, Fermilab, the Institute for Advanced Study, the Japan Participation Group, Johns Hopkins University, the Joint Institute for Nuclear Astrophysics, the Kavli Institute for Particle Astrophysics and Cosmology, the Korean Scientist Group, the Chinese Academy of Sciences (LAMOST), Los Alamos National Laboratory, the Max-Planck-Institute for Astronomy (MPIA), the Max-Planck-Institute for Astrophysics (MPA), New Mexico State University, Ohio State University, University of Pittsburgh, University of Portsmouth, Princeton University, the United States Naval Observatory, and the University of Washington.
References
- Aguerri et al. (2011) Aguerri, J.A.L, et al., 2011, A&A, 527, 143
- Anderson et al. (2007) Anderson, S. F., et al. 2007, AJ, 133, 313
- Baldwin, Phillips, Terlevich (1981) Baldwin, J.A., Phillips, M.M., Terlevich, R., 1981, PASP, 93, 5
- Barnes (1989) Barnes, J.E. 1989, Nature, 338, 123
- Beers, Flynn, Gebhardt (1990) Beers, T.C., Flynn, K., Gebhardt, K., 1990, AJ, 100, 32
- Bender & Möllenhoff (1987) Bender, R., & Möllenhoff, C. 1987, A&A, 177, 71
- Cameron (2011) Cameron, E., 2011, PASA, 28, 128
- Cappelluti et al. (2011) Cappelluti, N., Predehl, P., Böhringer, H., et al., 2011, Memorie della Societa Astronomica Italiana Supplementi, 17, 159, Supplementi, 17, 8
- Dariush et al. (2007) Dariush, A., Khosroshahi, H.G., Ponman, T.J., Pearce, F., Raychaudhury, S., Hartley, W., 2007, MNRAS, 382, 433
- Dariush et al. (2010) Dariush, A., Raychaudhury, S., Ponman, T.J., Khosroshahi, H.G., Benson, A.J., Bower, R.G., Pearce, F., 2010, MNRAS, 405, 1873 (DRP10)
- Díaz-Giménez, Muriel, Mendes de Oliveira (2008) Díaz-Giménez, E., Muriel, H., Mendes de Oliveira, C., 2008, A&A, 490, 965
- D’Onghia et al. (2005) D’Onghia, E., et al., 2005, ApJ, 630, 109
- Evrard, Metzler, & Navarro (1996) Evrard, A.E., Metzler, C.A., Navarro, J.F., 1996, ApJ, 469, 494
- Graham et al. (2005) Graham, A.W., et al., 2005, AJ, 130, 1535
- Harrison et al. (2012) Harrison, C.D., et al., 2012, ApJ, submitted ()
- Johnson et al. (2011) Johnson, R., Finoguenov, A., Ponman, T. J., Rasmussen, J., Sanderson, A. J. R., 2011, MNRAS, 413, 2467
- Jones et al. (2003) Jones, L.R., et al., 2003, MNRAS, 343, 627
- Khosroshahi et al. (2006) Khosroshahi, H.G., Ponman, T.J., Jones, L.R., 2006, MNRAS, 372, L68
- La Barbera et al. (2008) La Barbera, F., et al., 2008, PASP, 120, 681
- La Barbera et al. (2009) La Barbera, F., et al. 2009, AJ, 137, 3942
- Liedahl et al. (1995) Liedahl, D.A., Osterheld, A.L., Goldstein, W.H., 1995, ApJL, 438, 115
- Lopes et al. (2009) Lopes, P.A.A., de Carvalho, R.R., Kohl-Moreira, J.L., Jones, C., 2009, MNRAS, 399, 2201
- Mendez-Abreu et al. (2011) Mendez-Abreu, J., et al., 2011, A&A, in press ()
- Mendes de Oliveira et al. (2009) Mendes de Oliveira, C.L., Cypriano, E.S., Dupke, R.A., Sodré, L., Jr., 2009, AJ, 138, 502
- Mewe et al. (1985) Mewe, R., Gronenschild, E.H.B.M., van den Oord, G.H.J., 1985, A&AS, 62, 197
- Miller et al. (2011) Miller, E.D., et al., 2011, ApJ, submitted ()
- Milosavljević et al. (2006) Milosavljević, M., Miller, C.J., Furlanetto, S.R., Cooray A., 2006, ApJ, 637, 9
- Mulchaey (2000) Mulchaey, J., ARA&A, 2000, 38, 289
- Pierini et al. (2011) Pierini, D., et al., 2011, MNRAS, in press ()
- Ponman & Bertram (1993) Ponman, T.J., & Bertram, D. 1993, Nature, 363, 51
- Ponman et al. (1994) Ponman, T.J., Allan, D.J., Jones, L.R., Merrifield, M., McHardy, I.M., Lehto, H.J., Luppino, G.A. 1994, Nature, 369, 462
- Rasmussen et al. (2006) Rasmussen, J., Ponman, T.J., Mulchaey, J.S., Miles, T.A., Raychaudhury, S., 2006, MNRAS, 373, 653
- Rasmussen & Ponman (2007) Rasmussen, J., Ponman, T. J., 2007, MNRAS, 380, 1554
- Romer et al. (2000) Romer, A.K. et al. 2000, ApJS, 126, 209
- Rosati et al. (2011) Rosati, P., Borgani, S., Gilli, R., et al., 2011, Memorie della Societa Astronomica Italiana
- Sales et al. (2007) Sales, L.V., Navarro, J.F., Lambas, D.G., White, S.D.M., Croton, D.J., 2007, MNRAS, 382, 1901
- Santos et al. (2007) Santos, W.A., Mendes de Oliveira, C., Sodré, L.J. 2007, AJ, 134, 1551
- Söchting et al. (2006) Söchting, I. K., Huber, M. E., Clowes, R. G., & Howell, S. B. 2006, MNRAS, 369, 1334
- Tozzi et al. (2006) Tozzi, P., et al. 2006, A&A, 451, 457
- Ulmer et al. (2005) Ulmer, M.P., et al. 2005, ApJ, 624, 124
- van den Bosch et al. (2007) van den Bosch, F.C., et al., 2007, MNRAS, 376, 841
- Vikhlinin et al. (1999) Vikhlinin, A., McNamara, B.R., Hornstrup, A., Quintana, H., Forman, W., Jones, C., Way, M. 1999, ApJ, 520, 1
- Voevodkin et al. (2010) Voevodkin, A., et al., 2010, ApJ, 708, 1376
- von Benda-Beckmann et al. (2008) von Benda-Beckmann, A.M., D’Onghia, E., Gottlöber, S., Hoeft, M., Khalatyan, A., Klypin, A., Müller, V., 2008, MNRAS, 386, 2345