11email: w.varricatt@jach.hawaii.edu
Multiple outflows from the luminous YSO IRAS 07422-2001
The luminous Young Stellar Object (YSO) IRAS 07422-2001 is studied in the infrared. We discover star forming activity in embedded clusters located in a cloud detected at mid-IR wavelengths in emission. Multiple outflows are discovered from these clusters in the H2 ro-vibrational line at 2.122 m. We detect at least six outflows from the cluster associated with the IRAS source and another outflow from a source located in a cluster detected 2.7 arcmin NE of the IRAS source. Additional star formation is taking place in two other cluster candidates within the cloud. Three of the YSOs in the cluster associated with the IRAS source are detected at 11.2 m at an angular resolution of 0.8″. We have a tentative detection of a circumstellar disk in this cluster, seen as an extinction lane in the and -band images. The spectral energy distributions (SEDs) of the dominant YSOs in the cluster associated with the IRAS source and in the NE cluster are studied using radiative transfer models and the properties of the YSOs are estimated. The YSO associated with the IRAS source is probably in a very early Class I stage of formation. The source identified as the dominant YSO in the NE cluster appears to be older than the dominant YSO in the cluster associated with the IRAS source, but its observed flux seems to be contaminated by extra emission, which suggests the presence of a young source contributing to the SED at far-IR wavelengths. The star formation observed in the field of IRAS 07422-2001 supports the idea of hierarchical formation of massive star clusters and the growth of massive young stellar objects near the centres of multiple sub-clusters in a star forming clump through competitive accretion.
Key Words.:
Stars: formation – Stars: pre-main sequence – Stars: protostars – ISM: jets and outflows – circumstellar matter1 Introduction
Studies of massive star formation have been getting significant attention in the recent years. The intriguing problem is to understand how massive stars form - whether it is through a process similar to that for low mass stars, ie., through disk accretion and driving molecular outflows (e.g. Yorke & Sonnhalter yorke02 (2002)) or through alternative scenarios like coalescence of lower mass stars (e.g. Bonnell, Bate & Zinnecker bonnell98 (1998)). Even though it is still debatable how very massive stars form, it is almost clear that stars at least up to late-O spectral types form primarily through disk accretion and that the poor collimation of outflows from many of these objects previously seen in single-dish CO observations is mainly due to multiple collimated outflows (eg. Beuther et al. beuther02 (2002), Varricatt et al. varricatt10 (2010)). However, it has been proposed that their formation may be different from low mass stars’ in the sense that they may form mainly in massive clusters through competitive accretion, where the cluster potential aids the growth of massive YSOs near the centres of massive clusters (eg. Bonnell & Bate bonnell06 (2006))
IRAS 07422-2001 (henceforth IRAS 07422) is a luminous YSO, first detected in 12CO(J=1-0) by Wouterloot & Brand (wb89 (1989)) using the 15-m SEST. They detected a blue wing emission in CO, implying the presence of outflows. From a Vlsr=52.7 km s-1 of the CO line, they derived a kinematic distance of 5.1 kpc and a luminosity of 7.4 103 L⊙. Palla et al. (palla93 (1993)) detected strong H2O masers at vpeak=44.8 km s-1 and derived a kinematic distance of 4.2 kpc. Brand et al. (brand94 (1994)) also detected H2O masers from this source at similar radial velocity and flux density.
Slysh et al. (slysh99 (1999)) did not find any 6.7 GHz class-II methanol maser emission from this region at a 3 sensitivity of 3 Jy suggesting that the YSOs here may be very young. Codella & Felli (codella95 (1995)) did not detect any H89 hydrogen recombination line emission from IRAS 07422 suggesting that this source is very young and has not yet formed a diffuse Hii region. Urquhart et al. (urquhart07 (2007)), in their Red MSX Source (RMS) radio survey, did not detect any emission (above their rms noise levels of 0.14 mJy and 0.17 mJy at 3.6 cm and 6 cm respectively) from IRAS 07422 indicating that the YSOs detected here at mid- and far-IR wavelengths are in pre-UCHii phase.
A dense core was detected towards this source in 97.981-GHz CS(2-1) emission (Bronfman, Nyman & May bronfman96 (1996)) at Vlsr=52.8 km s-1; Slysh et al. (slysh97 (1997)) observed OH thermal emission at a similar velocity (52.3 km s-1). These are significantly different from the velocity at which H2O masers were detected. However, H2O masers seen towards massive YSOs are understood to be excited by jets (eg. Felli, Palagi, Tofani felli92 (1992), Goddi et al. goddi05 (2005)). Hence we use the 52.8 km s-1 of the CS emission for estimating the distance. Using the latest rotation curves of Reid et al. (reid09 (2009)), we estimate a kinematic distance of 4.01 (+0.69, -0.64) kpc towards IRAS 07422. We will use this distance for the calculations in this paper.
Even though outflow signatures were observed in the data of Wouterloot & Brand (wb89 (1989)), no systematic observations have been reported on this source to investigate it further. Near-IR imaging is a powerful tool to study star forming regions. Outflows from YSOs emit strongly in the near-IR ro-vibrational lines of H2; the H2 =1-0 S(1) line at 2.1218 m is a powerful tracer of outflows via shock excitation. The high spatial resolution available with moderately sized telescopes at IR wavelengths when compared to that available with single-dish radio and mm telescopes and the much lower interstellar extinction at IR wavelengths compared to that at optical wavelengths make this regime ideal for studying massive star forming regions. In this paper, we use near-IR imaging to understand the star formation in IRAS 07422. The new data are used along with available archival data to study the properties of the YSOs.
2 Observations and data reduction
2.1 WFCAM imaging
Observations were obtained with the 3.8-m United Kingdom Infrared Telescope (UKIRT) and the Wide Field Camera (WFCAM111http://www.jach.hawaii.edu/UKIRT/instruments/wfcam/; Casali et al. casali07 (2007)) using near-IR broadband , and MKO filters and a narrow-band MKO filter centred at the wavelength of the H2 (1-0) S1 line at 2.1218 m. WFCAM has a pixel scale of 0.4 pix-1 and employs four 20482048 HgCdTe HAWAII-2RG arrays, each with with a field of view of 13.6513.65. The four arrays are arranged in a square pattern in the focal plane, with a gap of 12.83 each in the fields covered by adjacent arrays. For the current work, we used the data from only one of the four arrays in which the object was located. Observations were performed by dithering the object (to 9 points in the focal plane for and bands and to 5 points for H2) separated by a few arcseconds. We used a 22 microstepping, hence the final pixel scale is 0.2 pixel-1. The spatial resolution is limited by the seeing at the time of observations.
The first set of observations were obtained on 20110218 UT. Since outflows were detected in the H2 line, we further observed the region in H2 and filters on three more epochs to improve the depth of detection. Table 1 gives a log of the WFCAM observations performed.
| UTDate | Filters | Exp. time | Total int. | FWHM |
| (yyyymmdd) | used | (s) | time (s) | (arcsec) |
| 20110218 | 10, 5, | 720, 360, | 0.83, 0.81, | |
| 5, 40 | 360, 800 | 0.82, 0.81 | ||
| 20110309 | 5, 40 | 360, 800 | 1.40, 1.28 | |
| 20110310 | 40 | 800 | 1.16 | |
| 20110311 | 40 | 800 | 1.37 |
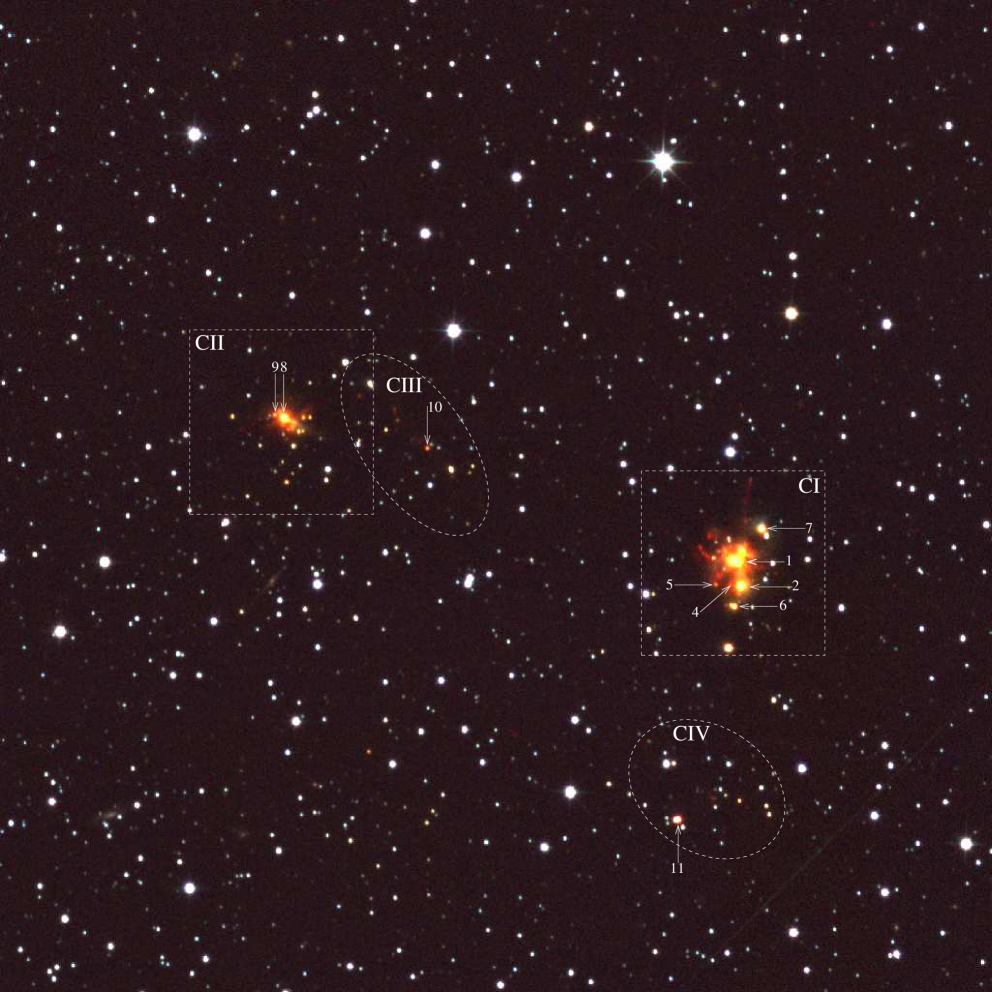
The data were reduced by the Cambridge Astronomical Survey Unit (CASU); the archival and distribution of the data are carried out by the Wide Field Astronomy Unit (WFAU). The sky conditions were not photometric during the observations. However, since the flux calibration was performed by deriving the photometry of isolated point sources with 2MASS detection in the large field of each array, the photometric accuracy is good for the stars detected. The derived magnitudes are in the MKO photometric system. Fig. 1 shows a colour composite image of a 5.55.5 section of the full WFCAM image, showing the area where the outflow and star formation activity discussed in this paper take place.
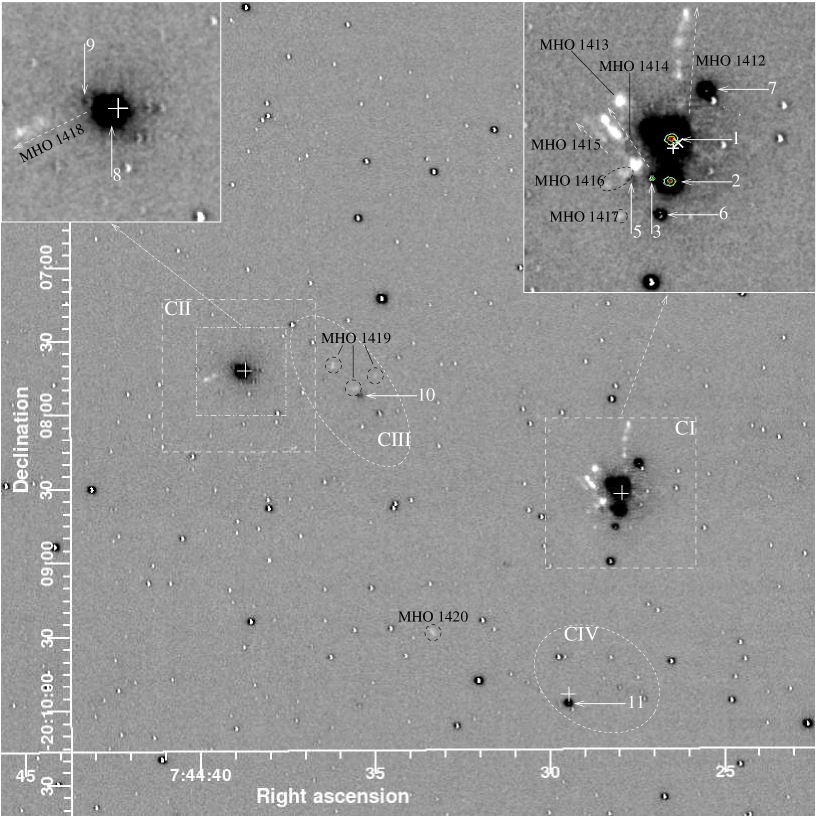
The sky background was fitted and removed from the mosaics. The H2 images were continuum-subtracted using the -band images. The average of the ratio of counts, for a few isolated point sources, between the and H2 images was obtained. The background-subtracted -band image was scaled by this ratio and was then subtracted from the background-subtracted H2 image. The H2 mosaic of 20110218 was continuum-subtracted using an average of the two -band mosaics obtained on the same night; those of 20110309–20110311 were continuum-subtracted using the average of the two -band mosaics obtained on 20110309. Due to differences in seeing between the and H2 images, point sources give positive and negative residuals. A uniform continuum-subtraction over all objects in the field is difficult to achieve in regions with a wide range in near-IR colours. The /H2 ratio has a dependence on the apparent near-IR colours; hence highly reddened sources and objects with excess appear with large negative residuals in the continuum-subtracted H2 image (see Varricatt varricatt11 (2011) for a discussion). Fig. 2 shows the continuum-subtracted H2 image of the region shown in Fig. 1. Images from all four epochs of our H2 observations are averaged here to improve the S/N of the emission features detected.
2.2 Archival data
The IRAS mission detected a point source at =7:44:27.9 =-20:08:32 (J2000) in all four bands (at 12, 25, 60 and 100 m). IRAS 07422 was detected well in the all sky survey conducted by the AKARI satellite (Murakami et al., murakami07 (2007)). The mid-IR camera - Infrared Camera (IRC) - on board AKARI detected three sources at 18 m. The brightest two of these were also detected by the AKARI Far-Infrared Surveyor (FIS) in all 4 bands (at 65, 90, 140 and 160 m).
At mid-IR wavelengths, the MSX mission (in four bands A, C, D and E centred at 8.28, 12.13, 14.65 and 21.23 m respectively) also detected three sources in this region. The locations of the MSX sources roughly coincide with those of the three sources detected by AKARI-IRC at 18 m. This region was observed in the Wide-field Infrared Survey Explorer (WISE; Wright et al. wright10 (2010)) mission in four bands - 1 (3.4 m), 2 (4.6 m), 3 (12 m) and 4 (22 m). The images in the four bands have angular resolution of 6.1, 6.4, 6.5 and 12.0 respectively and have an astrometric precision better than 0.15″for sources detected with good S/N. The excellent sensitivity of the WISE data enables detection of many faint features in the data.
Most of the mid-IR observations available on this source have poor angular resolution compared to our near-IR WFCAM images. No Spitzer data is available for IRAS 07422. The only mid-IR observation available with good angular resolution is with UKIRT and Michelle. Michelle (Glasse et al. glasse97 (1997)) is a mid-infrared imager/spectrometer operating in the 8–25 m wavelength regime, using an SBRC Si:As 320x240-pixel array. It has an image scale of 0.21″/pix and a field of view of 67.2″50.5″at the Cassegrain focal plain of UKIRT. The Michelle observations were performed on 20040422 (UT) using an filter centred at 11.2 m
The Michelle data were downloaded from UKIRT data archive and were reduced using the facility data reduction pipeline ORACDR. The observations were performed by chopping the secondary and nodding the telescope by 20″each (peak-peak) in mutually perpendicular directions to detect faint sources in the presence of strong background emission at thermal wavelengths. The resulting mosaic has four images of the source (2 positive and 2 negative beams). The final image was constructed after negating the negative beams and combining all 4 beams. Fig. 8 shows the final mosaic of the region around IRAS 07422. An average FWHM of 0.8″was measured from the sources detected in the 11.2 m image.
3 Results and discussion
Our near-IR images reveal a very active picture of star formation associated with IRAS 07422. Fig. 1 shows a large number of red sources in at least two embedded clusters and two additional cluster candidates active in star formation. Regions containing them are enclosed in dashed boxes or ellipses in the figure and are labelled “CI–CIV”; the most prominent of these are “CI” and “CII”. Interesting point sources are labelled “1–11” on the figure.
The continuum-subtracted H2 image (Fig. 2) shows multiple outflows from this region. Dashed arrows are shown on Fig. 2 where aligned H2 line emission knots are present, which suggest the directions of the outflows. The H2 emission features are named MHO 1412–1420 in the Catalogue of Molecular Hydrogen emission-line Objects222http://www.jach.hawaii.edu/UKIRT/MHCat/ (Davis et al. davis10 (2010)) and are labelled on the figure. Table 3 shows the directions and lengths of the outflows detected in Fig. 2. The angles given in the table are east of north, measured from our H2 image.
Near-IR () - () colour-colour diagram is a powerful tool to identify YSO candidates via reddening and excess. The magnitudes of point sources detected over the 13.5′13.5′field covered by the array on which IRAS 07422 was located are used to construct the colour-colour diagram. Magnitudes of the sources detected over multiple epochs are averaged. We had clouds present during the observations. Therefore, to avoid any influence from variable clouds, objects located within 7″of the edges of our near-IR images are omitted from the colour-colour diagram so that only those present in all jittered frames are used. Only those objects with a photometric error of 0.207 mag or less in , which is our 1- error in at 19 mag, are used. Fig. 3 shows the colour-colour diagram constructed from our observations. The continuous and the short dashed green curves show the loci of the colours of main-sequence and giant stars adopted from Tokunaga (tokunaga00 (2000)). The long dashed green line shows the loci of Classical T Tauri stars (CTTS) from Meyer, Calvet & Hillenbrand (meyer97 (1997)). The dotted red arrows show the reddening vectors up to AV=50 derived from the interstellar extinction law given in Rieke & Lebofsky (rieke85 (1985)). The objects located in between the two main-sequence reddening vectors are expected to be reddened main-sequence stars. YSOs occupy the region of the colour-colour diagram below the lower reddening vector for the main-sequence stars, where CTTS, Herbig Ae/Be (HAeBe) stars and Luminous YSOs occupy different regimes (Lada & Adams lada92 (1992)).
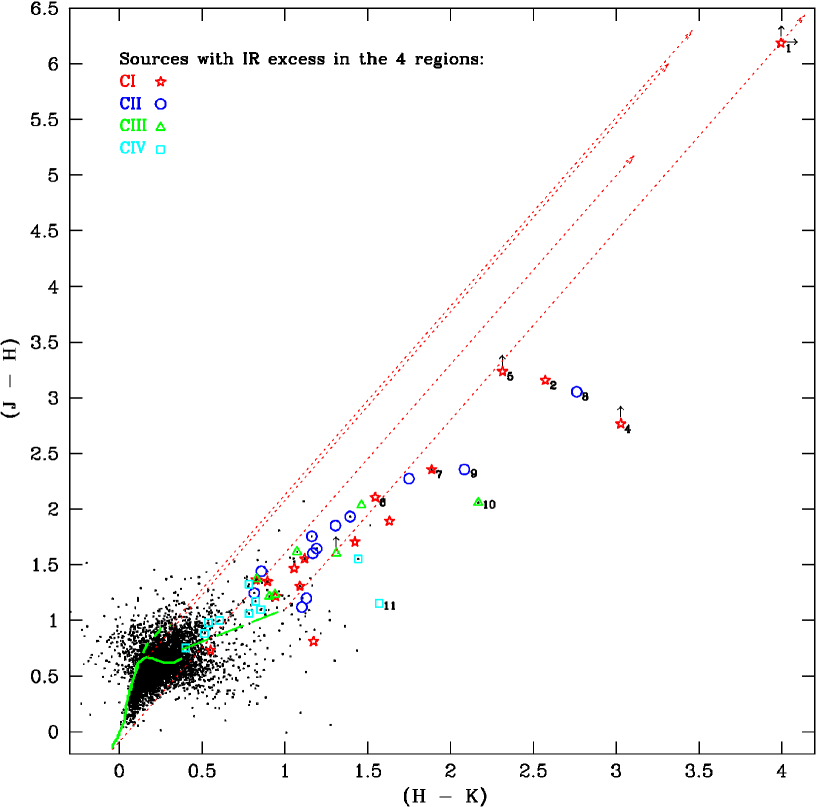
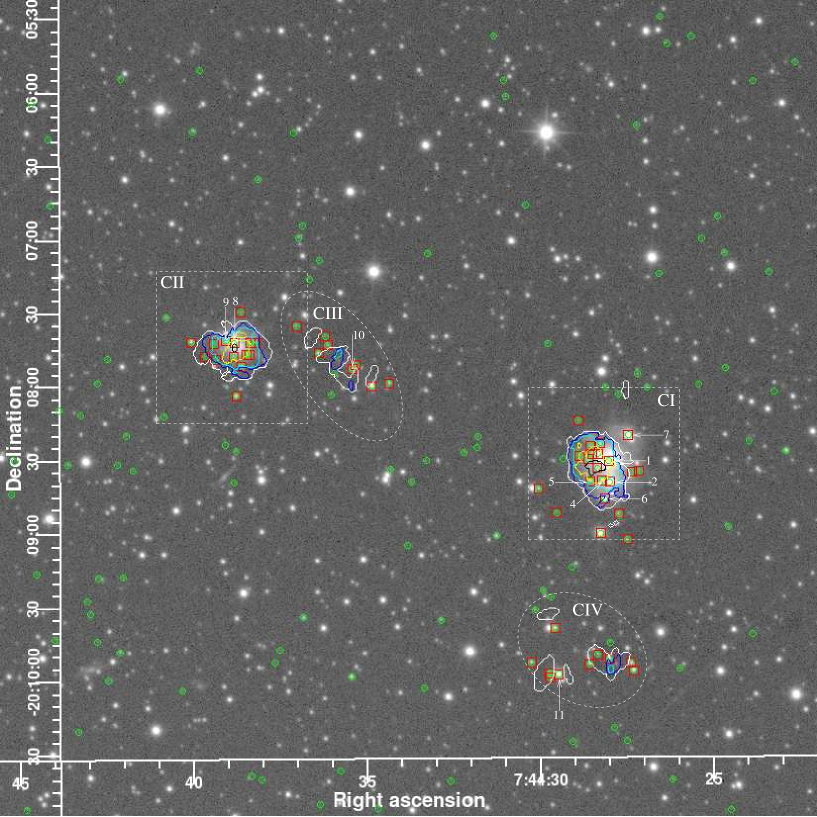
Fig. 4 shows the WFCAM -band image of the 5.55.5 field shown in Fig. 1. All sources in this field exhibiting IR excess in the colour-colour diagram (Fig. 3) are enclosed in green circles; sources with IR excess in regions “CI–CIV” are enclosed in red boxes. Contours are overlaid on Fig. 4 to show the number of objects with IR excess, within a radius of 10″, estimated at 1″intervals over the 5.55.5 field. The contours show enhancements in the number density of sources with IR excess towards regions “CI–CIV” suggesting that these regions host embedded clusters.
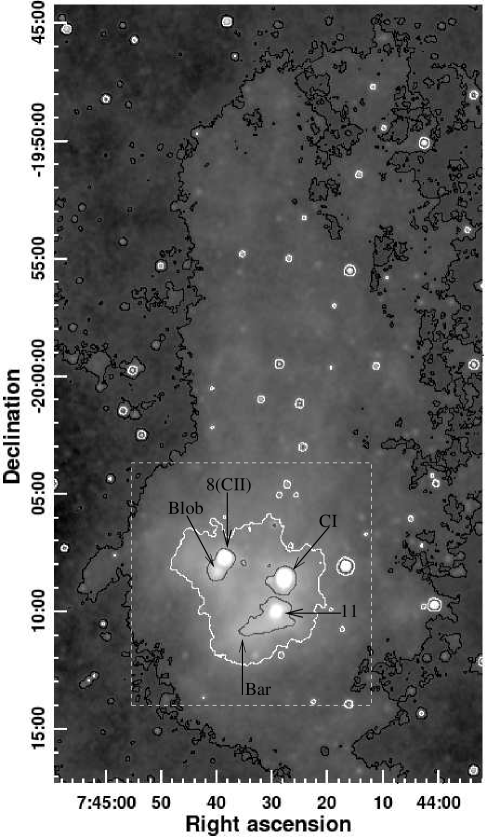
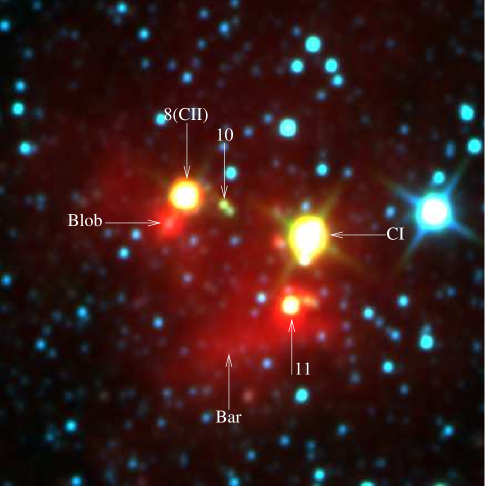
The WISE 3.4–22-m images provide a deeper view of the star forming activity in this region. The 12-m image (Fig. 5) shows a cloud of 15′30′extending NS. The 22-m image also shows the nebulosity from the whole cloud, albeit with lower S/N than in the 12-m image. The cloud appears cometary; most of the star formation activity seems to be taking place in the “head” - in a region of 6 diameter located towards the southern region of the cloud (region encompassed by the white contour in Fig. 5). This region of the cloud exhibits extended nebulosity in all four bands and hosts all the young clusters discussed here. Fig. 6 shows a WISE 3.4, 4.6, 12 m colour composite image of a 10′10′field around the southern region of the cloud. The nebulosity, which is much stronger at 12 m than at shorter WISE wavelengths, is seen red in colour.
The three MSX sources detected near IRAS 07422 are located in “CI”, “CII” and “CIV” (close to the near-IR sources #1, #8 and #11 respectively). The three sources detected by AKARI-IRC at 18 m agree with the MSX sources within positional errors. The AKARI-FIS detected emission from “CI” and “CII” in all four bands. The FIS source associated with “CI” is the brighter one.
The outflows detected in H2 and the interesting near-IR sources detected are described throughout the text. The coordinates and magnitudes of the prominent sources are given in Table 2.
3.1 The outflows detected and their possible driving sources
3.1.1 CI
“CI” is the most prominent feature in the near-IR images (Fig. 1). This region hosts a cluster of red sources embedded in nebulosity. An expanded view of a 1′1′field containing “CI” is shown in Fig. 7. A few point sources of interest are labelled “1–7” on the figure. The brightest of these are the two red near-IR sources labelled #1 and #2. In the WFCAM images, #1 appears to be located behind an extinction lane running NE-SW. Strong nebulosity is seen in the vicinity of #1; the nebula is roughly bipolar in appearance in and bands with the two blobs of diffuse emission located NW and SE of the location of #1 and of the extinction lane. , and images of the central region of “CI” containing #1 and #2 are shown separately as insets on Fig. 7.
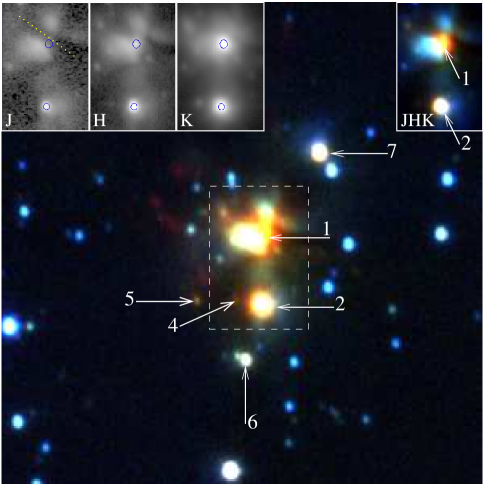
The point source #1 is bright in (10.52 mag) and is much fainter in (14.51 mag). In band, the emission from the SE nebula is stronger than that from the point source detected. In , #1 is not detected and only the nebulosity associated with it is seen. Since #1 is closely associated with nebulosity, we derived its and magnitudes by performing aperture photometry in a 1.5″-diameter aperture. #1 is not detected in , so we have used the detection limit to derive its colour. The magnitude derived may still be significantly affected by nebulosity. Hence we treat the magnitude also as an upper limit only for deriving its colours. Fig. 3 shows that #1 is the reddest object detected in this region. #2 is located 8.85″S of #1. #2 shows large reddening and excess, but is much less red than #1. There are several other sources in “CI”, which exhibit large reddening and excess in Fig. 3. “4–7” are the prominent ones among them. Prominent sources in “CI” with IR excess are shown by “star” symbols in Fig. 3.
The brightest of the three AKARI-IRC sources is located in “CI”, between #1 and #2; the brighter of the two AKARI-FIS sources is in “CI”. “CI” also hosts the brightest of the three MSX sources, which is detected in all four MSX bands. The location of the brightest of the sources detected by IRC, FIS and MSX coincides with the IRAS source within the positional errors.
| Source | Coordinates (J2000) | 11.2-m flux | |||
|---|---|---|---|---|---|
| (, ) | (mag)a | (mag)a | (mag)a | (mJy)a | |
| 1b | 07:44:27.964, -20:08:30.98 | 14.511 (0.002) | 10.516 (0.020) | 579 (31) | |
| 2b | 07:44:27.988, -20:08:39.77 | 16.475 (0.003) | 13.317 (0.001) | 10.745 (0.020) | 364 (25) |
| 3 | 07:44:28.251, -20:08:39.28 | 80 (15) | |||
| 4b | 07:44:28.196, -20:08:39.19 | 17.933 (0.031) | 14.905 (0.010) | ||
| 5 | 07:44:28.552, -20:08:39.30 | 17.463 (0.016) | 15.149 (0.013) | ||
| 6 | 07:44:28.123, -20:08:46.77 | 17.227 (0.030) | 15.120 (0.001) | 13.575 (0.006) | |
| 7 | 07:44:27.457, -20:08:20.92 | 16.361 (0.002) | 14.005 (0.004) | 12.119 (0.002) | |
| 8b | 07:44:38.814, -20:07:42.27 | 16.920 (0.014) | 13.865 (0.004) | 11.103 (0.002) | |
| 9b | 07:44:39.035, -20:07:41.31 | 19.360 (0.051) | 17.003 (0.018) | 14.919 (0.010) | |
| 10 | 07:44:35.411, -20:07:52.88 | 19.351 (0.053) | 17.293 (0.003) | 15.125 (0.002) | |
| 11 | 07:44:29.476, -20:09:57.95 | 15.425 (0.015) | 14.271 (0.001) | 12.701 (0.002) |
-
a
The values given in parenthesis are the 1- errors.
-
b
The magnitudes for these sources are aperture photometry in a 1.5″-diameter aperture; there may still be contamination from nebulosity.
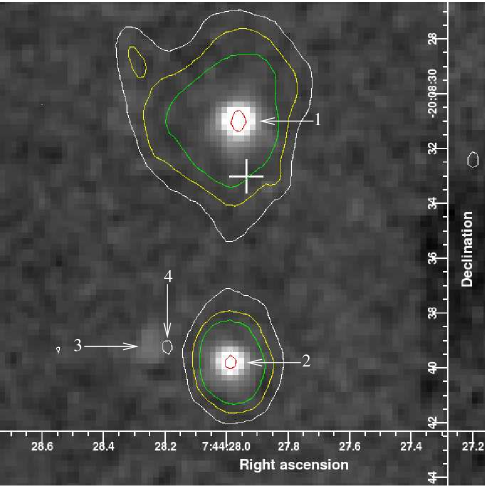
Fig. 8 shows the 11.2-m image obtained using UKIRT and Michelle. An 18″18″field, which encompasses the objects detected at 11.2-m, is shown in the figure. Only three objects are detected in the Michelle image; #1 and #2 are the brightest. Astrometric corrections are applied to the Michelle image, using the coordinates of #1 and #2 from our WFCAM images. The third source (labelled “3”) is very faint; it is located 3.8 arcsec NE of #2. The coordinates of #1 and #2 from the WFCAM images and that of #3 measured from the calibrated Michelle image are listed in Table 2. The 11.2-m flux obtained from the Michelle observations are also listed in the table. #1 is the brightest source in the Michelle image at 11.2 m and #3 is the faintest. #3 is detected above 5 at 11.2 micron. We do not see any counterpart at exactly the same location as of #3. However, Fig. 7 shows a source labelled #4 located only 0.72″W of #3. This offset is significant, considering the positional accuracy of our WFCAM observations. Contours generated from our WFCAM -band image are overlaid on the Michelle image in Fig. 8, which show the detection of #1 and #2 at 11.2 m and the offset of #3 from #4. However, since the Michelle image is astrometry calibrated with the coordinates of only two sources from WFCAM (#1 and #2), we need more observations, especially at thermal IR to ascertain if #3 and #4 are the same or different. #4 is a highly reddened source. It is detected well in , marginally detected in and is not detected in .
Our continuum-subtracted H2 image (Fig. 2) reveals several line emission features in the vicinity of the cluster. These are labelled MHO 1412–1417 on the figure. The possible directions and lengths of some of the outflows implied by these line emission knots are shown by dashed arrows on the figure and are listed in Table 3. The most prominent of these is MHO 1412, which appears to be directed away from #1, with H2 knots extending up to a projected length of 27″(0.53 pc) from #1. With #1 being the reddest and the brightest source seen in the near- and mid-IR, and being the primary contributor to the emission seen at longer wavelengths, we identify #1 as the most luminous YSO in “CI”. From the locations of the features MHO 1412–1417, it appears that at least 6 different outflows may be responsible for them. Other than #1, we identify #2 and #3 as two other YSOs responsible for driving the outflows in this region. However it is difficult to assign any of the observed H2 line emission features MHO 1413–1417 as originating from these sources. Some of the other reddened IR-excess sources in “CI” may also be driving outflows, some of which are seen in the H2 line emission. The spectral energy distribution of #1 and a model fit to it are discussed in 3.2.1.
The extinction lane close to source #1 deserves detailed investigation. In and bands, it has the appearance of a nearly edge-on disk at an angle of 53∘ east of north (see the inset in Fig. 7). It is also noteworthy that the two H2 knots in MHO 1416 and the bright knot at the base of MHO 1414 align well at an angle of 127∘ east of north (see Fig. 2), which is roughly perpendicular to the orientation of the extinction lane. High angular resolution observations at longer wavelengths, especially in the mm, are required to understand if the extinction lane is caused by a nearly edge-on circumstellar disk.
| Outflow | Angle (∘) | Length | |
|---|---|---|---|
| ID | (E of N) | arcsec | parsec |
| MHO 1412 | 353 | 27.2 | 0.53 |
| MHO 1414 | 38 | 14.5 | 0.28 |
| MHO 1415 | 41 | 15.5 | 0.30 |
| MHO 1418 | 116 | 13 | 0.25 |
3.1.2 CII
“CII” hosts an embedded cluster 2.7′ NE of the IRAS position (Fig. 1). An expanded view of “CII” is shown in Fig. 9. The WFCAM image shows a large number of objects surrounding a bright source (labelled #8) detected in the near-IR and exhibiting reddening and excess in the colour-colour diagram (Fig. 3). #8 is the brightest near-IR source in “CII”. It is less embedded than #1 and is detected well in our , and images. There is no IRAS detection in “CII”. The second brightest of the AKARI-IRC and FIS, and MSX sources is detected in this region, but they lack the positional accuracy to assign the detection to #8 or any other reddened source in the cluster. However, the WISE images with very good positional accuracy shows a bright source, the position of which agrees well with what is derived from the WFCAM images. Hence, #8 is likely to be the most luminous YSO in the cluster. In addition to #8, “CII” hosts several other reddened sources with IR excess. Prominent sources with excess, detected well in our images are shown with blue circles in Fig. 3.
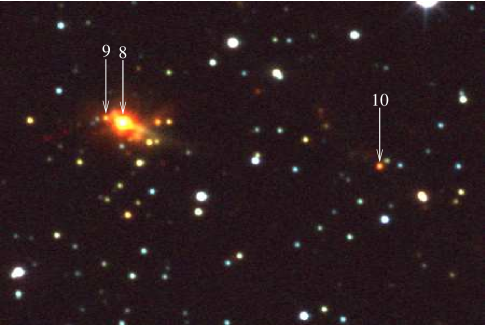
Fig. 2 shows aligned H2 line emission knots labelled MHO 1418 and shown by a dotted arrow. The direction of orientation of the H2 knots imply an outflow emanating from “CII”. It is not clear if #8 or any of the fainter reddened sources with excess nearby is responsible for driving MHO 1418. The limited H2 knots in MHO 1418 do not trace directly to #8, but they trace back to a source #9 located 3.25″NE of #8. MHO 1418 has a length of 16″(0.31 pc) if it is from #8 and 13″(0.25 pc) if it is from #9. Fig. 3 shows that #9 also exhibits large reddening and excess. #8 is the dominant source in the WISE bands. In 3.2.2, we model the spectral energy distribution of #8.
The WISE 12-m image shows a nebulous emission feature at =07:44:40.034, =-20:08:15.91, labelled “Blob” in Figs. 5 and 6. It is offset 39″SE of #8. The WISE 3.4 and 4.6-m images show a point source very close to this position. It is not clear if they are the same as “Blob”. The 22-m image has much poor spatial resolution. It doesn’t resolve a source at the location of “Blob”, but only shows a slight elongation of the nebulosity associated with #8 in the in the direction of the “Blob”. Therefore it remains to be investigated at better spatial resolution and higher sensitivity at longer wavelengths to learn if “Blob” hosts a source much younger than #8.
3.1.3 CIII and CIV
Regions “CIII” and “CIV” show concentrations of red sources. These appear elongated and are much less prominent than “CI” and “CII”. Fig. 4 shows that there is enhancement in the number density of sources with IR excess towards “CIII” and “CIV”. They are shown enclosed within ovals in Fig. 1. Deep thermal imaging at high angular resolution is required to understand if these two regions host embedded clusters.
“CIII” is seen elongated in the NE–SW direction and is located close to, and towards the west of, “CII”. Several sources in “CIII” show IR excess, which are shown with green triangles in Fig. 3. There is a very red source, #10, located somewhat near the centre of “CIII”, and showing large reddening and excess in Fig. 3. It is detected well in and bands and is marginally detected in . #10 is detected well in all four WISE bands; in the WISE 22-m image, it is one of the few objects detected. There are several other reddened sources in “CIII”. In H2 line, we detect three line emission knots, which are labelled MHO 1419 in Fig. 2. It is not clear if all these features are from YSOs in “CIII”. One of these knots is is located very close to #10; it may be associated with #10. With the WISE source coinciding with #10, we identify it as the dominant YSO in “CIII”.
“CIV” is located towards the south of “CI”; it also hosts several reddened sources as seen in Figs. 1 and 3. Sources in “CIV” with excess are shown with cyan boxes in Fig. 3. The source labelled #11 is the prominent among them and is detected well in , and . Other than “CI” and “CII”, “CIV” is the only region in Fig. 1 detected by MSX and AKARI-IRC. Most of the reddened sources in “CIV” except #11 appear to be distributed in a filamentary pattern oriented NE–SW. #11 is located somewhat south of those reddened sources. At the spatial resolution of WISE, more than one source may be contributing to the WISE detection at the location of #11. However the location of the WISE source shows that #11 is the dominant contributor to the flux measured in the WISE bands. The faintest of the three AKARI-IRC sources coincides with the near-IR source #11. This object was not detected by AKARI-FIS in the far-IR. This is also the faintest of the three sources detected by MSX in this region. “CIV” was detected by MSX in band A only. We detect an H2 knot MHO 1420, NE of “CIV”. It is not clear if it is due to outflow from any of the sources in “CIV” or “CI” discussed here. The WISE images exhibit a bar-like feature in the nebulosity below “CIV”, which is labelled in Figs. 5 and 6.
3.2 The spectral energy distribution
Out of the four embedded clusters identified in our data, “CI” and “CII” are the prominent ones. Near-IR sources #1 and #8 appear to be the most luminous YSOs in these clusters, as inferred from their possible association with longer wavelength data. The SEDs of these sources are modelled in §3.2.1 and §3.2.2.
The WFCAM, Michelle, MSX, WISE, AKARI and IRAS data were used to construct the SED of the sources. Colour corrections were applied to AKARI and IRAS data using the correction factors given in their respective point source catalogues (Kataza et al. kataza10 (2010), Yamamura et al. yamamura10 (2010), Beichman et al. beichman88 (1988)).
We used the SED fitting tool of Robitaille et al. (robitaille07 (2007)) available on-line to model the SEDs. They use a grid of 2D radiative transfer models presented in Robitaille et al. (robitaille06 (2006)), developed by Whitney et al. (2003a , 2003b , etc.). The grid consists of 20000 YSO models with SEDs covering stellar masses of 0.1–50 M⊙ and evolutionary stages from the early infall stage to the late disk-only stage, each at 10 different viewing angles. The results of the SED modelling are presented in Table 4. Note that the model assumes a single object whereas multiplicity will be an issue in our regions. Hence, the actual errors in some of the parameters could be larger than the values given in Table 4 due to possible contributions to the observed fluxes of the dominant YSOs from neighbouring sources.
3.2.1 Source #1
At the poor spatial resolution of IRAS, AKARI-FIS and MSX, the source detected in “CI” will contain the emission from the whole cluster. However, #1 is resolved from the other sources in “CI” in the WISE 3.4 and 4.6-m data. The WISE images and the well-resolved Michelle image, both with good positional accuracy, show that #1 is the dominant contributor at longer wavelengths (see Fig. 8). #1 has a steeply rising SED. In band, the combined emission from #2 – #7, the extended nebulosity and the rest of the objects in the vicinity dominates over the emission from #1; the relative contribution from #1 being only 21%. At 11.2 m, #1 contributes 56.6% of the total flux of #1, #2 and #3 combined.
For , and 11.2 m, we used the flux estimated from the WFCAM and Michelle data (see §3.1.1) for constructing the SED. The WISE photometry of #1 is quite free of emission from the neighbours, especially in W1 and W2 bands, where #1 is resolved from #2 and the rest of the cluster members. However, there appears to be a small contribution from the neighbours in the photometry listed in the catalogue. Hence, for WISE W1 and W2 bands, we re-determined the photometry of source #1 by performing relative photometry using the magnitudes of neighbouring isolated point sources in the WISE images and using a 10-diameter aperture. In WISE band W3, #1 is not resolved from #2 and the rest of the members of the cluster due to poor spatial resolution. We therefore estimated the photometry of the whole cluster using a large aperture and applied a flux correction factor of 0.57, which is the relative contribution of #1 towards the flux of #1, #2 and #3 combined, derived from the Michelle data at 11.2 m given in Table 2. The IRAS 12 m flux has also been scaled by the same factor. No correction has been applied for the WISE 23-m photometry assuming that emission at long wavelengths is dominated by the emission from #1.
The flux in MSX band A includes emission from the rest of the cluster. MSX flux in band A is corrected by the relative contribution from source #1 towards the observed flux, which is the emission from the whole cluster. This correction factor is derived by interpolating for the value at 8.28 m between the relative contribution of #1 in the WISE 4.6-m data and in the Michelle 11.2-m data. No corrections are applied to the MSX band E data. MSX fluxes of #1 in bands C and D are not used in our fit since these are of poor quality.
The IRAS 100 m flux of this region is of moderate quality only and will be contaminated by additional emission from the cluster at the low spatial resolution of IRAS. It is also affected by IR cirrus. So it is not included in the model fit.
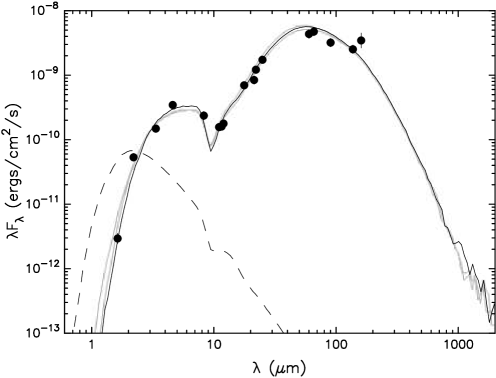
The left panel in Fig. 10 shows the model fit to the SED of source #1. Column 2 of Table 4 shows the results of the SED modelling for source #1. In addition to the best fit model, there were only two additional models with () per data point 3. Out of those, one differs from the best fit model only in foreground and circumstellar AV and the angle of inclination of the disk axis. Hence, the errors given against the parameter values in Table 4 are the differences in the parameter values of the best fit model and of the additional fit.
We derived a mass, luminosity and temperature of 10.7 M⊙, 3.9103 L⊙ and 7840 K respectively from the fit. #1 is actively accreting mass and it is likely to be a Class-I protostar. A foreground visual extinction AV=16 mag is obtained from the model fit, whereas Fig. 3 implies a much larger AV for the IR source. This suggests that #1 has a large amount of circumstellar matter, probably as a disk. This is implied by an AV(circumstellar)=25.4 mag given by the fit. High angular resolution observations in the far-IR to sub-mm wavelengths are required to further constrain the model fit.
3.2.2 Source #8
WFCAM , AKARI-IRC and FIS, WISE and MSX band-A data are used for fitting the SED of #8. MSX C, D and E-band data are not included in the final fit since they are of poor quality; (nevertheless, they agree well with the current fit and including them in the fit did not change the fit results). WFCAM photometry are obtained in a 1.5″-diameter aperture to reduce the contamination from the neighbours and the nebulosity in the cluster to a minimum.
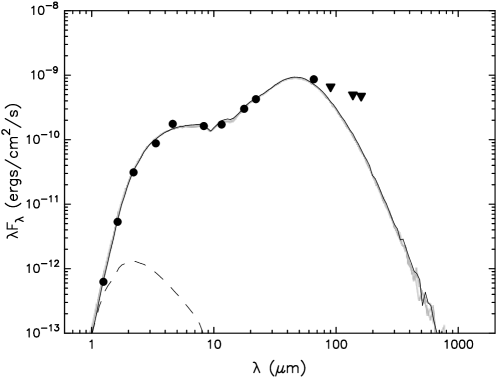
The right panel in Fig. 10 shows the model fit to the SED of #8. Table 4 shows the parameters of the best fit model. Upon the initial attempts to fit the data, it was noticed that AKARI-FIS data beyond 65 m exhibit excess with respect to the model fit, which systematically increases towards longer wavelengths. Hence the AKARI 90, 140 and 160-m data were not included in the fit and were treated as upper limits with low probability only. These data points are are shown as downward directed triangles in the figure. The data points shortward of 65 m fit the model well; a stellar mass, temperature, luminosity and age of 6.7 M⊙, 19950 K, 1.4103 L⊙ and 6.0105 yrs respectively are derived. #8 appears to be older and much less embedded than #1. The model fit yields a foreground extinction similar to that for #1, but a much lower circumstellar extinction. The high temperature of #8 suggests that it might have formed an Hii region around it. However, note that even after formation of an Hii region, the young star can still grow through accretion of ionized gas (eg. Keto keto07 (2007)).
Nevertheless, it should be noted that the temparature of #8 derived by the model fit (19950 K) is too high even for a main sequence star of its derived mass of 6.7 M⊙. This can happen if there is extra contribution to the flux observed at short wavelengths which may make the object appear hotter. It should also be noted that a circumstellar extinction of AV=0.64 mag is abnormally low for a young source exhibiting a large IR excess as seen in Fig. 3. It is very much possible that either an angle of 49.5∘ estimated by the SED modelling is wrong or more than one source is contributing to the near- and mid-IR fluxes that we use for model fit. High angular resolution observations are required for #8 to understand the real nature of the dominant YSO here.
The deviations of the AKARI-FIS data from the model fit, which increase towards longer wavelengths, suggest an extra contribution in the beam at longer wavelengths from a source colder than #8. The feature labelled “Blob” (Figs. 5 and 6 and §3.1.2) needs to be studied at better spatial resolution and higher sensitivity at longer wavelengths to see if the it hosts a source much younger than #8 and if that is the one contributing to the emission in the FIS bands, which causes the FIS fluxes to deviate systematically from the model fit. Some other near-IR sources like #9, also need to be understood in detail.
| Parameter | Best fit valuesa | |
| Source #1 | Source #8 | |
| Stellar mass (M⊙) | 10.7 (+0, -0.2) | 6.7 |
| Stellar age (yr) | 3.0 (+0, -0.2)104 | 6.0105 |
| Stellar radius (R | 33.6 (+4.5, -0) | 3.1 |
| Stellar temperature (K) | 7840 (+0, -625) | 19950 |
| Disk mass (M⊙) | 1.3 (+0, -0.3)10-2 | 3.610-3 |
| Disk accretion rate (M⊙yr-1) | 2.9 (+0, -2.42)10-6 | 7.610-7 |
| Disk/envelope inner radius (AU) | 8.4 (+2.2, -0) | 12.7 |
| Disk outer radius (AU) | 16.1 (+1.2, -0) | 134 |
| Envelope mass (M⊙) | 6.1 (+0.5, -0)102 | 2.3 |
| Envelope accretion rate (M⊙yr-1) | 9.3 (+1.1, -0)10-4 | 7.510-7 |
| Envelope outer radius (AU) | 1.0105 | 4.3104 |
| Total Luminosity (L⊙) | 3.9 (+0.3, -0)103 | 1.4103 |
| Angle of inclination of the disk axisb (∘) | 31.8 (18.5) | 49.5 (+14.6, -8.1) |
| AV (Foreground) | 16.1 (+4.7, -0.8) | 17.1 (+0, -0.5) |
| AV (Circumstellar) | 25.4 (+0, -8.7) | 0.6 (+0, -0.1) |
-
a
The values given in parenthesis are the differences in the parameters of the additional models with () per data point 3, from those of the best fit model. No errors are given when the parameters of these models do not differ; nevertheless, the uncertainties could be higher as described in §3.2. A distance of 4.01 kpc is used.
-
b
The angle of inclination of the disk axis is with respect to the line of sight.
3.3 The general picture massive star formation in IRAS 07422 as seen in the infrared
At a distance of 4 kpc, the cloud detected in the WISE images is larger than 17.5 pc35 pc. Most of the star forming activity seems to be happening in a region of diameter 11.5 pc in the southern region of the cloud. The four clusters/cluster candidates “CI–CIV” detected by us are in this region. We see H2 line emission features which are likely to be caused by jets from “CI–CIII”. The brightest object in “CIV” also has infrared colours typical of YSOs. At least in clusters “CI–CIII”, the brightest object in near- and mid-IR seems to be located near the centres of the clusters.
Several theoretical and observational studies of massive star forming regions suggest that massive star formation is intimately linked to the hierarchical formation of massive stellar clusters, where massive stars form near the centres of massive sub-clusters and grow by competitive accretion aided by the cluster potential. In this scenario, several subclusters form in a massive clump, massive stars near the central regions of these subclusters grow through competitive accretion and finally the subclusters merge (eg. Testi et al. testi00 (2000), Clarke, Bonnell & Hillenbrand clarke00 (2000), Bonnell, Bate & Vine bonnell03 (2003), Bonnell & Bate bonnell06 (2006), Bonnell & Smith bonnell11 (2011)). Our observations reported here support this scenario. (However, note that precise radial velocity studies to understand the dymamics of the gas associated with this region are required for a confirmation). At least in “CI” and “CII”, the brightest objects in the infrared are seen close to the centres of the clusters hosting them. In “CIII” also, the brightest object seems to be located close to the centre of the elongated pattern of distribution of the reddened objects. WISE observations, though deep, lack the spatial resolution to resolve the members of the clusters at these large distances. More sensitive -band and thermal IR imaging with high angular resolution are required to understand the census and distribution of the young stars in these clusters. High angular resolution observations at sub-mm and mm wavelengths are also required to understand if there are younger members in these clusters than those we see at near-IR and to get a more detailed picture of the star and cluster forming activity in the cloud.
4 Conclusions
-
1.
At least two (and possibly four) young subclusters, embedded in a cloud are discovered in IRAS 07422. Narrow-band H2 1-0 S(1) line images reveal eight or more outflows from them.
-
2.
The most prominent and youngest cluster in this region is “CI”, associated with the IRAS source and the brightest of the MSX and AKARI sources. Multiple star formation is happening in “CI”; H2 line emission features observed in its vicinity are suggestive of at least six outflows produced by YSOs in “CI”. #1 is the most luminous object in this region. We derive a mass and luminosity of 10.7 M⊙ and 3.9103 L respectively by modelling its SED. This object appears to be very young and and is probably a Class-I protostar. High angular resolution observations at 11.2 m reveal three of the embedded sources in “CI”.
-
3.
Source #1 in “CI” is located close to an extinction lane, inclined at 53∘ east of north. A set of three H2 knots are seen aligned in a direction roughly perpendicular to the extinction lane. High angular resolution at mm wavelengths are reqired to understand if the extinction lane is a circumstellar disk seen nearly edge on.
-
4.
#8 is the brightest object in the near-IR, located in the second most prominent cluster in this region, “CII”. The second brightest object in the AKARI, WISE and MSX appears to be associated with this region, but the spatial resolution of any of these surveys is not sufficient to identify between #8 and any of its very close neighbours. There is an outflow detected from this cluster. It is not clear if #8 or any of it very close neighbours is responsible for the outflow. Modelling the SED of #8 yields a mass, luminosity and temperature of 6.7 M⊙, 1.4103 L and 19950 K respectively. This temperature is high even for a main sequence star of 6.7 M⊙ suggesting possible extra contributions to the flux at short wavelengths. The SED fit shows the four AKARI-FIS fluxes to be deviating systematically from the fit, with the residuals increasing towards longer wavelengths. These are suggestive of contribution from a colder component to the flux measured by AKARI. Cluster candidates “CIII” and “CIV” also host YSOs; “CIII” appears to host one or more outflows.
-
5.
Multiple star formation is taking place inside more than one sub-cluster within a cloud in this region. This region appears to be a case of hierarchical mode of cluster formation where massive star formation takes place in multiple sub-clusters in a cloud and the massive stars at the centres of the sub-clusters grow through competitive accretion.
-
6.
Observations at IR through mm wavelengths at better angular resolution are required for a more detailed understanding of the star formation activity in this cloud.
Acknowledgements.
The UKIRT is operated by the Joint Astronomy Centre on behalf of the Science and Technology Facilities Council (STFC) of the UK. The UKIRT-WFCAM data presented in this paper are obtained during the UKIDSS back up time. I thank the Cambridge Astronomical Survey Unit (CASU) for processing the WFCAM data, and the WFCAM Science Archive (WSA) for making the data available. The UKIRT-Michelle data are downloaded from the UKIRT archive. This work makes use of data obtained with AKARI, a JAXA project with the participation of ESA, downloaded from CDS, Strasbourg, France. We also use data products from the Wide-field Infrared Survey Explorer, which is a joint project of the University of California, Los Angeles, and the Jet Propulsion Laboratory/California Institute of Technology, funded by the National Aeronautics and Space Administration. WISE, IRAS and MSX images and photometry were downloaded from the NASA/IPAC Infrared Science Archive. I thank Jack Ehle and Thor Wold for carrying out the WFCAM observations. I also thank the referee Thomas Stanke and the editor Malcolm Walmsley for their comments and suggestions which have improved the quality of the paper.References
- (1) Beichman, C. A., Neugebauer, G., Habing, H. J., Clegg, P. E., Chester, T. J. 1988, iras, 1
- (2) Beuther, H., Schilke, P., Gueth, F., McCaughrean, M., Andersen, M., Sridharan, T. K., Menten, K. M. 2002, A&A, 387, 931
- (3) Bonnell, I. A., Bate, M. R., Zinnecker, H. 1998, MNRAS, 298, 93
- (4) Bonnell, I. A., Bate, M. R., Vine, S. G. 2003, MNRAS, 343, 413
- (5) Bonnell, I. A., Bate, M. R. 2006, MNRAS, 370, 488
- (6) Bonnell, I. A., Smith, R. J. 2011, IAUS, 270, 57 (in Computational Star Formation, Proc. IAU Symp No. 270, 2011, J. Alves, B. G. Elmegreen, J. M. Girart & V. Trimble, eds.)
- (7) Brand, J., Cesaroni R., Caselli P., et al. 1994, A&AS, 103, 541
- (8) Bronfman, L., Nyman, L. A., May, J. 1996, A&AS, 115, 81
- (9) Casali, M. et al. 2007, A&A, 467, 777
- (10) Clarke, C. J., Bonnell, I. A., Hillenbrand, L. A. 2000, Protostars and Planets IV, 151
- (11) Codella, C., Felli, M. 1995, A&A, 302, 521
- (12) Codella, C., Palumbo, G. G. C., Pareschi, G., Scappini, F., Caselli, P., Attolini, M. R. 1995, MNRAS, 276, 57
- (13) Davis, C J., Gell, R., Khanzadyan, T., Smith, M. D., Jenness, T. 2010, A&A, 511, A24
- (14) Felli, M., Palagi, F., Tofani, G. 1992, A&A, 255, 293
- (15) Glasse, A. C., Atad-Ettedgui, E. I., Harris, J. W. 1997, SPIE, 2871, 1197 (Proc. SPIE Vol. 2871, p. 1197-1203, Optical Telescopes of Today and Tomorrow, Arne L. Ardeberg; Ed.)
- (16) Goddi, C., Moscadelli, L., Alef, W., Tarchi, A., Brand, J., Pani, M. 2005, A&A, 432, 161
- (17) Kataza, H. et al. 2010, AKARI-IRC Point Source Catalogue Release note Version 1.0
- (18) Keto, E. 2007, ApJ, 666, 976
- (19) Lada, C. J., Adams, F. C. 1992, ApJ, 393, 278
- (20) Lada, C. J., Lada, E. 2003, ARA&A, 41, 57
- (21) Meyer, M. R., Calvet, N., Hillenbrand, L. A. 1997, AJ, 114, 288
- (22) Murakami, H. et al. 2007, PASJ, 59, S369
- (23) Palla, F., Cesaroni, R., Brand, J., Comoretto, G., Felli, M. 1993, A&A, 280, 599
- (24) Reid, M. J., Menten, K. M., Zheng, X. W., Brunthaler, A., Moscadelli, L., Xu, Y., Zhang, B., Sato, M., Honma, M., Hirota, T., and 4 coauthors 2009, ApJ, 700, 137
- (25) Rieke, G. H., Lebofsky, M. J. 1985, ApJ, 288, 618
- (26) Robitaille, T. P., Whitney, B. A., Indebetouw, R., Wood, K., and Denzmore, P. 2006, ApJS, 167, 256
- (27) Robitaille, T. P., Whitney, B. A., Indebetouw, R., Wood, K. 2007, ApJS, 169, 328
- (28) Slysh, V. I., Dzura, A. M., Val’tts, I. E., Gerard, E. 1997, A&AS, 124, 85
- (29) Slysh, V. I., Val’tts, I. E., Kalenskii, S. V., Voronkov, M. A., Palagi, F., Tofani, G., Catarzi, M. 1999, A&AS, 134, 115
- (30) Testi, L., Sargent, A. I., Olmi, L., Onello, J. S. 2000, ApJ, 540, L53
- (31) Tokunaga, A. T. 2000 (in Allen’s Astrophysical Quantities, p. 143, Springer-Verlag, Arthur N. Cox; Ed.)
- (32) Urquhart, J. S., Busfield, A. L., Hoare, M. G., Lumsden, S. L., Clarke, A. J., Moore, T. J. T., Mottram, J. C., Oudmaijer, R. D. 2007, A&A, 461, 11
- (33) Varricatt, W. P., A&A, 527A, 97
- (34) Varricatt, W. P., Davis, C. J., Ramsay, S., Todd, S. P. 2010, MNRAS, 404, 661
- (35) Whitney, B. A., Wood, K., Bjorkman, J. E., Cohen, M. 2003a, ApJ, 598, 1079
- (36) Whitney, B. A., Wood, K., Bjorkman, J. E., Wolff, M. J. 2003b, ApJ, 591, 1049
- (37) Wouterloot, J. G. A., Brand, J. 1989, A&AS, 80, 149
- (38) Wright, E. L., et al. 2010, AJ, 140, 1868
- (39) Yamamura, I., Makiuti, S., Ikeda, N., Fukuda, Y, Oyabu, S, Koga, T., White, G. J. 2010, AKARI-FIS Bright Source Catalogue Release note Version 1.0
- (40) Yorke, H., Sonnhalter, C. 2002, ApJ, 569, 846