Southern Africa CTA Site Proposal
P.P. Krüger and D.J. van der Walt
North-West University, South Africa
June 2011
Summary
Southern Africa has some of the world’s best sites for air Cherenkov telescopes. South Africa has only one viable site, which is south of Sutherland and also close to the Southern African Large Telescope (SALT). This site has very good infrastructure and is easy to access, but only 47% of the night-time has a cloudless sky usable for observations.
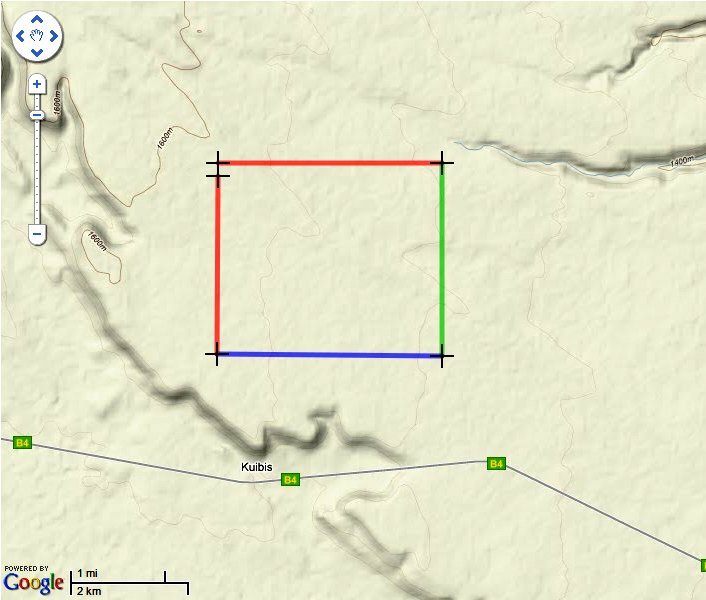
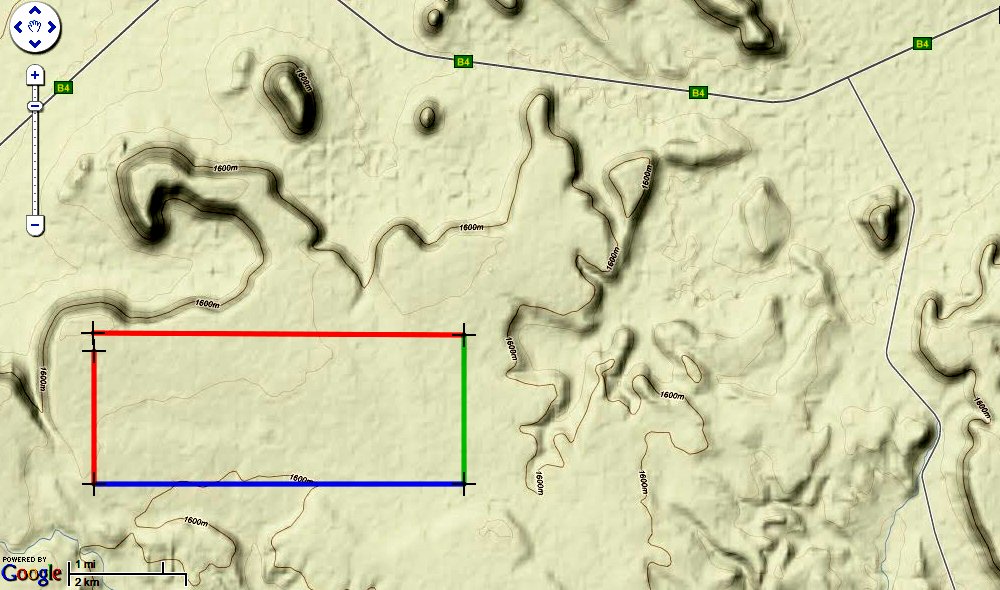
Namibia, which already hosts the H.E.S.S telescope, has a number of potential sites with much less cloud coverage. The H.E.S.S. site is one of the highest of these sites at 1840 m a.s.l. with about 64% of the night-time cloudless. It also has very low night sky background levels and is relatively close (about 100 km) to Windhoek. Moving further away from Windhoek to the south, the cloud coverage and artificial night sky brightness becomes even less, with the site at Kuibis (between Keetmanshoop and Luderitz) at 1640 m a.s.l. having clear night skies 73% of the time. Even though this site seems remote (being 660 km from Windhoek by road), it is close to the national B4 highway, a railway line, a power line and an optical fiber line. It is also less than two hours drive away from a harbour and national airports. The Namibian sites also receive very little snow, if any, and the wind speeds are less than 50 km/h for more than 90% of the time with maximum wind speeds of around 100 km/h. Seismically the whole Southern African region is very stable.
In view of the geographic advantage of Southern Africa for astronomy, the South African government is committed to multi-wavelength astronomy. The region around SALT and MeerKAT in the Northern Cape has been declared a protected region for astronomy and the government has already invested relatively large amounts of money into the SALT and MeerKAT/SKA projects. The government is also committed to uplifting the whole of Southern Africa and would support a proposed CTA site in Namibia. A number of research chair grants have been allocated to various universities, with the North-West University holding a chair in high-energy astrophysics to stimulate growth in gamma-ray astronomy. Currently, it is under the auspices of this chair that South Africa is part of the H.E.S.S. and CTA collaborations.

Chapter 1 Overview of Southern Africa
First the main CTA site specifications (CTA, 2010) of altitude, cloud coverage, flatness, night sky background and seismic events will be considered to evaluate potential CTA sites in Southern Africa. Thereafter, the economic and political conditions of South Africa and Namibia will be considered. The best sites in South Africa and Namibia, apart from the H.E.S.S site, will then be further investigated in Chapters 2 and 3.
1.1 Height and cloud coverage
| Site | 1) Sutherland | 2) Kuibis | 3) Maltahohe | 4) H.E.S.S. | |
|---|---|---|---|---|---|
| Height | m a.s.l | 1560 | 1640 | 1700 | 1840 |
| Cloud cover | % | 32.4 | 13.3 | 18.0 | 21.2 |
| Time clear sky | % | 46.5 | 73.0 | 70.3 | 64.4 |
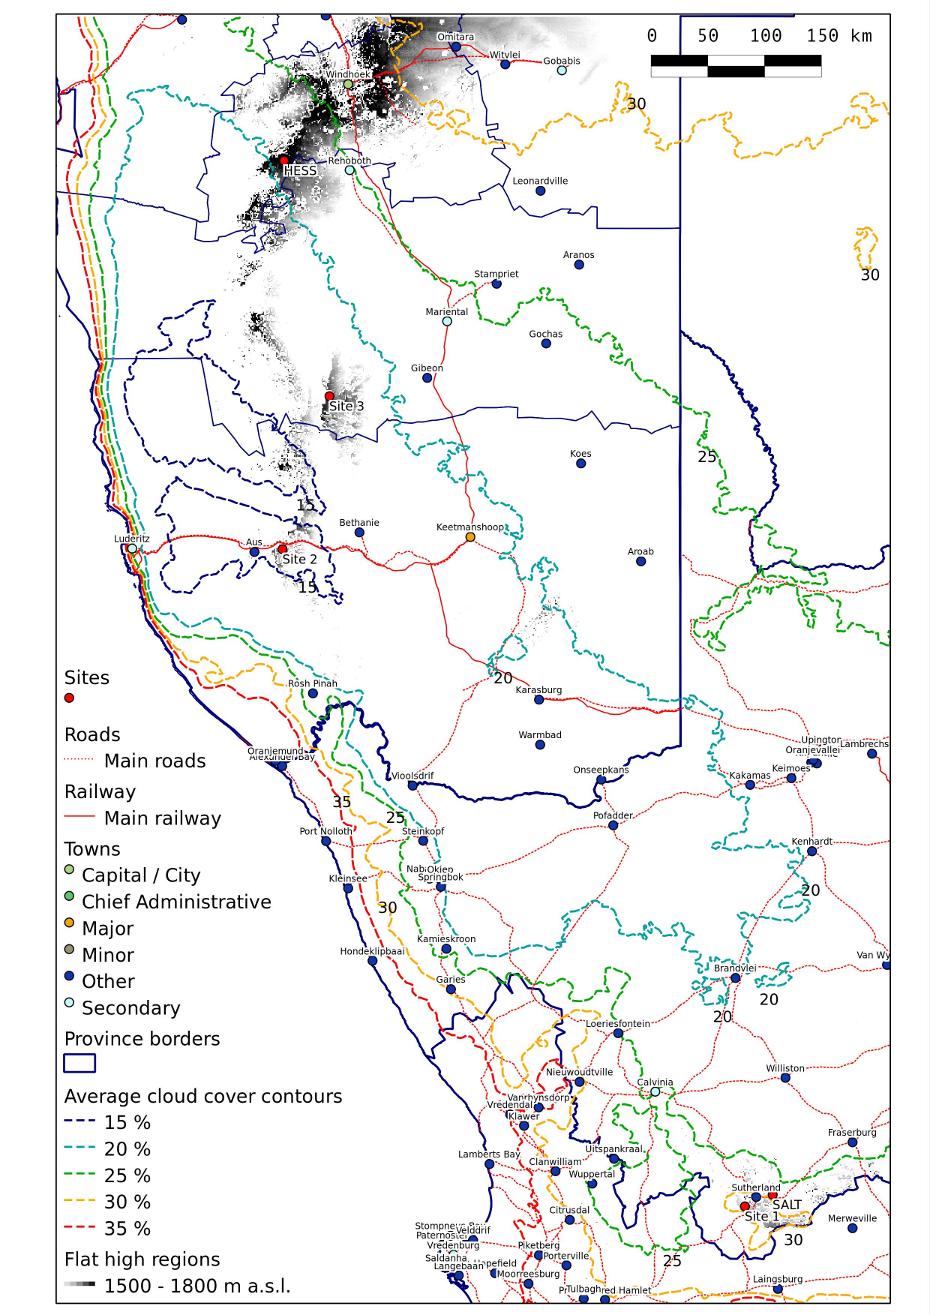
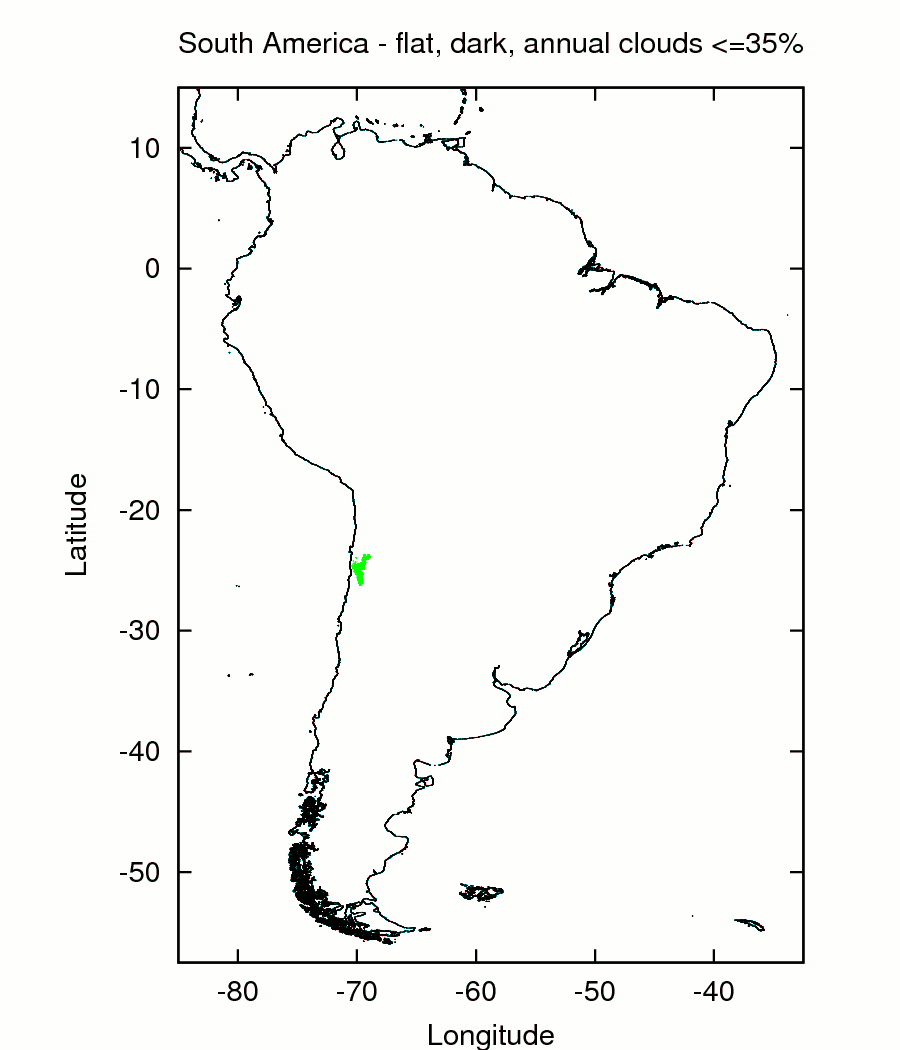
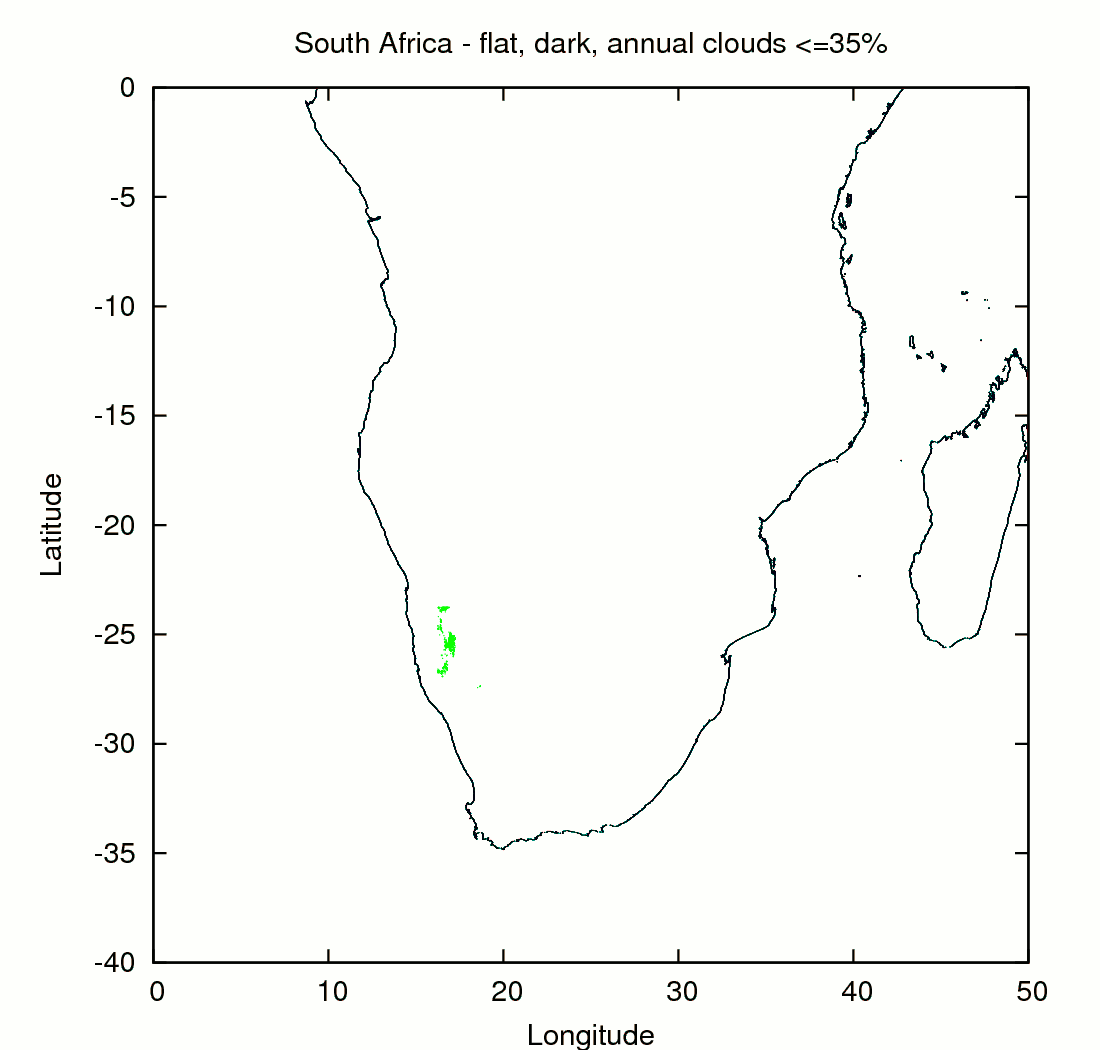
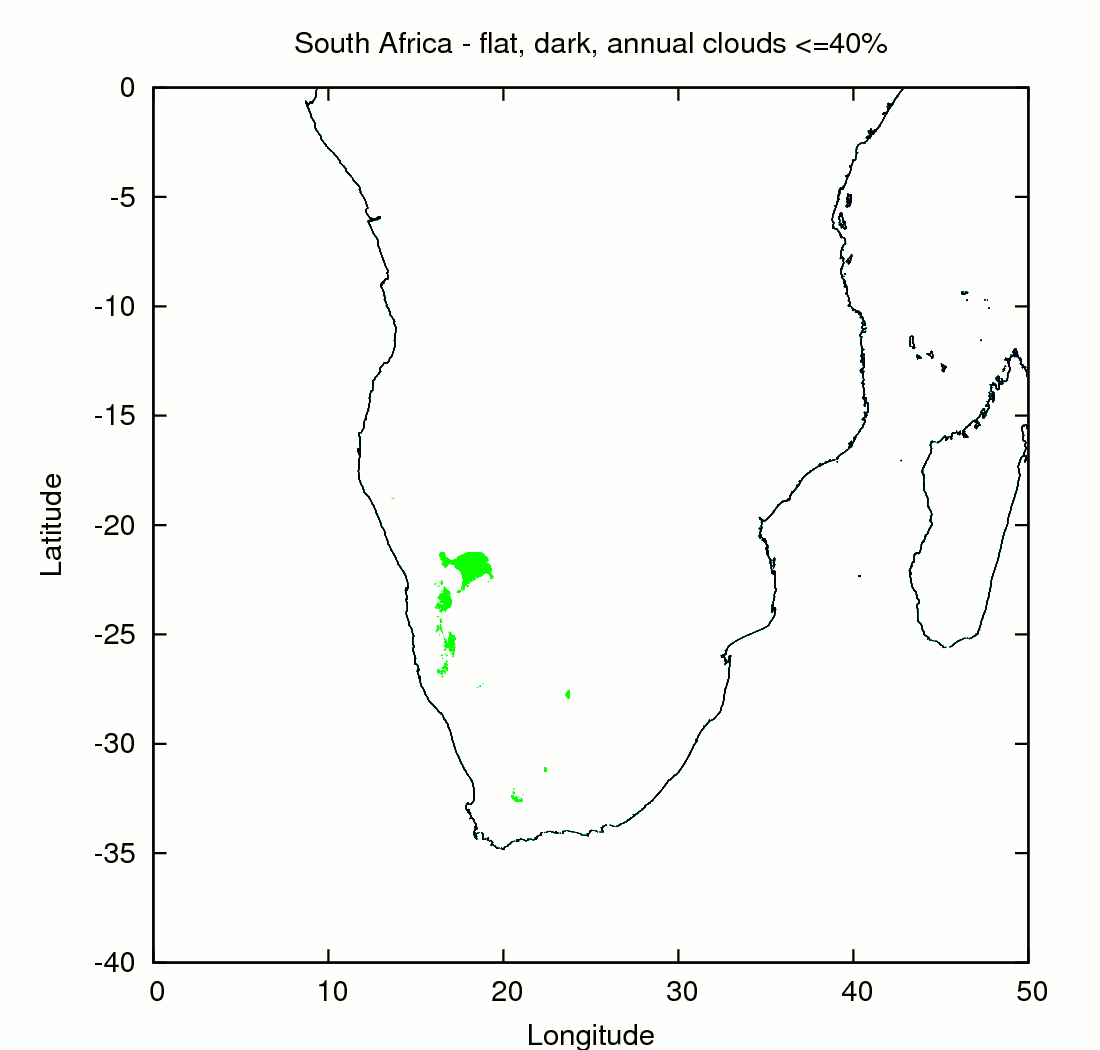
CTA-south requires flat sites (less than 150 m variation) of 10 that have an altitude of between 1500 m and 3800 m in the southern hemisphere with more than 70% of nights suitable for observation (CTA, 2010). The global CTA site search by Bulik et al. (2009) only gave a number of sites along the west coast of Southern Africa and along the west coast of Chile that meets the geographic criteria and has an annual cloud coverage of between 30% and 35% and between 35% and 40%, as shown in Figure 1.8.
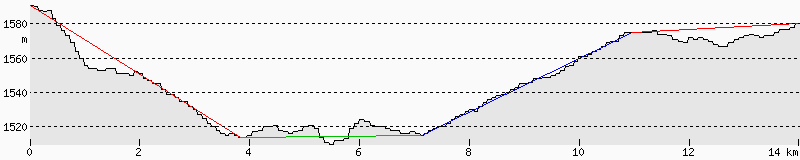
However, Bulik et al. (2009) used the annual cloud coverage compiled by the International Satellite Cloud Climatology Project that has a pixel size of about 2.5 by 2.5 degrees in longitude and latitude. To obtain more detailed cloud coverage maps of Southern Africa, the 5 by 5 km cloud fraction data given by the MODIS cloud data product for the years 2001 to 2010 are used11endnote: 1The satellite data were projected on a grid (about km) using nearest neighbour interpolation. The sky was assumed clear if all the pixels within a radius of (about 5 km) were clear. The satellite data consist of only one or two observations per night. Because there are more dark hours in winter that in summer, each night was weighted with the length of the night (using astronomical twilight), which was calculated using the CBM model of Forsythe et al. (1995). The cloud coverage of each year from 2001 to 2010 is calculated separately. The average and standard deviation on the average is then calculated using the 10 cloud coverage maps.. Figure 1.1 shows the average nightly cloud coverage along the west coast of Southern Africa. Flat regions (with a gradient of less than two degrees to neighbouring points) that are higher than 1500 m a.s.l. are also shown22endnote: 2The same GTOPO30 data with a (about 1 km) resolution are used as used by Bulik et al. (2009). . It can be seen that there are only four regions of interest: (1) Sutherland as the only region in South Africa, (2) the region between Luderitz and Keetmanshoop that has the fewest clouds, (3) the region in the middle of Namibia and (4) the large region south of Windhoek which has the highest altitudes and where H.E.S.S. is located. The altitude and cloud coverage of the four regions are given in Table 1 and the three Namibian regions are shown in more detail in Figure 1.2.
The first two regions seem to be the best regions in South Africa and Namibia respectively and will be discussed in more detail in the next two chapters.
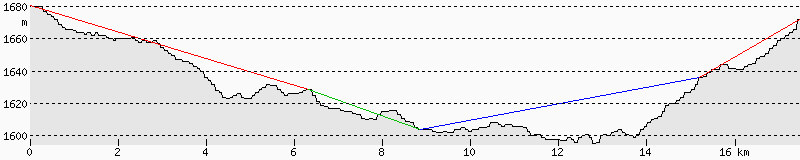
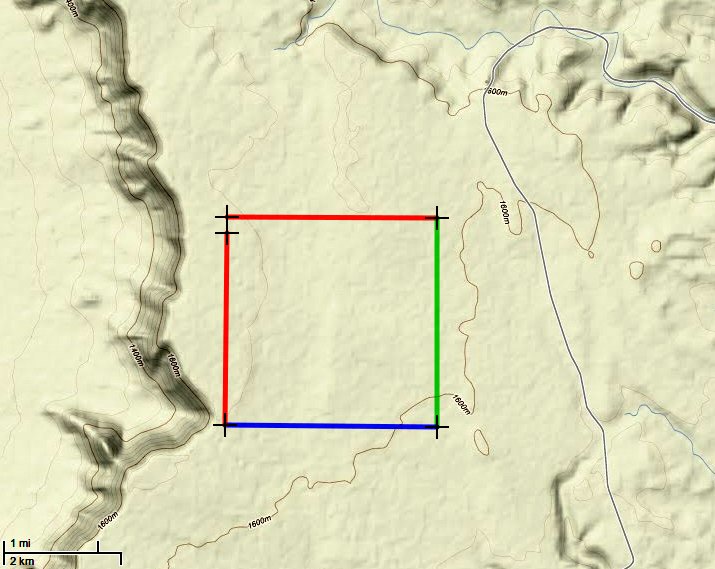
The third region has slightly more clouds than region 2 and is slightly higher (as shown in Figure A), but is more difficult to access (accessible from Maltahohe by the C14) and has much less infrastructure. This site will therefore not be further considered.


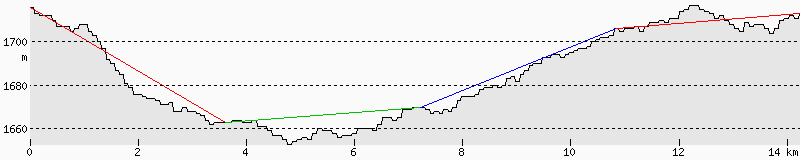
The fourth region is in the highlands south of Windhoek where H.E.S.S. is located. In general, the altitude becomes lower to the south-east and the cloud coverage becomes less to the west. The position of H.E.S.S. seems like a good compromise, with an altitude of 1840 m and clear skies 64% of the time. However, the flat areas above 1800 m in the region of H.E.S.S. are not as flat as the other regions (see Figure A.5). There is a number of flat areas to the south between 1700 m and 1800 m a.s.l. (for example area A shown in the figure at 1720-1780 m a.s.l.). Because the H.E.S.S. region is already well known, this region will not be considered further, but will be used as a reference when considering the first two regions.
1.2 Night Sky Background
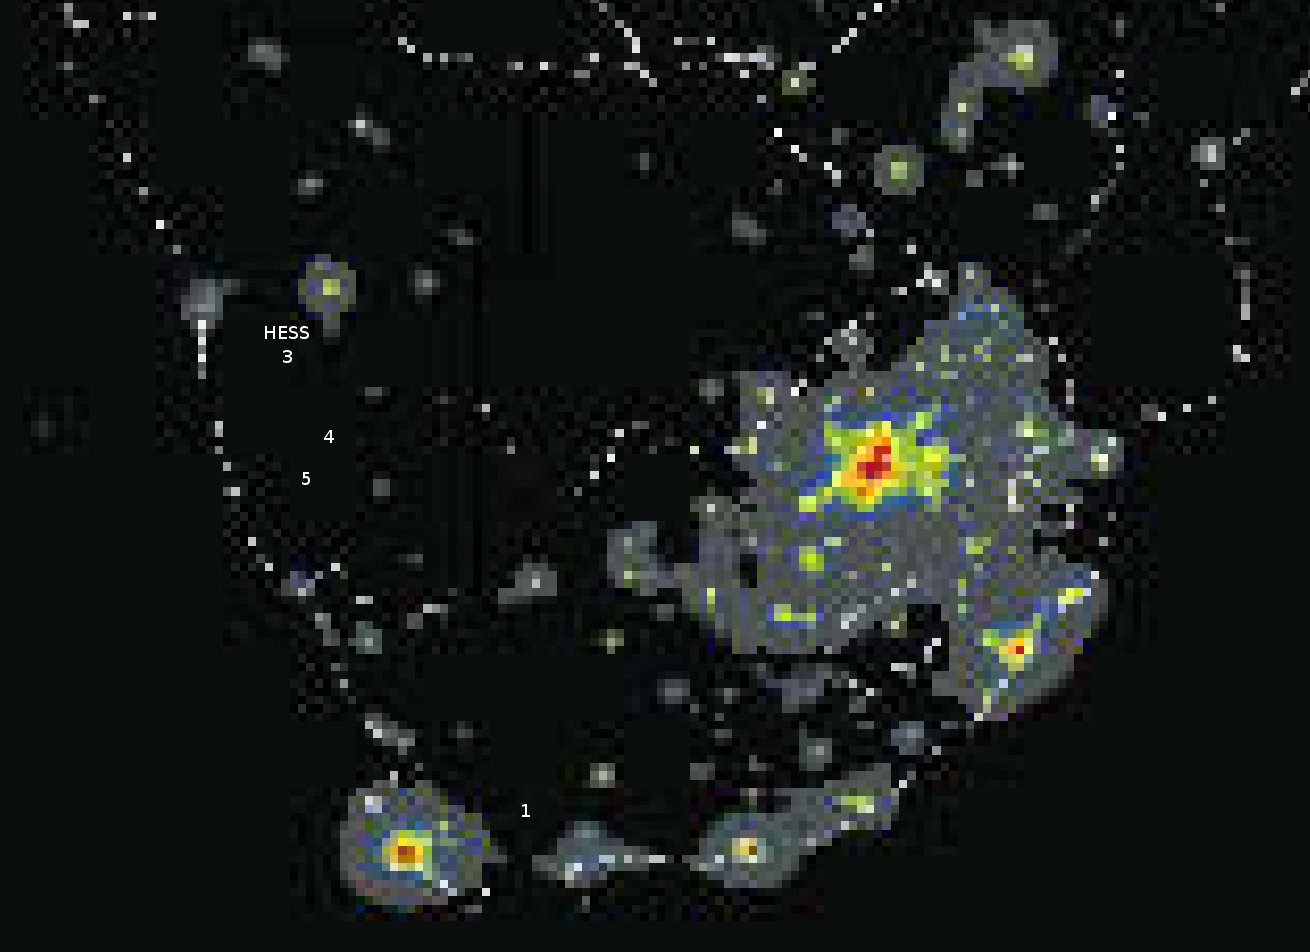
The artificial night sky brightness for almost the whole of Namibia, as well as the Northern Cape province, is very low as can be seen from Figure 1.4, due to the low population density of these regions (Figure 1.5). What is also important is the distance from the site to large towns or cities, as this influences the zenith angle at which the scattered light from the towns will influence the night sky background. For example, H.E.S.S. is just over 100 km away from Windhoek and Preuss et al. (2002) found that at the H.E.S.S. site the night sky background light is independent of the zenith angle, for zenith angles up to . However, Windhoek is still close enough to have an effect as can be seen from Figure 1.4. The Namibian regions south of H.E.S.S. (regions 2 and 3) are much farther from any large town (see Figure 1.5) and will therefore be even darker at large zenith angles. Region 1 in South Africa is at about the same distance from the light pollution of the Western Cape than H.E.S.S is from Windhoek, and its background properties are therefore expected to be similar, if not slightly worse, than H.E.S.S.

1.3 Seismic events
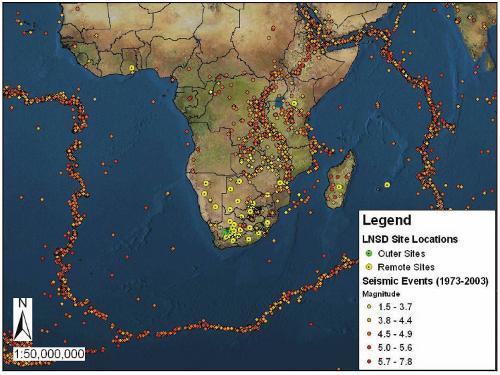
Southern Africa lies in the middle of a continental plate as shown in Figure 1.6, resulting in the Northern Cape and Namibia being seismically very stable. The events in the north-eastern region of South Africa are relatively small and due to mining activities.
1.4 Political and economic conditions
Both South Africa and Namibia are politically and economically stable as can be seen from the World Bank reports (Appendix B.1 and B.2) and the Euler Hermes country risk profiles (Appendix B.3) of the two countries. Due to the strong South African economy, living costs in Southern Africa are comparable, or even cheaper, than the costs in developed countries. According to the latest cost-of-living survey done by Mercer33endnote: 3http://www.mercer.com/costoflivingpr, Windhoek is given as the tenth cheapest city out of 214 across the world, with Johannesburg and Cape Town ranked 64th and 44th cheapest. More detail concerning the cost of water, electricity, transportation, fuel, telecommunication, human resources (including information on the labour act) and taxation in Namibia for different regions is given by the Namibia Investment Centre (2008).
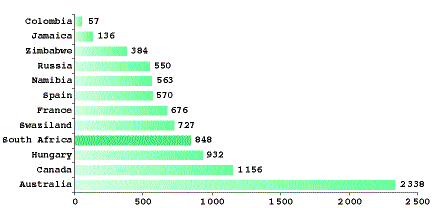
Apart from criminality, the four possible CTA sites are relatively safe regarding natural disasters, wild animals and regional diseases. Based on the Interpol statistics44endnote: 4http://www.iss.co.za/pubs/CrimeIndex/01Vol5No1/World.html given in Figure 1.7, South Africa has high levels of property crime and extraordinary high levels of violent crime. Namibia has lower crime figures, but is not far behind South Africa with regard to violent crimes. There are conflicting claims that the crime in both countries have significantly decreased or increased during the last decade. Crime statistics for South Africa are readily available (e.g. at http://www.saps.gov.za), but the statistics for Namibia is not publicly available. The latest crime statistics for the Sutherland region (with a population of about 2000) seem to be similar to that reported by Interpol. The Sutherland police station reported a yearly average (for the period March 2003 to March 2010) of 3 murders per year (143/100k), 12 cases of serious assault (560/100k) and 41 cases of theft (2k/100k). Table 1.2 gives some recent crime statistics for the Karas region (site 2) as given by the police commissioner of the Karas region, Josephat Abel55endnote: 5http://mobi.namibiansun.com/story/karas-reports-decline-crime, which is also similar to that reported by Interpol.
However, it is important to note that most of the crimes are concentrated in economically disadvantaged areas and that, due the remoteness and low population density of the possible CTA sites in Namibia, the crime in these regions is much lower than the national average.
| Year | 2009 | 2010 |
|---|---|---|
| Total (per 100k) | Total (per 100k) | |
| Serious assault | 885 (1264) | 511 (730) |
| Common assault | 776 (1109) | 420 (600) |
| Murders | 28 (40) | 12 (17) |
1.5 Astronomy in Southern Africa
The major astronomy facilities in Southern Africa are:
- South African Astronomical Observatory
-
(SAAO) in Cape Town and Sutherland, South Africa, is the premier optical/infrared astronomy facility in Africa and plays a leading role in the promotion of astronomy on the continent. SAAO promotes fundamental research in astronomy and astrophysics at a national and international level through the provision and utilisation of a world-class astronomical facility.
- Southern African Large Telescope
-
(SALT) at Sutherland, South Africa, is the largest single telescope in the southern hemisphere and will enable astronomers to be internationally competitive in ground-based astronomy well into the 21st century. SALT provides a first-class facility for fundamental research in Africa.
- Karoo Array Telescope
-
(MeerKAT) is a SKA prototype telescope that will consist of a 64 dish radio telescope array in the Northern Cape, with seven 12 m dishes (KAT-7) planned to be operational by mid-2012.
- Hartebeesthoek Radio Astronomy Observatory
-
(HartRAO) close to Johannesburg, South-Africa, is the only major radio observatory in Africa (prior to MeerKAT), having a 26m-diameter centimeter-wavelength radio telescope. The facility also supports an active program of space geodesy, including operation of a Satellite Laser Ranger (SLR) and a GPS network.
- High Energy Stereoscopic System
-
(H.E.S.S.) in Namibia is the largest and most sensitive gamma-ray telescope in the world.
- Square Kilometre Array
-
(SKA) project has short-listed South Africa, together with Australia, as potential host countries. A final decision in this regard is expected in 2012. This will be by far the biggest radio telescope in the world, and in many ways the largest terrestrial astronomical endeavour ever attempted.
There are only 101 people (Oct. 2010) with a PhD working in the field of astronomy, distributed across 13 institutions. The National Research Foundation (NRF) are therefore placing much emphasis on human capital development in Astronomy:
“Astronomy has received high priority status in South Africa. Major projects in support of this include Southern African Large Telescope, H.E.S.S. and the efforts relating to KAT and Square Kilometer Array (SKA). The country runs the risk of not being able to fully utilise or maximise the benefits from these facilities, owing to a lack of adequate human capital. This risk implies that that the country may own the hardware, but will be subject to a form of “knowledge colonisation” from international quarters, many of whom already possess a critical mass of requisite skills.” 66endnote: 6http://www.nrf.ac.za/projects.php?pid=54
South Africa has a DST/NRF research chair (SARChl) initiative, which is a brain-gain and research capacity-development intervention by the Department of Science and Technology (DST) that is being administered by the National Research Foundation (NRF). It is geared towards the development of high-level human capital to support key areas of competency in South Africa. Currently there are a number of chairs in astronomy, including astrophysics and space physics, multi-wavelength extragalactic astronomy and radio astronomy.
The International Astronomical Union’s Office for Astronomy Development is also hosted by South Africa.
"I am particularly pleased that our Executive Committee chose South Africa and the South African Astronomical Observatory. South Africa is a role model for us because it combines world-class astronomical research facilities with a pioneering programme of astronomical outreach." Prof George Miley, IAU Vice President for Development and Education.
"The National Research Foundation is pleased to host this office, which is significant not only for South Africa and Africa but for the entire developing world. We are pleased to be associated with this effort to use astronomy to foster education and capacity building globally over the next decade at least. Astronomy remains one of the sources of inspiration for young people who take up careers in science and technology and go on to contribute positively in society. We are looking forward to working with the astronomy community in developing interest in astronomy and science and technology in general" Dr Albert van Jaarsveld, President and CEO of the National Research Foundation.77endnote: 7http://www.saao.ac.za/no_cache/public-info/news/news/article/185/
1.5.1 South African Government’s commitment to astronomy
In the above-mentioned projects, South Africa has invested heavily in astronomy (compared to the size of the economy).
“We chose to invest heavily in science and astronomy, because of its role in development, not only within South Africa, but all across Africa. Big astronomy projects such as SALT, MeerKAT and SKA entail major capacity development programmes in order to train the next generation of engineers and astronomers from all over Africa. In South Africa, people in the astronomy field, from those working on the ground to the highest levels of government, share the vision that astronomy will play a significant role in the development of society.” (South African Science and Technology Minister, Naledi Pandor, at the launch of the International Astronomical Union Global Office of Astronomy for Development at the headquarters of the SAAO in Cape Town this year.)
The Department for Science and Technology has launched the Astronomy Geographic Advantage Programme (AGAP) with the aim to use the excellent viewing conditions on the sub-continent and the depth of engineering and scientific talent available here to attract international astronomy projects to our region. Major successes thus far have been the H.E.S.S. telescope in Namibia and SALT in Sutherland. The SKA project, if successful would be the jewel in the crown of AGAP.
1.5.1.1 Astronomy Geographic Advantage Bill
“The [Astronomy Geographic Advantage Bill] gives the Minister of Science and Technology the power to declare astronomy advantage areas in order to ensure that large-scale and globally important astronomy facilities are protected from developments that might interfere with their research activities.
The benefits of the legislation include the protection of large-scale investments already made in astronomy; the preservation of an environment for a global astronomy hub that will continue to attract international investment; and the provision of a competitive advantage to help South Africa become the preferred host of the full Square Kilometre Array (SKA) in the Northern Cape province, also home to the Southern African Large Telescope (SALT), the largest single optical telescope in the Southern Hemisphere.
To do this, the Act provides for:
-
•
Developing the skills, capabilities and expertise of those engaged in astronomy and related scientific endeavours in Southern Africa.
-
•
Identifying and protecting areas in which astronomy projects of national strategic importance can be undertaken.
-
•
The declaration and management of astronomy advantage areas.
-
•
Providing a framework for the establishment of a national system of astronomy advantage areas to ensure that geographic areas highly suitable for astronomy and related scientific endeavours owing, for example, to their high atmospheric transparency, low levels of light pollution, low population density or minimal radio frequency interference are protected, preserved and properly maintained.
-
•
Enhancing the country’s geographic advantage by restricting activities that cause or could cause light pollution or radio frequency interference, or might interfere in any other way with astronomy and related scientific endeavours in these areas. “ (Statement issued by the Department of Science and Technology, June 200888endnote: 8http://www.info.gov.za/speeches/2008/08062609451003.htm)
1.5.2 Multi-wavelength astronomy
With the planned commissioning of MeerKAT in 2013, Southern Africa will host a world-class radio (MeerKAT), optical (SALT) and gamma-ray (H.E.S.S.) telescope. This opens a unique opportunity to simultaneously observe variable sources across the three wavelengths, making true multi-wavelength astronomy possible. Below are a few examples of the study of astrophysical sources within a multiwavelength context given by Venter (2011). These example shows how multiwavelength observations result in a complementary approach for source discovery, as well as to disentangle details of particle injection, acceleration, transport, and radiation within these sources.
1.5.2.1 Pulsars
The high-energy (HE) astrophysics domain was revolutionized by the launch of Fermi Large Area Telescope (LAT) on 11 June 2008. The second Fermi Catalog is in production and contains nearly 1,900 gamma-ray sources. Among the numerous discoveries are almost 100 gamma-ray pulsars. Almost a third of these have been found using blind periodicity searches in the gamma-ray data at a priori source positions. Follow-up observations in the radio found pulsations from only three of these, and radio upper limits for 23 more. This means that the bulk of these gamma-ray-selected pulsars is still radio-faint, either due to beaming effects, or intrinsically weak radio emission properties. Deep searches with (future) radio telescopes such as MeerKAT and SKA in the Fermi LAT radio-faint pulsar error boxes may reveal weak radio emission and thus discover more radio pulsars. This will impact pulsar population modelling, since one important prediction of such models is the fraction of radio-quiet (Geminga-like) pulsars.
A number of millisecond pulsars (MSPs) have now been found by observing non-variable, unassociated Fermi sources at high latitudes with radio telescopes and searching for pulsed radio signals. This is in contrast to the traditional method where gamma-ray data in the direction of known radio pulsars are searched using the radio ephemeris. These discoveries suggest a new mode of discovery, and future radio follow-up of Fermi unidentified bright sources with pulsar-like spectra may lead to many more (millisecond) pulsar discoveries.
The detection of many gamma-ray pulsars for the first time affords the opportunity for true multiwavelength modelling. One example is being able to constrain the pulsar geometry (inclination and observer angles and ) using complementary approaches: radio light curve as well as polarization swing data and application of the rotating vector model provide constraints on and , while geometric gamma-ray and radio light curve modelling provide additional constraints on and . Further constraints on may be derived using X-ray PWN data.
Previous predictions of low inverse Compton VHE components for certain pulsar parameters, as well as HE spectral fits with cutoffs around a few GeV for all of the current Fermi pulsars impacted negatively on expectations for VHE emission from pulsars. However, a very recent detection of the Crab pulsar at several hundred GeV by the VERITAS Collaboration now suggests that pulsar science may indeed be possible using ground-based Cherenkov telescopes. The lower energy threshold of CTA will greatly aid in constraining the spectral shapes and therefore magnetospheric properties such as the electric field and radius of curvature of particle orbits.
1.5.2.2 Active Galactic Nuclei
The active galaxy PKS 2155-304 was among the first sources detected by H.E.S.S., and an extreme gamma-ray outburst at 10 times the usual flux level was reported subsequently. This BL Lac object has furthermore been observed in follow-up multiwavelength campaigns. The first of these involved H.E.S.S., the Rossi X-ray Timing Explorer (RXTE) satellite, the Robotic Optical Transient Search Experiment (ROTSE), and the Nançay Decimetric Radio Telescope (NRT). During this campaign, the object appeared to be in a quiescent state, exhibiting flux variability in all wavebands, flux-dependent spectral changes in the X-rays, and also a transient X-ray event with a 1,500-second timescale. During a second campaign, Fermi LAT provided MeV to GeV coverage, while the ATOM telescope and RXTE and Swift observatories provided concurrent optical and X-ray observations. This time, the object was in a low X-ray and VHE state, but the optical flux was relatively high. There was a clear correlation of optical and VHE fluxes (hinting at a common parent particle population), and a possible correlation between the X-ray flux and HE spectral index, but none between the X-ray and VHE components (in contrast to what is seen in many other blazars).
This example indicates how vital simultaneous observations in various energy regimes are to help constrain the source properties. In particular, an optical telescope such as SALT, with its superior sensitivity, allows probing of polarization variations with time. This will help to distinguish between multiple active emission sites, and constrain their structure, location, geometries, environments, evolution, local magnetic field properties, and the particle acceleration and cooling processes, as well as guide construction of future multizone models. In addition, SALT spectroscopy and images will allow identification of new high-redshift AGN associated with high-latitude unidentified, variable Fermi sources.
1.5.2.3 Astrophysical Lepton and Hadron Colliders
SNRs have long been thought to be accelerators of hadronic CRs. However, electrons are also believed to be accelerated to very high energies in these systems. Gamma-ray signals from such SNRs may therefore originate from either hadronic or leptonic CRs interacting with ambient matter, soft radiation fields, or electromagnetic fields – or a combination of both – and it is difficult to discriminate between the two scenarios. One example is the H.E.S.S. detection of VHE flux in the direction of the old W28 SNR, known to be interacting with surrounding molecular clouds along its north and northeastern boundaries. The gamma-ray flux revealed a partial correlation with the radio emission, but a good correlation with NANTEN ) data. The gamma-ray flux therefore follows the molecular gas structure, probably pointing to interaction of hadronic CRs with the target material in this case.
Fermi has also begun to contribute to the debate of the relative contribution of hadronic vs. leptonic parent populations to the observed gamma-ray signals from several SNRs. However, Fermi source identification and characterization suffer significantly from contributions of the diffuse, structured Galactic gamma-ray background that traces molecular clouds near the Galactic Plane, while this diffuse background is very faint at TeV (H.E.S.S. and CTA) energies. MeerKAT’s survey potential will discover new resolved sources of energetic particles (e.g. SNRs and colliding winds), so that a combination of MeerKAT, H.E.S.S. / CTA, and CO observations should resolve many more hadron colliders in the Galactic Plane, thereby constraining the origin of VHE signals from several more sources.

Chapter 2 Sutherland, Northern Cape, South Africa
2.1 Geography
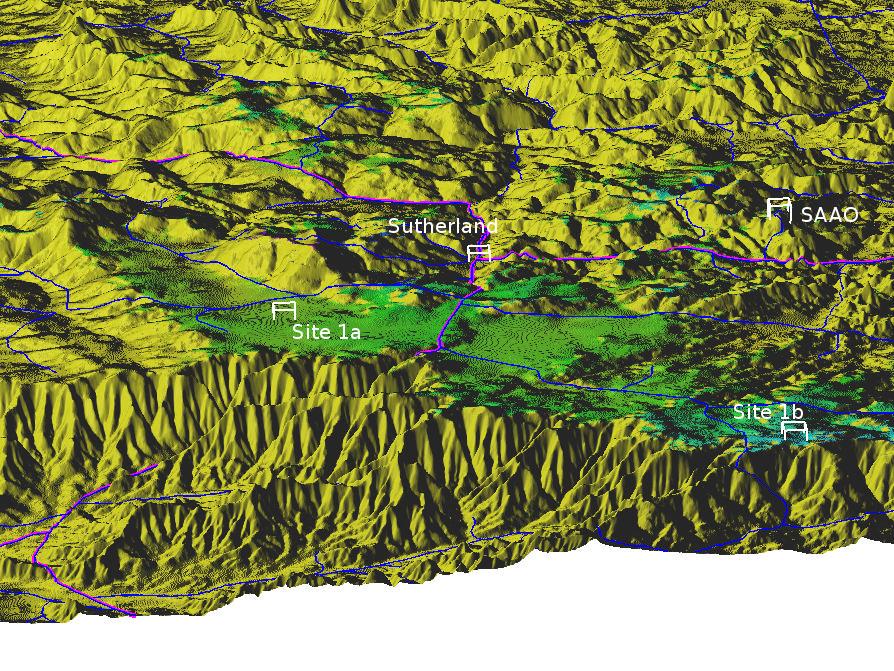
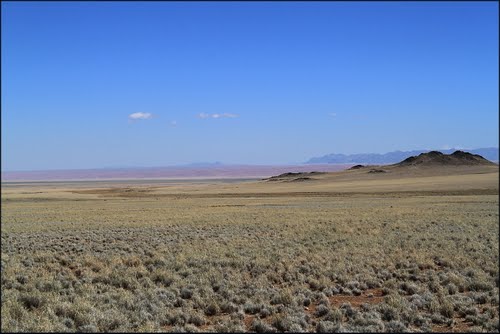
South of the town Sutherland, just above the escarpment, is a large flat region as shown in Figure 2.1. The region is about 1660 m a.s.l. in the east (1b) and drops gradually to about 1500 m a.s.l. in the west, with the large flat region (1a) just west of the main road at about 1560m. Note that the western side is more flat that the eastern side. Figure 2.9 is a photo of region (1a).
2.2 Cloud coverage
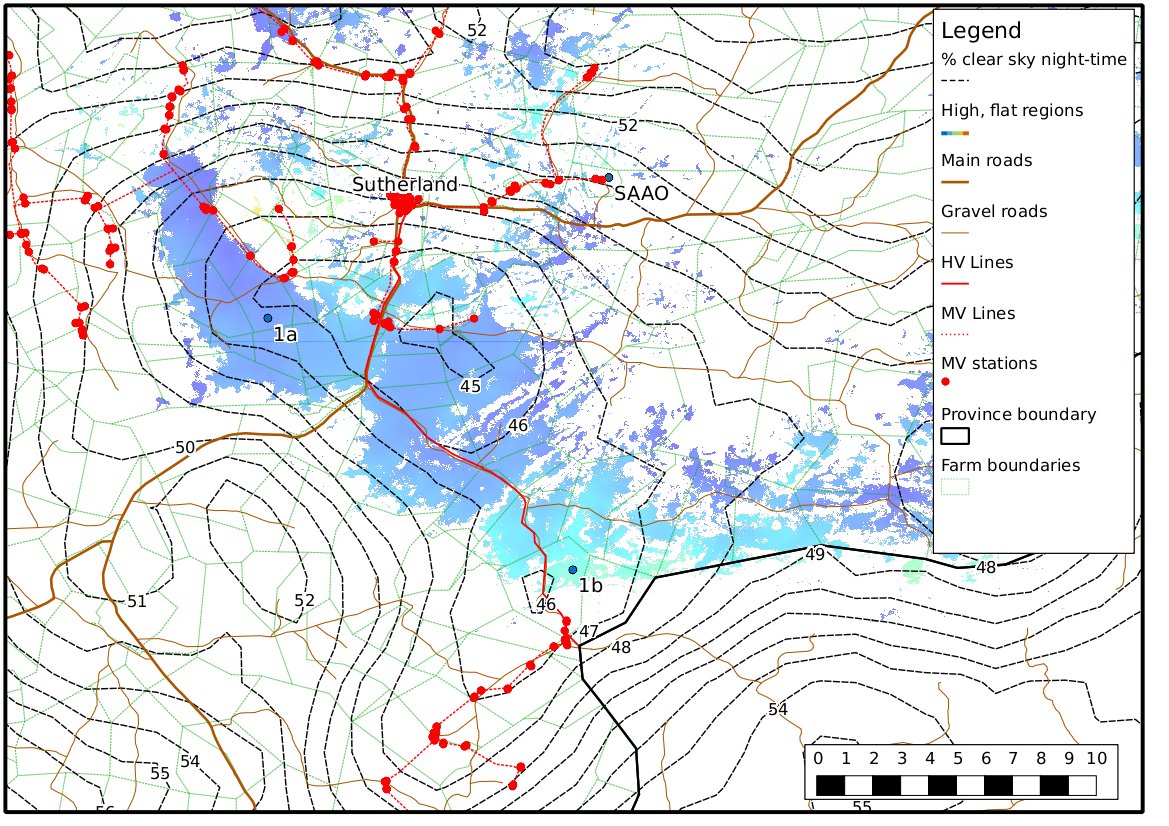
Figure 2.2 shows the cloud coverage contours of the region. It can be seen that the flat region just above the escarpment is actually more cloudy than the surrounding area, such as SAAO where the SALT optical telescope is located.
| Sutherland | Site 1a | Site 1b | SAAO | ||||
|---|---|---|---|---|---|---|---|
| Obs: 6h | Obs 18h | Satellite | Logs | ||||
| % Cloud cover | 31.11.4 | 29.41.3 | 30.2 | 32.4 | 32.9 | 29.0 | |
| % Time clear sky | 47.72.9 | 43.72.5 | 48.3 | 46.5 | 46.0 | 49.9 | 52.31.0 |
In order to obtain satellite cloud coverage maps, a lot of data processing must be done and a number of assumptions must be made. This sometimes leads to large systematic differences between different satellite cloud coverage maps. It is therefore important to compare satellite data with ground-based observations. To do this, the manual day-time observations of the Sutherland weather station99endnote: 9The SYNOP (surface synoptic observations) data of the Sutherland weather station at 8:00 and 20:00 for each day from 2001 to 2010 were used. Each record reports the cloud coverage in eighths. and the telescope logs of three optical telescopes at SAAO were used1010endnote: 10The photometric hours reported by the observation logs filled in by the users of the 20”, 30” and 40” telescope at SAAO were used for the years 2005 to 2010. However, not all the telescopes were used every night, usually due to bad weather or technical problems. Different observers also estimated the number of photometric hours differently. To estimate the number of photometric hours for each night, the average was taken of the reported hours of the telescopes that was used. Therefore, if a telescope did not report photometric hours, but the others did, it was excluded from the average. However, when none of the telescopes reported photometric hours, it was assumed that there were no photometric hours that night. When there was a large difference between the reported hours, the night was flagged and the difference investigated and corrected for when possible. However, it was found that these differences contributed less than 1% to the yearly photometric hours. Some nights reported more photometric hours than the number of hours between astronomical twilight. In order to compare the hours with that of Harding (1974), the calculated photometric hours were clipped to the number of available of hours, whenever is was larger. This however, slightly biases the results toward a larger percentage of photometric time.. The satellite and ground-based observational cloud coverage is given in Table 2.1, showing that the satellite data do not seem to have large systematic errors. The 52% clear time for SAAO also corresponds to the 51% reported by Harding (1974). Note that the cloud coverage of Sutherland was underestimated Bulik et al.’s search (2009), with the non-clear time of 50% being much larger than the range 35-40%. The reason for this is that the much less cloudy Northern Cape to the north was on the same grid point.
2.3 Weather conditions
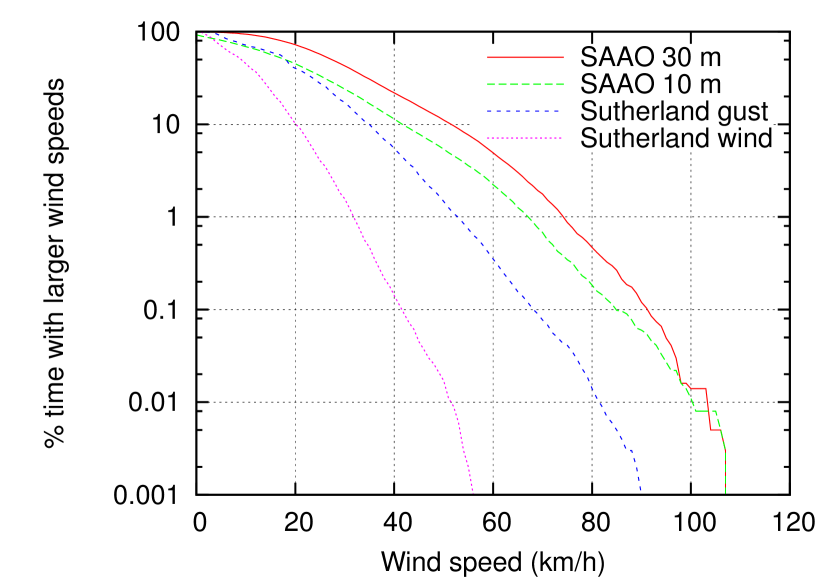
A lot of weather data are available for the Sutherland region, due to the weather stations at Sutherland and SAAO1111endnote: 11The Sutherland weather station’s five minute interval average and gust wind speeds from Nov 2006 to Mar. 2011 and SAAO’s ten minute interval wind speeds at 10m and 30m from Apr 2008 to Apr. 2009 were used.. Figure 2.4 shows that all the recorded wind speeds were less than 110 km/h. Sutherland is shielded by the surrounding hills (see Figure 2.1) resulting in lower wind speeds there than at the SAAO, which is on top of a hill. The wind speed measured on the 30 m mast at SAAO is also larger than on the 10 m mast, but is still less than 50 km/h for 89% of the time. It is expected that the wind at the proposed region will be similar to that at the SAAO.
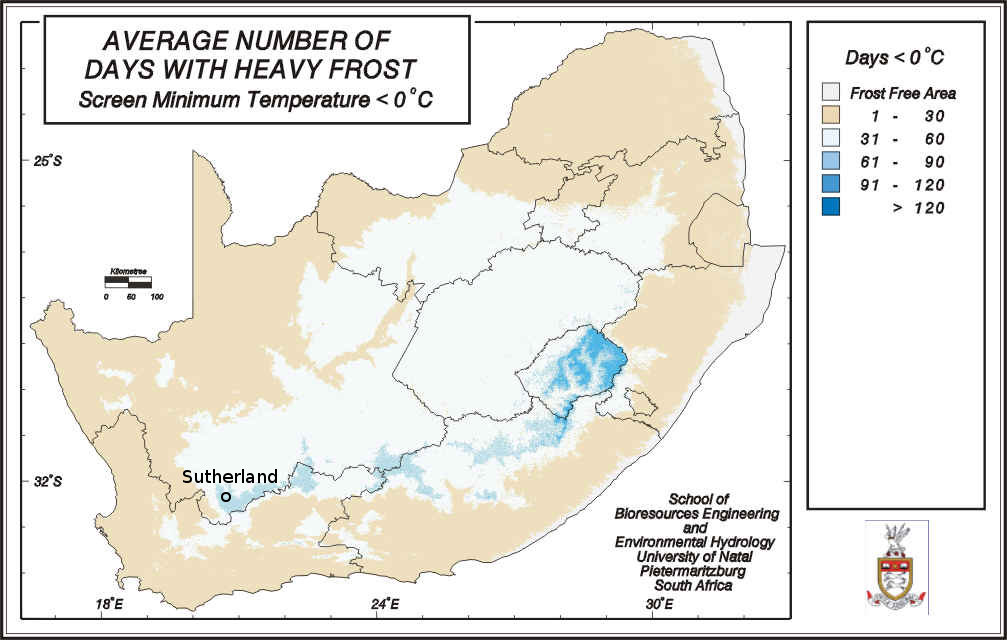
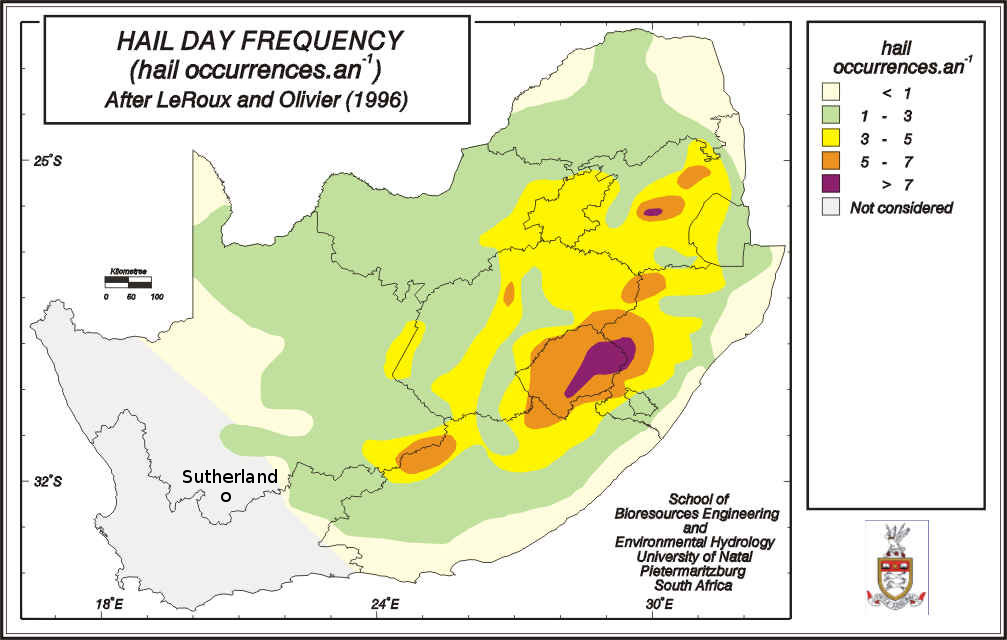
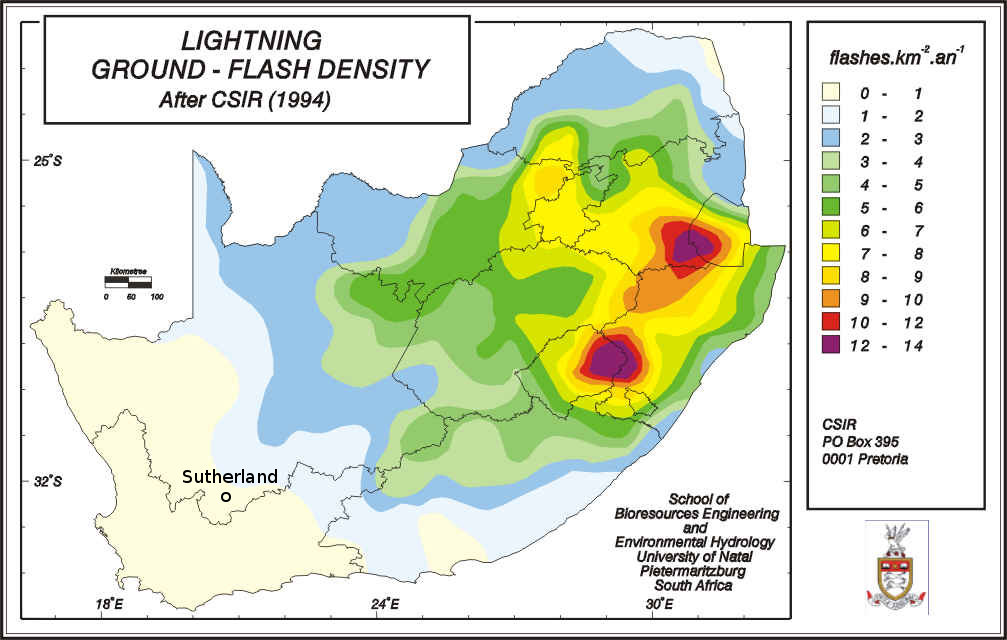
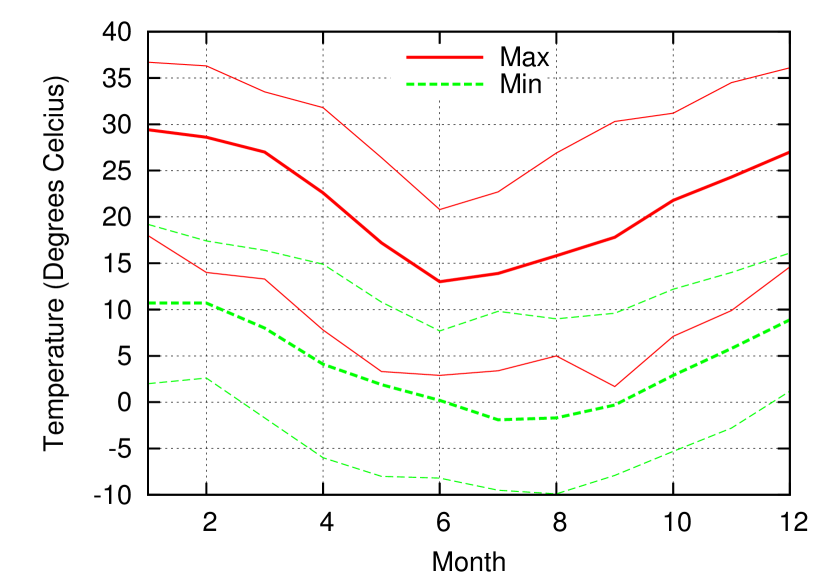
Figure 2.8 shows the average of the daily minimum and maximum temperatures for each month at Sutherland. Because the daily minimum temperature of Sutherland is normally below freezing point in the winter, Sutherland receives a large amount of heavy frost per year (Figure 2.4). The probability of natural hazards is very low, as it lies outside the hail and thunder storm region of South Africa (see Figures 2.6 and 2.6).
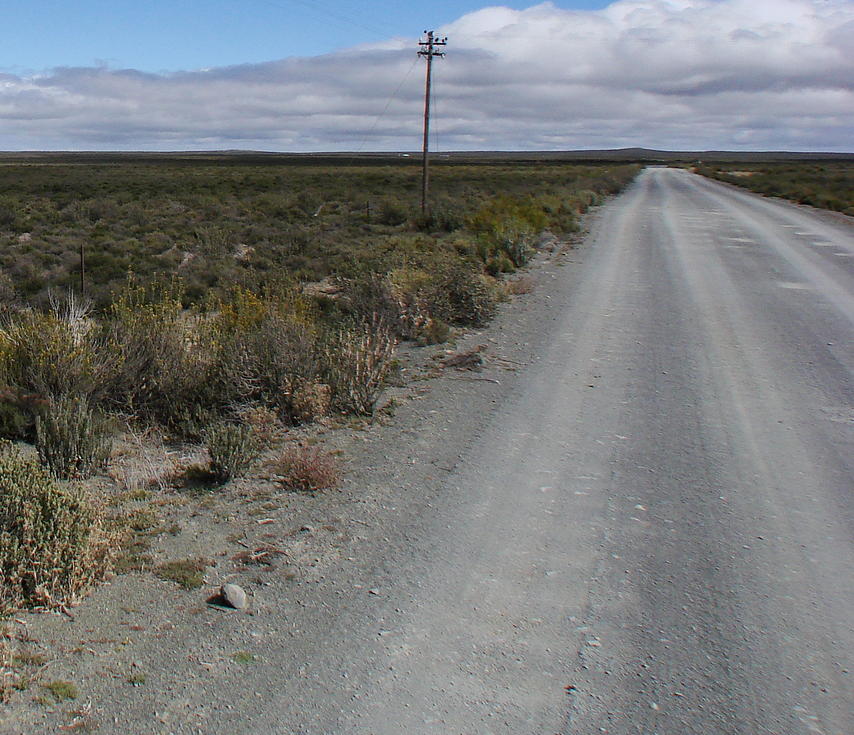
2.4 Accessibility & Infrastructure
The proposed CTA site is about 10 km from Sutherland along the R354. There are good gravel roads (Figure 2.8) serving the farms in the region (Figure 2.2) on both sides of the R354 tar road, with an air strip just east of the R354. Although Sutherland is small (population about 2000), it offers plenty accommodation, has a gasoline station, food stores and a medical clinic.
The R354 also links the site to the N1 national road to Worcester (220 km away, population above 100 000) and Cape Town (330 km away). It is about 3.5 hours drive from Sutherland to Cape Town. The nearest harbour and international airport are at Cape Town with a railway to Matjiesfontein (100 km away). The nearest government hospital and fire station are at Calvinia (170 km away, population of about 8 000), although Worcester also offers a private hospital. For comparison, H.E.S.S. is about 100 km away from Windhoek (which is the closest large town or city) on a gravel road.
ER24 and Netcare are two private national emergency medical care services that serve the whole of South Africa. Although Sutherland does not have an ambulance, Aerocare’s air ambulance can (and has) made emergency flights (from Bloemfontein) to the Sutherland airstrip to transfer patients to Cape Town.
The site can be easily connected to the national electricity grid, as there are various substations around site 1 (Figure 2.2) which are at most a few kilometers away. Safe drinking water is available from boreholes.
SANREN (South African National Research and Education Network) is currently working on linking SAAO to the South African national backbone (with speeds between 1 and 10 Gb/sec), making it easy for the site to have broadband internet connection.
![[Uncaptioned image]](/html/1202.4747/assets/26_CTA_DSC00238b.jpg)
Chapter 3 Kuibis region, Karas, Namibia
3.1 Cloud coverage
| Windhoek | Keetmanshoop1212endnote: 12Data of the all the years with more than 200 observations were used: For 6:00 and 18:00 the years 2001, 2002, 2003, 2005, 2006, 2008, 2009 and the years 2001, 2002, 2005, 2006, 2008 were used respectively. | Luderitz1313endnote: 13Data of the years 2000, 2001 and 2002 were used. | ||||||
| Obs: 6h | Sat: Night | Obs: 6h | Obs 18h | Sat: Night | Obs: 6h | Obs 18h | Sat: Night | |
| % Cloud cover | 23.3 | 26.8 | 18.6 | 19.8 | 19.5 | 28.9 | 15.8 | 20.7 |
| % Time clear sky | 43.2 | 56.4 | 40.8 | 48.1 | 69.7 | 49.8 | 69.2 | 45.7 |
| % Time almost clear sky | 63.4 | 63.3 | 69.3 | 67.7 | 73.9 | 59.9 | 76.7 | 68.0 |
Figure 1.2 shows the three regions of interest in Namibia. The region next to the B2 national road between Luderitz and Keetmanshoop, about 30 km east of the town Aus, has the least clouds of all the possible regions, with about 73% of the night-time cloudless. This is 57% more time than at the Sutherland site and 13% more time than at the H.E.S.S. site. Assuming the moon to be below the horizon 50% of the time, this gives about 1200 hours per year suitable for observation. Note that the cloud coverage for this site was overestimated by Bulik et al.’s search (2009). This may again be due to the large grid used.
3.2 Geography
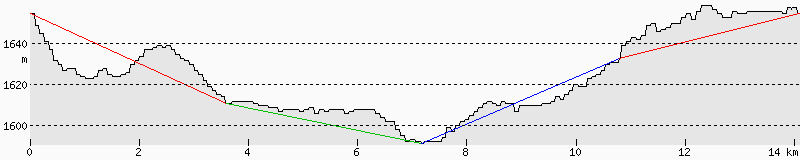
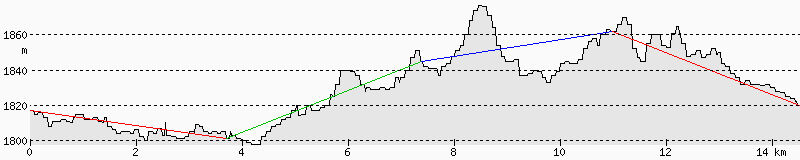
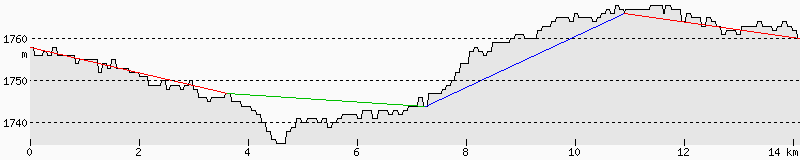
As marked in the bottom of Figure 1.2, this region has roughly four large flat areas. Contour maps of these areas are given in Appendix A (Figures A-A.4). Area 2a is the highest (between 1650 and 1720 m a.s.l) but the most difficult to access, as there seems to be no road to B2, but only one northwards to Bethanie. Area 2b, on the other hand, is very easy to access as it is right next to the B4. Figure 1 shows a photo of the site as taken from the B2 road. However, it is also lower at 1510-1590 m a.s.l. The third area is the southern area south of the B4 at between 1600 and 1680 m a.s.l. The fourth area is the most northern area at between 1590 and 1660 m .a.s.l. and next to the gravel road to Bethanie.
The best area seems to be the third one, as it is close to the B2 and relatively high.
3.3 Weather conditions
The Klein Aus Vista weather station is the nearest weather station to the site (3 km west of Aus on the B4, 66 km west of the site). From the 583 daily reports1414endnote: 14Data are collected every 2.5 seconds and compiled into daily reports, available at http://weather.namsearch.com. between Apr 2009 and May 2011, one day (12/7/2009) of snow was reported and one day of fog (24/6/2009), which corresponds to that given by Figure 3.3. 5% of the days some rain was reported, with 71 mm total rain in 2010, similar to that given by Figure 3.3.
The average wind speed was 16 km/h, with a maximum speed of 80 km/h. Only 6% of days had a maximum wind speed larger than 50 km/h, which implies that the wind speed is far below 50 km/h for more than 94% of the time.
The difference in minimum and maximum temperatures each day is about 15 degrees Celsius, with the temperatures reaching zero in winter and 35 degrees Celsius in summer as shown in Figure 3.3. As expected from the cold temperatures, there are some days of frost as shown in Figure 3.3.
![[Uncaptioned image]](/html/1202.4747/assets/x4.png)
Monthly averages and extremes of daily minimum and maximum temperatures at Klein Aus Vista between Apr 2009 and May 2011.
![[Uncaptioned image]](/html/1202.4747/assets/28_data_paulus_CTA_Nam_B4_17349849.jpg)
Picture of the B4 road close to the proposed site.
![[Uncaptioned image]](/html/1202.4747/assets/29_CTA_days-of-frost2.jpg)
Map of average number of days of frost in Namibia.
![[Uncaptioned image]](/html/1202.4747/assets/30_CTA_rainfall-annual2.jpg)
Map of average annual rainfall in Namibia
![[Uncaptioned image]](/html/1202.4747/assets/31_CTA_days-of-fog2.jpg)
Map of approximate number of days of fog per year in Namibia.
3.4 Accessibility & infrastructure
Although the Kuibis sites are relatively close to the B4 national highway (Figure 3.3), only the areas 2b and 2c is easy to access from the B4 (see Figures A.1 and A.3). The area 2d can be accessed by a good gravel road from Bethanie about 60 km away (see Figure 1.2). Currently there is a farm road (about 10 km long) to area 2a from the same Bethanie gravel road. It would be possible to access area 2a from the B4 (via area 2b) as well, but it is not clear if such a road already exists.
Using area 2b as reference, the area is about 60 km from the railway town Aus (population of 300) and 160 km from the harbor town Luderitz (population of 30k) west along the B4. The area is 60 km from Bethanie (population of 10k) and 160 km from the provincial capital Keetmanshoop (population of 25k) east along the B4.
Accommodation, gasoline, food and general supplies are available at both Aus and Bethanie. The nearest government hospitals and fire stations are at Keetmanshoop and Luderitz, although Bethanie also offers some medical services at its clinic. Both Keetmanshoop and Luderitz have hospitals with medical emergency services and ambulances that can reach the sites within 2 hours. Two medical air rescue services, E-med Rescue and International SOS, operate from Windhoek and can land at Aus, Keetmanshoop or Luderitz to transfer patients to either Windhoek or South-Africa.
Aus has an air landing strip and Bethanie has a small airport. Luderitz has the second largest harbour in Namibia (after Walvis Bay) and also a national airport with commercial flights (operated by Bay Air) from Windhoek three times a week. (Air Namibia stopped scheduled flights to Luderitz from Sept 2010.)
Keetmanshoop has an international airport with customs, although currently there seems to be no commercial flights to Keetmanshoop. Via Keetmanshoop, the site is about 660 km from the capital Windhoek, which has a large international airport. There are also bus services connecting Keetmanshoop to Windhoek, Cape Town, Bethanie, Aus and Luderitz at least once a day. Rental car facilities are available in Luderitz and Keetmanshoop and Keetmanshoop has a shuttle service (ideal for groups of people).
The major railway line between Luderitz and Keetmanshoop approximately follows the B4, with the nearest railway station at Aus and the nearest siding at Guibes (20 km from area 2b).
A 132 kV power line also follows the B4 past the site, with distribution stations at Aus and Goageb. The area has clean drinking water that is supplied by boreholes.
The southern backbone ring network of Namibia passes through Aus with a STM-64 connection from Aus to Keetmanshoop1515endnote: 15Telecom Namibia 2008/9 Annual report. which probably also follows the B4 past the site. High bandwidth connections are therefore possible from Aus.
References
- Bulik et al. (2009) Bulik, T., Cieslar, M., Boisson, C., Median, C. & team, S.W. 2009. Automated CTA site search – initial report.
- Centre (2008) Centre, N.I. 2008. Cost of doing business in Namibia. Ministry of Trade & Industry.
- Cinzano et al. (2001) Cinzano, P., Falchi, F. & Elvidge, C. 2001. The first world atlas of the artificial night sky brightness. Mon. Not. R. Astron. Soc., 328:689–707.
- CTA (2010) CTA 2010. Call for site proposals.
- Forsythe et al. (1995) Forsythe, W., Rykiel, E., Stahl, R., Wu, H. & Schoolfield, R. 1995. A model comparison for daylength as a function of latitude and day of year. Ecological Modelling, 80:87–95.
- Harding (1974) Harding, G. 1974. Observing conditions at Sutherland 1972 August to 1973 December. Circulars. South AfricaN Astron. Obs., 1:31–37.
- NRF (2005) NRF 2005. Proposal to site the Square Kilometre Array. National Research Foundation, South Africa.
- Preuss et al. (2002) Preuss, S., Herman, G., Hofmann, W. & Kohnle, A. 2002. Study of the photon flux from the night sky at La Palma and Namibia, in the wavelength region relevant for imaging atmospheric Cherenkov telescopes. Nuclear Instruments and Methods in Physics Research A, 481:229–240.
- Venter (2011) Venter, C. 2011. The status of H.E.S.S. and CTA. African Skies / Cieux Africains, 16.
Appendix A Contour maps
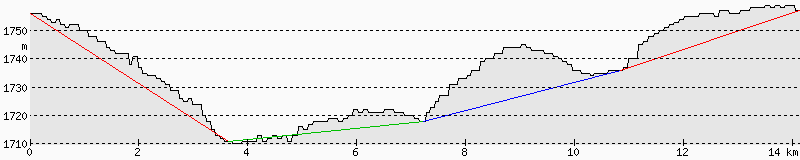
![[Uncaptioned image]](/html/1202.4747/assets/35_CTA_2cn.jpg)
Site 2a: 40 m contour map
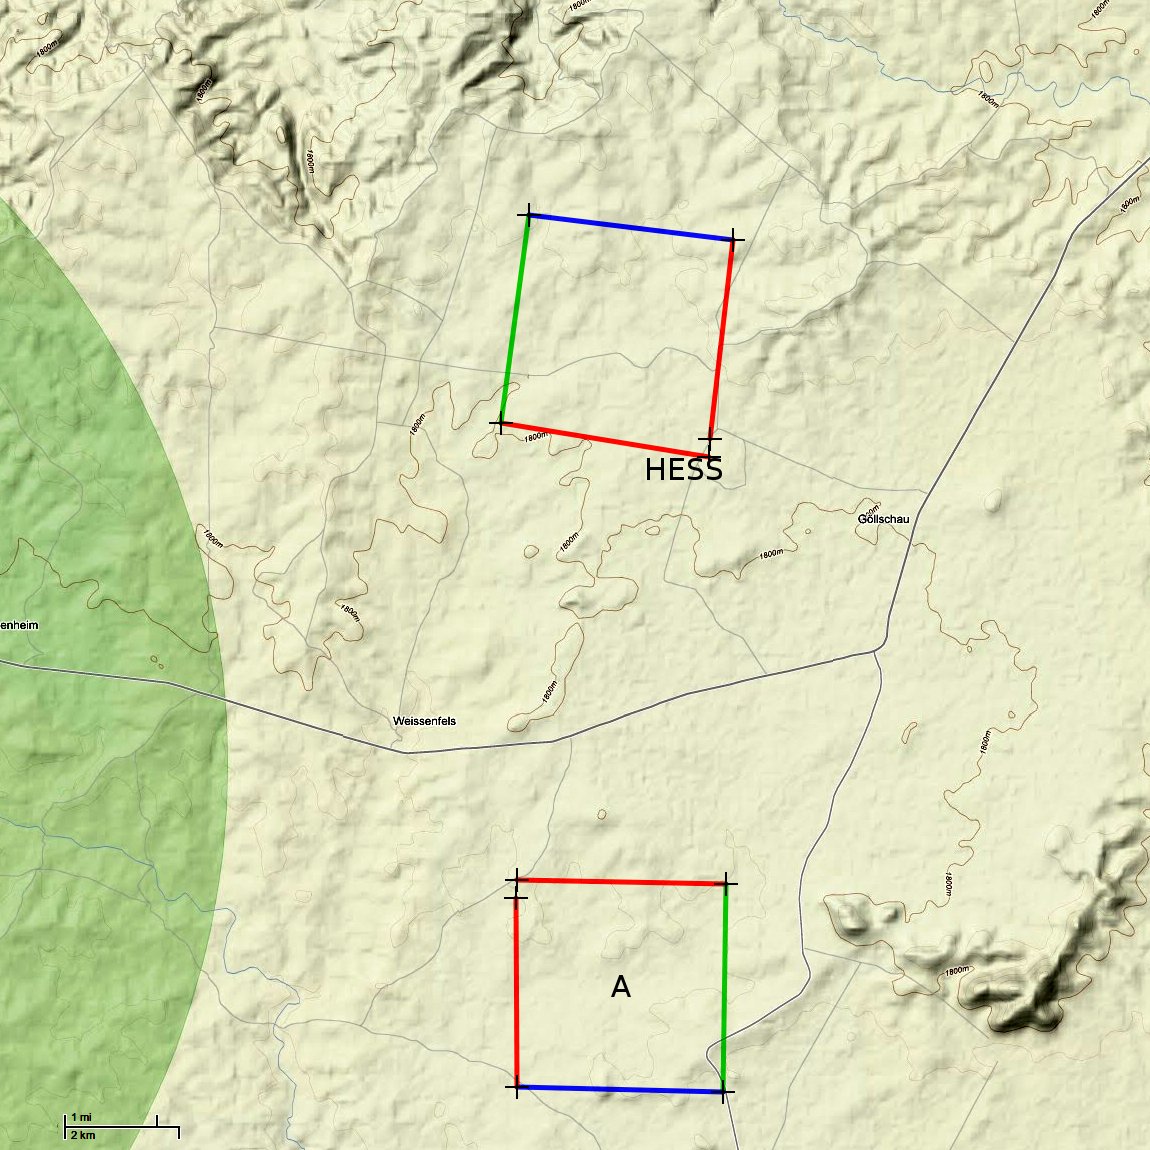
H.E.S.S.
A
![[Uncaptioned image]](/html/1202.4747/assets/43_CTA_3n.jpg)
Site 3: 40 m contour map
A:
B
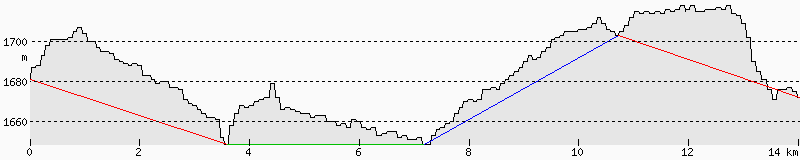
C
Appendix B Political and economic overview
B.1 World Bank Country Brief: South Africa
South Africa’s 1994 transition from apartheid to constitutional democracy remains one of the most important and impressive political transitions of our time. It is a powerful demonstration of the proposition that a peaceful, negotiated path from conflict and injustice to cooperation and reconciliation is possible, despite the complex history of oppression, institutionalized violence, and diverse social fabric that has defined South Africa.
Since 1994, the African National Congress (ANC) has won landslide victories in all four democratic elections. Elections are well-managed and fair, and the press is unrestrained. Opposition parties, among them the Democratic Alliance, Independent Democrats, and the Congress of the People (COPE) enjoy full political freedoms.
In April 2009, the country held its fourth general elections, and predictably the ANC won obtaining a 65.9 percent majority. H.E. Jacob Zuma was sworn in as president of South Africa in May 2009. A new cabinet was announced as a tripartite alliance that includes the Congress of South African Trade Unions (COSATU) and the South African Communist Party (SACP). The cabinet was expanded from 28 to 34 ministries to include improved planning, performance monitoring, and service delivery functions.
South Africa is increasingly gaining prominence on the international stage where it is becoming a more active participant in events such as the Annual Meetings of the International Monetary Fund and the World Bank, the G-20, and the G-24. South Africa’s tremendous success in hosting the 2010 World Cup has also helped to burnish its image globally. President Zuma has also made outreach to emerging economies and alliances such as BRIC and IBSA as a priority for his presidency. South Africa will host the 2011 meeting of the Convention of Parties, U.N. Framework Convention on Climate Change in November and December 2011. South Africa continues to grapple with extreme differences in incomes and wealth. Robust economic growth in the post-apartheid period has enabled a measurable decline in income poverty. However, inequality has increased and as measured by the Gini coefficient, inequality rose from 0.64 to 0.67 in the period 1995 to 2008. At over 25 percent, the unemployment rate remains very high, and the poor continue to have limited access to economic opportunities and basic services.
Human development challenges also loom large. These include a disappointingly low life expectancy of 51 years. South Africa has the largest number of people living with HIV/AIDS in the world (over 5.5 million) and continues to battle a dual epidemic of tuberculosis and HIV/AIDS, bearing 24 percent of the global burden of HIV-related tuberculosis. Current health problems are rooted in the unique legacy of South African apartheid history. The migrant labor system has contributed to many of the major current health problems through social changes that have led to destruction of family life, alcohol abuse, and violence—particularly gender-based violence—while the health delivery system is heavily skewed in favor of the elite.
At the same time, policies working to rectify the many inequities of apartheid have contributed to some notable achievements. Between 1991 and 2008, net secondary school enrolment went up from 45 percent to 72 percent. Since the end of apartheid, 1.6 million free housing units have been constructed for low-income families. Access to electricity went up from 34 percent in 1993 to 81 percent in 2007. Similar improvements have also been recorded for water and sanitation. The social grant system, which primarily supports children, has expanded coverage from 2.5 million beneficiaries in 1999 to over 13 million in 2009.
B.1.1 Recent Economic and Social Developments
Prior to the financial crisis South Africa’s economic policy was largely successful despite underlying structural issues including high unemployment, low domestic savings and investment, and a large current account deficit. The global economic downturn helped trigger South Africa’s first recession in 17 years. However, as 2010 draws to a close, a broad-based upturn in the economy has prompted a 3 percent annual growth rate. Driven primarily by renewed global demand for commodities and spending related to the World Cup 2010, the turnaround has also been supported by a revival in the automobile industry as well as increased demand for chemical products.
The fiscal space created by years of budgetary discipline has also played a role in the turnaround. South Africa’s low public debt combined with its deep and liquid capital markets have provided the access to global finance necessary for the government to expand its own spending in areas such as infrastructure and social services. Although this spending has resulted in the national budget going from a surplus of 1.7 percent of GDP in 2007 and 2008 to a deficit of 7.3 percent of GDP in 2009 and 2010, international trade and the financial sector remain strong. After an initial dip following the onset of the financial crisis, foreign portfolio investment has recovered and provides solid cover for South Africa’s large current account deficit. There has also been an increase in foreign trade with imports outpacing exports.
Throughout 2010 these underlying socioeconomic tensions came to a head in the form of industrial action and lightning strikes. In August, a coalition of unions representing over 1 million public servants—including teachers, doctors, nurses, police, court officials, and government bureaucrats—launched a strike after the government rejected the unions’ demand for an 8.6 percent salary increase and 1,000 rand monthly housing allowance. Pressures were exacerbated by the fact that in order to avoid strikes during the World Cup, public entities such as Eskom and Transnet had approved similar wage increases earlier in the year. As a result, perception of widening disparities between haves and have-nots has become acute, jumping to the forefront of the national psyche and fueling discontent about poverty, lack of employment opportunities, and rampant failures in service delivery especially for poor people. Since late 2008, the ranks of “discouraged workers” have swelled by 739,000. The disenchantment has been simultaneously compounded by South Africa’s difficult macroeconomic situation, and although the economy is beginning to show signs of growth, employment generation continues to lag. Furthermore, jobs shed in aftermath of the global financial crisis which hit South Africa harder than other middle income countries in Eastern Europe and Asia, are yet to be replaced exacerbating an already dire unemployment situation.
B.1.2 Government Policy priorities
South Africa’s development strategy faces a number of significant challenges, including accelerating growth and sharing its benefits more broadly, extending opportunities to all and improving the coverage of delivery of public services.
To help address these challenges, the South African government has launched a Medium Term Strategic Framework (MTSF) for 2009 to 2014 with ten priorities:
-
•
more inclusive economic growth, decent work and sustainable livelihoods
-
•
economic and social infrastructure
-
•
rural development, food security and land reform
-
•
access to quality education
-
•
improved health care
-
•
the fight against crime and corruption
-
•
cohesive and sustainable communities
-
•
improving public service delivery
-
•
sustainable resource management and use
-
•
support for the creation of a better Africa.
The Government of South Africa has placed particular emphasis on accountability for quality of outcomes, and has recently introduced performance contracts for cabinet ministers.
(http://go.worldbank.org/GSBYF92330 as last updated on September 2010)
B.2 World Bank Country Brief: Namibia
Namibia is a middle-income country whose considerable successes rest on a strong multiparty parliamentary democracy that delivers sound economic management, good governance, basic civic freedoms, and respect for human rights. At independence in 1990, Namibia inherited a well-functioning physical infrastructure, a market economy, rich mineral resources, and a relatively strong public administration. However, the social and economic imbalances of the former apartheid system have left Namibia with a highly dualistic society. The structure of the economy has made job creation difficult, and poverty and inequality remain unacceptably high. These key challenges are at the top of the government’s development agenda.
Namibia has made significant progress in addressing the structural problems: access to basic education has become more equitable and primary health care services are widely available. Access to safe water and sanitation has improved, and sound public policies are helping to lay the foundation for gender parity and new programs have been launched to protect the country’s environment and natural resources. Namibia not only maintains a social safety net for the elderly, disabled, orphans, vulnerable children, and war veterans, but also has a Social Security Act that provides for maternity leave, sick leave, and medical benefits to the population.
Nonetheless, human development challenges persist. Namibia is ranked 128 out of 182 countries surveyed in the 2009 Human Development Report. Although Namibia is on track to meet the Millennium Development Goals on education, environment and gender, it faces daunting challenges in combating the HIV/AIDS epidemic, making it especially challenging to meet Millennium Development Goal Six.
B.2.1 Economic overview
A politically stable upper middle-income country with a per capita income of approximately US$4,310, Namibia’s economy is closely linked to South Africa’s economy, and the Namibian dollar is pegged to the South African rand. As a result, economic trends including inflation closely follow those in South Africa. Prior to the 2009 global financial crisis, Namibia had experienced steady growth, moderate inflation, limited fiscal debt, a robust mining sector, a fairly developed infrastructure, and a strong legal and regulatory environment. From 1990 to 2008, economic growth averaged 4.5 percent per year.
However, the 2009 onset of the global economic crisis has not only lowered demand for Namibia’s commodity exports, mainly diamonds, but also reduced the transfer payments the country receives due to its membership in the Southern African Customs Union (SACU). Following years of successive growth, the Namibian economy recorded a negative growth of 0.8 percent in 2009. Following three consecutive years of budget surpluses, the government responded to the sudden economic downturn by running a budget deficit, and fiscal deficits are expected to widen. For the next three years, the International Monetary Fund (IMF) has projected deficits of 8.1 percent, 7.8 percent, and 3.8 percent of GDP respectively. In 2009 and 2010, public debt stood at 14.9 percent of GDP, well below the government’s target of 25 percent. Nevertheless, in 2010 the economy has shown signs of a significant rebound due to government investment and rising commodity exports, and economic forecasters are now predicting a growth rate of 4.4 percent.
B.2.2 Political Context
The presidential and National Assembly elections that took place in late November 2009 confirmed the dominance of the South West Africa People’s Organization (SWAPO) party in national politics, achieving an overwhelming victory. The newly-formed Rally for Democracy and Progress Party, headed by the former SWAPO Party Minister of Trade and Industry, Mr. Hidipo Hamutenya, became the official opposition overtaking the Congress of Democrats Party.
In the 2009 election manifesto, the SWAPO Party ran on the commitment that it would work to “Consolidate monetary and fiscal policies geared towards promoting growth and employment creation, and to ensure forward and backward economic linkages of economic sectors and regions.” Furthermore, the party promised to “maintain prudent macroeconomic policies that are responsive to domestic, regional and international economic developments.”
B.2.3 Development Challenges
Although Namibia has sustained a noteworthy track record on economic growth and macroeconomic stabilization, certain daunting development challenges remain. In particular, while poverty rates have declined since independence, widespread unemployment and distribution of income and assets remain significant issues. With a Gini coefficient of 0.74 (UNDP, 2007), Namibia is among some of the least equitable countries in the world. Thus, a central policy challenge in Namibia is to achieve higher rates of growth, create jobs, alleviate poverty, reduce inequality, and raise living standards.
Similarly, despite a decline in HIV prevalence rates, which have fallen from 22 percent in 2002 to 17.8 percent in 2008, HIV infections remain a serious concern. Namibia also has one of the highest tuberculosis prevalence rates in the world at 765 per 100,000 with some regions reporting tuberculosis rates as high as 1,000 per 100,000.
In addition, Namibia is expected to face increased budgetary constraints in coming years as SACU transfer payments are expected to continue their downward trend.
(http://go.worldbank.org/1B6KN88H10 as last updated on September 2010)
B.3 Economic overview
The Institute for Security Studies (ISS) is a pan-African applied policy research institute headquartered in Pretoria, South Africa with the objective to add critical balance and objectivity by providing timely, empirical research and contextual analysis of relevant human security issues to policy makers, area specialists, advocacy groups, and the media. ISS provide the following overview of the South Africa and Namibian economies:
“South Africa is a middle-income, developing country with an abundant supply of resources, well-developed financial, legal, communications, energy, and transport sectors, a stock exchange that ranks among the largest ten in the world, and a modern infrastructure. However, high levels of unemployment (around 40% in 2000) and economic problems that are a legacy of the apartheid, notably poverty and the lack of economic empowerment among the disadvantaged groups, are serious structural problems, South Africa having one of the most unequal distributions of income in the world. Despite the government’s commitment to promote job creation in accordance with its Growth, Employment and Redistribution (GEAR) strategy, and the number of jobs declined by some 600,000 between 1995-98. Economic growth continues to lag behind population growth. Other pressing problems are crime and the high incidence of HIV/AIDS. With 20 per cent of the adult population estimated to be HIV positive, the incidence of AIDS presents a major threat to the country’s long-term skills base.
Economic activity is centered on the minerals and energy sector with manufacturing based mainly on mining activity. Exports are driven mainly by mining, energy and agriculture-related activities, with gold remaining the largest foreign-exchange earner (some 30% of exports), and platinum the country’s chief export. South Africa is the world’s biggest platinum supplier, and it expected to provide 74% of global market requirements in 2000. The service sector is the most important contributor to GDP at 57% (1998). It ranges from the financial sector to a developing tourism and an important retail sector. Agriculture contributes little to GDP, but is linked to significant agro-industrial activities. Informal services are for many the main source of employment. Inflation fell from 8.5 per cent in 1997 to 5.5 per cent in 1999, rising to 7.2% in 2000. Inflation is expected to average 6% in 2001.” (http://www.iss.co.za/af/profiles/SouthAfrica/southafrica1.html)
“Namibia’s economy is closely tied to that of South Africa through a number of institutional relationship’s - in particular the Southern African Custom’s Union and the Common Monetary Area - as well as through extensive trade and financial flows. Namibia has abundant natural resources, good infrastructure and access to markets, but contrary to potential, the economy is not well diversified. Economic activity is concentrated in primary sector activities - the extraction and processing of minerals for export which accounts for 20% of GDP, large scale commercial livestock farming, and fishing. The economy is highly vulnerable to world market price fluctuations of diamonds and uranium, prices and demand remaining crucial to the country’s economic prospects. Government services accounted for some 25% of GDP in 2000.
While Namibia appears to be a prosperous, middle-income country, the estimated GDP per capita of US$ 1,800 camouflages huge income disparities, presenting Namibia one its main economic problems. The majority of the population is poor, with limited access to social services in certain areas. Furthermore, the historic pattern of land ownership means the majority of Namibians are landless or small-scale subsistence farmers.” (http://www.iss.co.za/af/profiles/Namibia/Economy.html)
Euler Hermes Country Risk Grade for South-Africa is BB and Namibia is B (on the scale AA, A, BB, B, C, D with AA the best). The report gives the following strengths, weaknesses and risks for South Africa and Namibia:
South Africa’s Euler Hermes Country Risk Profile
-
•
Strengths
-
–
Geographic and economic size engender regional dominance
-
–
No external threats to sovereignty
-
–
ANC government has a strong mandate; political stability to continue
-
–
Political, judicial and security systems entrenched and aligned with Western ‘norms’
-
–
Economic management is good, with monetary and fiscal policy agencies highly regarded
-
–
Exemplary exodus from foreign debt problems of the mid-1980s
-
–
Business environment generally favourable, with practices familiar to European practitioners
-
–
Relations with IFIs are good
-
–
-
•
Weaknesses
-
–
Open economy leads to occasional currency and external account pressures
-
–
Long-term problems require policy and action, including unemployment, rural poverty and HIV/AIDS (an estimated 5.7mn are infected out of a total population of around 50mn)
-
–
Lingering concerns in relation to LT policy stance now that Jacob Zuma is head of state
-
–
Current account and fiscal deficits require careful management
-
–
Danger of policy ossification in regard to privatisation and labour relations
-
–
Inward investment weighted towards portfolio flows rather than FDI
-
–
Power generation has not increased sufficiently to meet growing demand and there have been periods of rationing of supply for homes and industry
-
–
Relatively weak liquidity levels
-
–
Labour market inflexibility
-
–
-
•
Key Risks
-
–
The rand is an openly traded currency and is susceptible to volatility. An external event causing weakness in emerging market currencies as a class could lead to a run on the rand, with associated policy concerns and deterioration in economic data
-
–
Namibia’s Euler Hermes Country Risk Profile
-
•
Strengths
-
–
Stable democracy since independence in 1990
-
–
Political environment has matured as indicated by the successful transition from long-serving Sam Nujoma to President Hifikepunye Pohamba
-
–
Close association with South Africa through customs and monetary unions
-
–
Natural resource base includes substantial diamonds (including offshore)
-
–
Current account surpluses
-
–
Manageable foreign debt ratios
-
–
-
•
Weaknesses
-
–
Land reform programme is a policy priority and there is concern that it may yet develop into a Zimbabwe-style land -grab
-
–
Diversification of economy is relatively limited
-
–
Small population base and limited arable land area
-
–
Fiscal deficits
-
–
Poverty and unemployment remain high
-
–
Foreign reserves holdings, though improving, provide limited import cover
-
–
-
•
Key Risks
-
–
The economy is strongly linked to that of South Africa and a rapid deterioration in the latter would have negative repercussions in Namibia
-
–
The high prevalence of HIV/AIDS in a country with a small population limits the available manpower and the economy, in general, and the non-mining sector, in particular, are therefore unlikely to reach potential
-
–