2 Academia Sinica, Institute of Astronomy and Astrophysics, Taipei, Taiwan
Observations and Analysis of High-Resolution Magnetic Field Structures in Molecular Clouds
Abstract
Recent high-angular-resolution (up to ) dust polarization observations toward star forming regions are summarized. With the Sub-Millimeter Array, the emission from the dense structures is traced and resolved. The detected magnetic field morphologies vary from hourglass-like structures to isolated patches depending on the evolutionary stage of the source. These observed features have also served as a testbed to develop new analysis methods, with a particular focus on quantifying the role of the magnetic field in the star formation process.
1 Introduction
The connection of the magnetic field (B) in star formation regions from the molecular cloud and envelope (typically at a scale of 1 pc) down to the collapsing core (at a scale of a few mpc) is not yet clear. It has only been possible to resolve the B field in dense cores in the past decade with the recent advancing instrumental developments, namely the high-angular resolution, sensitivity and the capability of detecting the (sub)millimeter emission. The emission at (sub)millimeter is particularly interesting, because it is mostly optically thin and allows us to trace dense structures. Here, we present a sample of our measurements where the sources are at different evolutionary stages, from the collapsing core (W51 e2 and part of Orion BN/KL) to the ultra-compact HII region G5.89-0.39. The observations were carried out using the Sub-Millimeter Array (SMA) in various array configurations. Dust continuum and its polarized emission at 0.88 mm were imaged. With the SMA, dense structures with the number density 105 to 107 cm-3 are traced. The plane-of-sky projected B field integrated along the line of sight, B⊥, is derived by rotating the detected polarization by 90, assuming that the dust grains are aligned with their shorter axes parallel to the field lines.
2 High-Resolution Polarization Observations
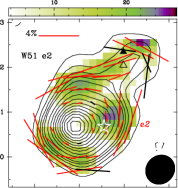
Based on the kinematics derived from molecular lines, the collapsing core W51 e2 was found to be embedded in a gravitationally stable envelope. The B field in the envelope has been mapped by Lai et al. (2001) revealing a uniform field morphology. With an angular resolution, 7, the field within the core was resolved with the SMA (left panels in Figure 1 and Tang et al. (2009b)). The coincidence of de-polarization zones with the ionized accretion disk and the molecular outflow suggests that the B field is associated with the accreting material. An hourglass-like B⊥ morphology is found.
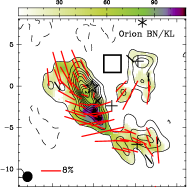
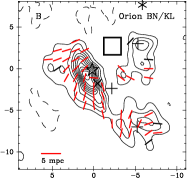
The B field in Orion BN/KL appears to be more complex. The polarization varies significantly but smoothly across the detected patches (middle panels in Figure 1 and Tang et al. (2010)). Two symmetry features have been found: firstly, the B field shows a radial symmetry, where the center is within the uncertainty of the origin of the explosive molecular outflows; secondly, there is a symmetry plane, with mirror symmetric field features on both sides. This plane is parallel to the elongation of the OMC-1 dust ridge at a 0.5 pc scale. The B⊥ morphology at the 0.5 pc scale is found to be uniform (Vaillancourt et al., 2008) and the axis of the OMC-1 ridge is perpendicular to the B field at that scale. Based on the symmetry properties, the B field at the larger 0.5 pc scale seems to guide the formation/condensation of the dense cores with their associated field structures at the smaller 20 mpc scale revealed with the SMA. Additionally, the stellar feedback from molecular outflows seems to further shape the B field.
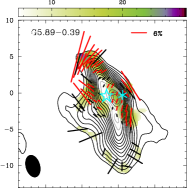
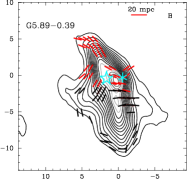
The B field associated with the more evolved ultra-compact HII region G5.89-0.39 shows more isolated patches (right panels in Figure 1 and Tang et al. (2009a)). The detected polarization is mostly toward the northern ridge. The dense structure revealed with smaller shows that there is an emission cavity in the southern ridge. This demonstrates that the polarization is sensitive to the underlying structure. The polarization angles vary significantly within 0.02 pc. Based on the analysis of the kinetic energy and the radiation pressure, we found that this region is active in stellar feedback. The B field is mostly overwhelmed.
The detected polarization emission often appears to be patchy. The depolarization zones are often associated with underlying structures or motions. We found that the highest polarization emission is not at the continuum peak. The connection of the B field to the larger scale parent cloud/envelope is not yet conclusive due to the limited sample. For Orion BN/KL, a symmetry plane is identified and seems to connect to larger scale B field directions. For W51 e2, the influence of the larger scale B field is not clear, because the detected accretion plane and molecular outflows all deviate from the B field directions at larger scales. The B⊥ morphologies are found to be more complex in the case where the source is more evolved (G5.89-0.39). This might suggest that the stellar feedback has a significant impact on the B⊥ morphologies. However, there are still limited sources observed with high angular resolution.
3 Analysis Method: Magnetic Field Strength Maps
The collapsing core W51 e2 (Tang et al., 2009b) is the starting point for the polarization - intensity gradient method developed in Koch et al. (2012a). In this new method, an ideal magneto-hydrodynamic (MHD) force equation is adopted and matched to observed dust Stokes and dust polarization maps. The observed systematic deviations between magnetic field and dust intensity gradient orientations are further analyzed in that work. As demonstrated, the correlation between the two orientations can be used to derive a magnetic field strength at each location where polarized emission is detected. The magnetic field strength as a function of position in a map can then be expressed as:
| (1) |
where and are the dust density and the hydrostatic pressure, and is the total gravitational potential. is the magnetic field radius. denotes the gradient. The angle is the difference in orientations between the gravitational pull and the intensity gradient, and the angle is the difference between the polarization and the intensity gradient orientations (Figure 3 in Koch et al. (2012a)).
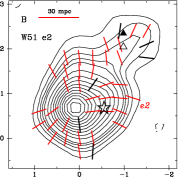
As further demonstrated in Koch et al. (2012a), the derived field strength is likely to be very little or not at all affected by projection effects. Thus, the method leads to a total field strength. Reorganizing Equation (1), the method also quantifies the local magnetic field to gravitational force ratio, (assuming P=0). It is remarkable that this ratio only depends on two measured angles on an observed map. These angles represent the result of the imprint of the combined forces onto the dust and magnetic field morphologies. The ratio is free of any assumptions of mass and field strength or detailed modeling of the molecular cloud. The left panel in Figure 2 shows the magnetic field strength map for W51 e2. Displayed in the right panel are the azimuthally averaged force ratio and the field strength profile . The field strengths vary between mG and mG with a radial profile .
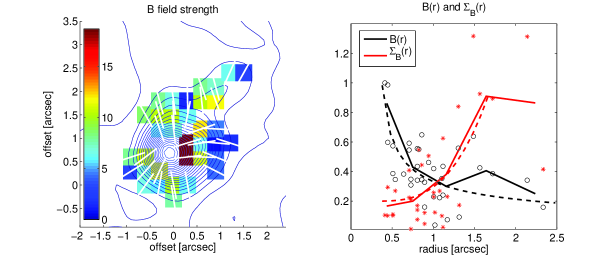
The local magnetic field to gravitational force ratio can also be converted to a beam-averaged differential mass-to-flux ratio (Koch et al., 2012b). A clear transition from a subcritical state at larger radii to a supercritical state closer to the center of the W51 e2 peak is found. Moreover, the force ratio can be interpreted in the context of diluted gravity (Shu & Li, 1997). It, therefore, measures how efficiently the magnetic field is able to slow down the gravitational collapse. Based on this, a star formation efficiency reduced to % or less (compared to a free-fall efficiency) is estimated in Koch et al. (2012b).
We stress that – although illustrated here for a molecular cloud core – the polarization - intensity gradient method is generally applicable to measurements that reveal the large-scale magnetic field morphology in combination with indications for gravity and/or pressure forces. The method can potentially also be expanded to Faraday rotation measurements in galaxies.
4 Conclusion
High-resolution dust polarization observations start to reveal detailed field structures in the star formation process. For further insight, it is paramount to develop analysis tools to quantitatively assess the role of the magnetic field.
References
- (1)
- Koch et al. (2012a) Koch, P.M., Tang, Y.-W., & Ho, P.T.P. 2012a, ApJ, 747, 79
- Koch et al. (2012b) Koch, P.M., Tang, Y.-W., & Ho, P.T.P. 2012b, ApJ, 747, 80
- Lai et al. (2001) Lai, S.-P., Crutcher, R. M., Girart, J. M., & Rao, R. 2001, ApJ, 561, 864
- Shu & Li (1997) Shu, F.H., & Li, Z.-Y. 1997, ApJ, 475, 251
- Tang et al. (2009a) Tang, Y.-W., Ho, P.T.P., Girart, J.M., et al. 2009a, ApJ, 695, 1399
- Tang et al. (2009b) Tang, Y.-W., Ho, P.T.P., Koch, P.M., et al. 2009b, ApJ, 700, 251
- Tang et al. (2010) Tang, Y.-W., Ho, P.T.P., Koch, P.M., & Rao, R. 2010, ApJ, 717, 1262
- Vaillancourt et al. (2008) Vaillancourt, J. E. et al. 2008, ApJ, 679, L25