Spectroscopic detection of Carbon Monoxide in the Young Supernova Remnant Cassiopeia A
Abstract
We report the detection of carbon monoxide (CO) emission from the young supernova remnant Cassiopeia A (Cas A) at wavelengths corresponding to the fundamental vibrational mode at 4.65 m. We obtained AKARI Infrared Camera spectra towards 4 positions which unambiguously reveal the broad characteristic CO ro-vibrational band profile. The observed positions include unshocked ejecta at the center, indicating that CO molecules form in the ejecta at an early phase. We extracted a dozen spectra across Cas A along the long 1′ slits, and compared these to simple CO emission models in Local Thermodynamic Equilibrium to obtain first-order estimates of the excitation temperatures and CO masses involved. Our observations suggest that significant amounts of carbon may have been locked up in CO since the explosion 330 years ago. Surprisingly, CO has not been efficiently destroyed by reactions with ionized He or the energetic electrons created by the decay of the radiative nuclei. Our CO detection thus implies that less carbon is available to form carbonaceous dust in supernovae than is currently thought and that molecular gas could lock up a significant amount of heavy elements in supernova ejecta.
1 Introduction
Molecular emission from supernovae (SNe) remains rarely detected, as the formation of even the most stable molecules is difficult in the SN ejecta. The high UV radiation due to recombinations, and the energetic electrons from the radioactive decay of 56Ni and 56Co dissociate molecules efficiently. The presence of molecules in ejecta could thus imply an inhomogeneous distribution of material within the ejecta and could constrain the degree of mixing. Since CO is an effective coolant (Liu & Dalgarno, 1995), it enhances dust formation and thus the formation efficiency of CO critically affects the dust formation efficiency. Because of the rapid decrease in density and temperature during condensation in the ejecta, dust formation happens through non-equilibrium condensation. There are then two important key questions for dust condensation in supernovae. First, to determine which molecular species are relevant in non-equilibrium condensation and second, whether the gas in the ejecta is able to mix with the molecular species.
There are only about a dozen SNe known where CO has been detected. SN1987A is the only SN with spectroscopic detections of both the CO fundamental and first overtone bands (Wooden et al., 1993; Spyromilio et al., 1988). Other detections of the fundamental band have been made with the Spitzer Space Telescope, but these observations cover only the tail of CO feature at wavelengths longwards of 5.3 m for SN2004dj, SN 2005aj, and SN2006et (Kotak et al., 2006). More detections have been reported in the first overtone band in the near-infrared, with observations of SN 1995ad, SN 1998S, SN 1998dl, SN 1999em, SN 1999gi, and SN 2000ew (Gerardy et al., 2002). In all cases, the CO detections correspond to times between 97- 200 days after the explosion.
We previously detected CO in Cas A in near-infrared narrow-band images centered at the 2.29 m first overtone CO band (Rho et al., 2009). In this paper, we report the spectroscopic detection of the fundamental CO band in Cas A with the AKARI Infrared Camera.
2 Observations
We performed AKARI Infrared Camera (IRC; Onaka et al. 2007) observations towards 4 positions in Cas A. Three positions are the brightest knots in the near-infrared 2.29 m narrow-band Palomar image (Rho et al., 2009); two positions are towards the northern shell (filenames are n1” and n2”), one towards the south (s1”), and an additional position towards the central position where unshocked silicon ejecta (sipeak) are detected (Rho et al., 2008).
| filename | location | position | Observation ID, Datea | Velocity (km s-1) | Td(CO) | CO masse |
|---|---|---|---|---|---|---|
| CO (Ne)b (Ar) [Si]c | (K) | (M⊙) | ||||
| COn1hi | N shell | 23:23:23.0, 58:50:27 | 3340001.1,01-17 | f-1980 (-1697)(-1976) [-2116, 2302] | 1500 | |
| COn1hi2 | Nshell | 23:23:24.1, 58:50:35 | 3340001.1,01-17 | -1990 (-1687) (-1863) [-1700,2821 | 1300 | |
| COn2hi | N inner-shell | 23:23:22.4, 58:50:29 | 3340001.2, 01-17 | -3810 (-1512) (-1527) [-2330, 1777] | 1300 | |
| COs1H0 | S inner | 23:23:28.1, 58:47:44 | 3340005.1, 01-16 | -4800 (–)f (–)f [-907, 3442] | 900 | |
| COs1H1 | S shell | 23:23:29.3, 58:47:14 | 3340005.1, 01-16 | -3240 (-1323, 1684) (-1238) [-770, 2439] | 1400 | |
| COn1low | N shell | 23:23:23.1, 58:50:25 | 3340002.1[2.2], 01-18 | -5660 (-1854)(-1887, -7044) [–]g | 2400 | |
| COn2low | N inner-shell | 23:23:25.8, 58:50:05 | 3340004.1, 07-21 | -5410 ( -3273) (-2885) [-2448, 3720] | 1700 | |
| COs1low | center | 23:23:29.8, 58:48:43 | 3340006.1, 07-18 | -4690 (–)f (–)f [-1552, 2556] | 900 | |
| COsipeak | SW shell | 23:23:19.1, 58:47:29 | 3340015.1[15.2], 01-18[19] | -330 (-524) (216, 3066) [202, 3206] | 1200 |
The observations took place in January and July 2009 during AKARI phase 3 (post-helium phase); only the near-infrared channel was available. The point spread function has a FWHM of 4.7′′, and the pixel size is . Detailed AKARI AOT configuration and instrument information is described in the AKARI IRC Data User Manual for Post-Helium (Phase 3) Mission ver1.1 (Onaka et al. 2009). We used the grism (NG) or the prism (NP) modes for the spectroscopy. For the NG observations we used mostly the narrower slit (Nh) with size except for 3340007.1, for which the wider slit (Ns) of was used. For the NP observations, we always used the Ns slit. In the NG mode with the Nh slit, the spectral resolution is about 0.02 m, which provides a resolving power of 220 at 4.3 m, while the NG with the Ns slit gives a resolving power of 150 at 4.3 m. The spectral resolution of the NP mode varies with the wavelength (Ohyama et al., 2007) and is about 40 at 4.5 m for the Ns slit. The AKARI IRC grism spectrum covers 2.4-5 m while the prism spectrum extends up to 5.5 m. In each pointing observation, about 8 exposure cycles were obtained and the on-source integration time was about 360s. During the spectroscopic observations, one set of imaging data at 3.2 m was obtained to derive accurate position information. The center position where the spectrum was extracted is derived from the imaging data. The summary of the observations is given in Table 1. Note that the attitude control of AKARI is not good enough to locate the intended target position on the Ns or Nh slit. Thus the derived position is somewhat different from the intended ones. The indicated position is an average over the observation and we listed the positions where we extracted 9 sets of spectra.
The data were processed with the latest version of the spectroscopic toolkit (version 20101025). We extracted a spectrum from the brightest part of 6 pixels along the slit (8.76′′) in each dataset. Thus the spectra that we show here are those extracted either from a (Ns slit) or from a (Nh slit) area. Each spectrum was smoothed by 3 pixels both in the spectral and spatial direction, which does not degrade the spectral resolution. The relative spectral response is determined to be better than 7% around 4.5 m, while the absolute calibration for the Ns and Nh slit spectroscopy has a larger uncertainty (20%).
We also reanalyzed Spitzer IRAC images (Ennis et al., 2006; Rho et al., 2008). We subtracted from the IRAC band 2 (4.5 m) image the contribution by synchrotron emission that we estimated from the IRAC 3.6 m map, after accounting for wavelength- and time-dependent zodiacal emission. The IRS images of Ar, Ne and Si images are from Rho et al. (2008) and Smith et al. (2009) and the velocities of the ejecta (Table 1) towards the CO positions are estimated based on the results of DeLaney et al. (2011).
3 Results: CO properties
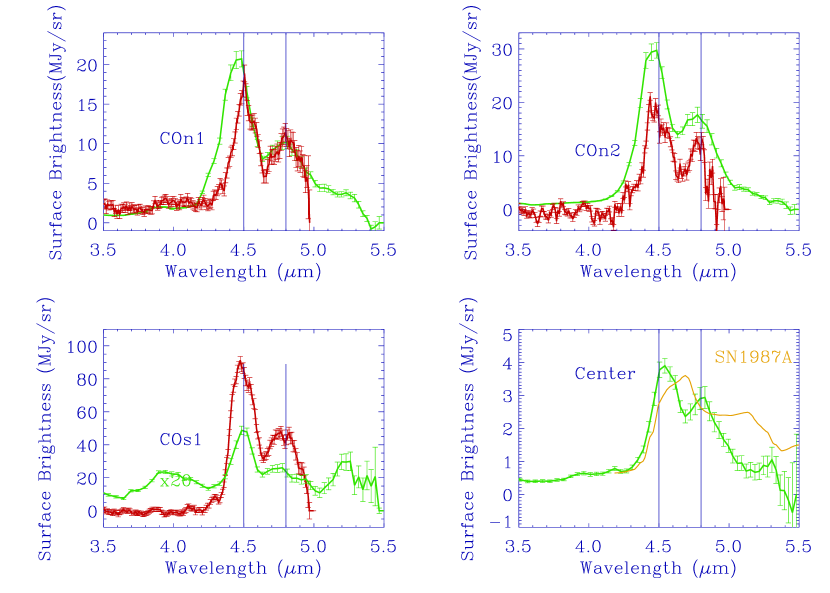
Fig. 1 shows the AKARI spectra towards four positions in Cas A. The spectra clearly show the double-peaked profile characteristic for the unresolved ro-vibrational band due to the CO fundamental at 4.65 m. The CO emission is detected from not only shocked ejecta but also unshocked ejecta at the center. The AKARI spectra show no other lines than the CO fundamental band within our spectral resolution. We were able to extract a dozen spectra along the 1′ slit length, some of which are combined to increase the signal-to-noise. The properties of 9 spectra are listed in Table 1.
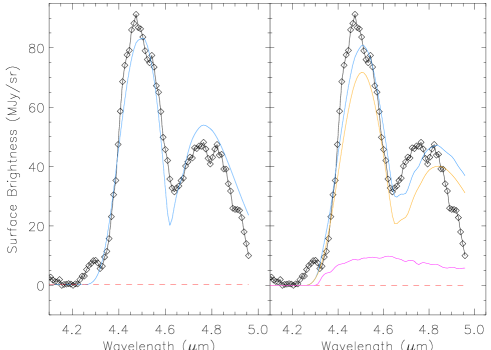
We have determined the physical parameters of the CO gas by comparing the observations to isothermal LTE emission models from the SpectraFactory database111http://www.spectrafactory.net(Cami et al., 2010). The observed profiles show clearly separated P and R branches, which suggests that the emission is optically thin (see Fig. 2). We therefore present an analysis in the optically thin limit since it greatly simplifies matters. We also considered optically thick models; however, we found that all spectra are reproduced more efficiently by optically thin models than optically thick ones.
In the optically thin limit, the emission is directly proportional to the number of emitting molecules in the beam, and the observed shape of the profile (i.e. band width, peak separation and relative strength of the P and R branches) depends only on the temperature. In LTE, the Boltzmann equation determines the relative populations over the molecular levels; and with the frequencies and Einstein A coefficients given by Goorvitch (1994) and the partition function from the HITRAN database (Rothman et al., 2009, and references therein), we then calculate the line intensities for each of the ro-vibrational transitions that make up the entire band. In the SpectraFactory models, each of the individual lines is represented by a gaussian line profile with a Doppler width of 3 km s-1. The entire spectrum is then convolved by a gaussian (instrumental) profile and rebinned to simulate the observations. While the intrinsic line profile and width might not be appropriate for the environment studied here, they have no influence on the resulting band profile. Indeed, the instrumental resolution is far too low to resolve these individual lines, and since the lines are optically thin, line overlap is not important.
Finally, we applied a radial velocity shift to the CO model spectra and included a linear background flux in our model. Our complete fitting routine then runs over models at temperatures between 500 and 3000 K (in steps of 100 K) and for radial velocities in the range -10,000 to +10,000 km s-1 (in steps of 10 km s-1). For each of these combinations, we then used a non-negative least-squares routine (NNLS, Lawson & Hanson, 1974) to find the scale factors for the CO model and the background that minimizes the for each of the 9 Cas A spectra.
Table 1 summarizes the resulting best fit parameters for all spectra. We can reproduce the observed emission with optically thin CO emission at temperatures between 1200 - 2400 K at the shell and 900 K at the center; an example of the model fits is shown in Fig. 2. Such temperature differences make sense: since the center is where unshocked ejecta (e.g. Si) are detected (Rho et al., 2008) it is not surprising that we find the cooler CO there.
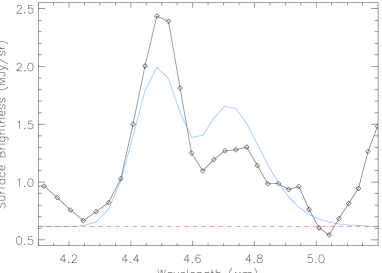
The derived radial velocities of the CO gas (see Table 1) however present some puzzles. The different spectra show CO emission at very different velocities ranging from -300 to -5600 km s-1. Note that the uncertainty in the NG spectrum is 0.006 m which translates to an uncertainty of typically 400 km s-1 on the velocities. We find that toward 4 positions (marked in bold in Table 1), the CO velocities are roughly consistent with those in ejecta, but for the other positions, there are large differences between the CO velocities and those measured from the gas lines. CO models where the radial velocity is fixed to any of the gas line velocities are significantly worse; a comparison is shown in Fig. 2. Although non-LTE effects clearly affect the band shape (see Fig. 3), it may well be that some of the CO velocities intrinsically differ from the ionized gas line velocities.
In the optically thin LTE limit, we can estimate the CO mass as follows. The total (integrated) flux in the CO band is given by
where is the partition function, is the total number of CO molecules in the beam, is the distance, is the statistical weight and is the energy of the upper level , is the Einstein coefficient for spontaneous transition from to and the sum runs over all transitions in the band. Given the derived CO temperature, is readily calculated, and multiplying this by the mass of a CO molecule then yields the total CO mass per beam.
The total CO mass from all 9 spectra combined is about 1.410-8 M⊙, where the derived mass for each spectrum is given in Table 1. From the CO fundamental map in Fig. 4, we find that the total CO flux is a factor of 43 higher than the total flux of all 9 spectra combined. A rough estimate of the total CO mass in Cas A is thus (5.90.3)10-7 M⊙.
4 Discussion
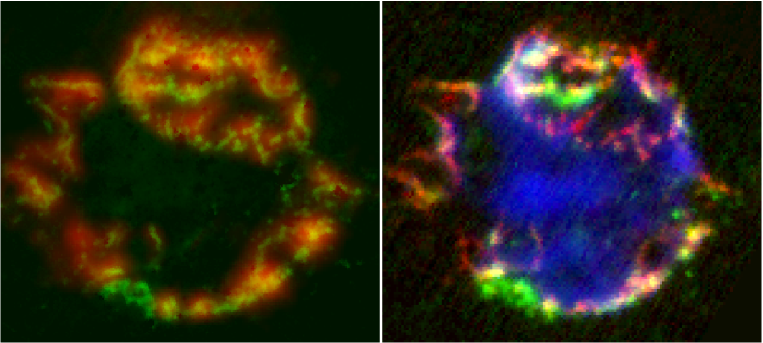
Fig. 4 shows the fundamental band CO map. Surprisingly, the distribution of freshly formed CO molecules is similar to that of the ejecta, especially when comparing to the Ne map. This indicates that CO molecules are formed in ejecta as a precursor of dust formation. The fact that the morphology of the CO map is almost identical to that of the ejecta map proves that CO has formed in an earlier phase of the supernova event, and is now heated by the more recent reverse shock.
We also compare the CO map to the 21 m dust map (Rho et al., 2008; Barlow et al, 2010). The 21 m dust feature can be reproduced mainly with silica (SiO2) grains with a temperature of 85 K (Rho et al., 2010) and overall morphology of the two maps is similar. The CO emission coincides with the crescents (see “green excess” emission in Fig. 4) where the ratio of [Ne II] to [Ar II] is high (Smith et al., 2009). The 21 m dust emission is strongly correlated with Ar (Rho et al., 2008), whereas the CO molecules are strongly correlated to Ne ejecta. The presence of CO in Cas A implies that less carbon is available to form carbon dust from the ejecta, because a large portion of carbon may have been locked in CO. If Type II supernovae such as Cas A are a primary source of dust in high red-shift galaxies, such dust may be relatively deficient in carbonaceous grains.
When comparing the AKARI spectra with those of SN 1987A (see Fig. 1), there are several notable differences: Cas A lacks the Pf and Br hydrogen lines and the underlying continuum seen in SN1987A, and there are clear differences in the appearance of the CO features. In Cas A, the profiles show the double-peak structure that is characteristic for optically thin CO emission; in SN1987A, on the other hand, there is no obvious separation between the peaks, indicating that the CO emission is optically thick (Liu, Dalgarno & Lepp, 1992, see Fig. 1).
For SN1987A, Spyromilio & Leibundgut (1996) used an LTE model to study the CO emission in the first overtone (2.2–2.5 m), and estimated a CO mass of . Liu, Dalgarno & Lepp (1992) later reanalyzed these data with a non-LTE model which reproduces the observed CO overtone bands much better. Consequently, they derived a CO mass of 2.2-2.5, 40 - 100 times larger than the LTE estimate. Also for Cas A, many spectra show non-LTE signatures (see Fig. 3); if these would similarly lead to an underestimate of the CO mass by about the same factor, the CO mass of Cas A could be (2.4- 6) M⊙.
In SN environments, several mechanisms are known to destroy CO molecules. In the presence of small-scale mixing, it is generally believed that CO is destroyed efficiently by collisions with helium ions: ; if He+ is absent however, efficient CO removal happens through impacts with energetic electrons that can ionize and dissociate CO (Liu, Dalgarno & Lepp, 1992). Finally, CO is also destroyed by charge transfer with Ne+. In a fully mixed model on the other hand, CO is removed by photodissociation and photoionization. When no CO was detected for SN1987A at 800 days after the explosion, it was thus concluded that all CO had been destroyed (Wooden et al., 1993). However, the detection of CO in Cas A indicates that CO survives or reforms in the ejecta.
The CO detection in Cas A has implications for dust formation in SNe and the cycle of carbon in the ISM. First, current dust formation models (Nozawa et al., 2003) assume that CO molecules are destroyed prior to dust formation. However, the CO detection shows this is not the case. A significant amount of carbon may have been locked in CO during the 330-yr lifetime of Cas A. We have checked ISO LWS observations and found that [C II] lines (at 158.7 m) toward Cas A do not match the velocities of the supernova remnant. After subtracting the background, the lack of [C II] emission associated with Cas A hints that a large portion of carbon ejecta is in CO and not ionized carbon. It awaits confirmation with a higher sensitivity and spectral resolution such as with Herschel or SOFIA. Second, the presence of CO in Cas A suggests that macroscopic mixing in ejecta is very small. Typical electron densities during the formation of CO are 5108 - 106 cm-3 (Gearhart et al., 1999). The highly clumpy structures can be explained by such high density CO gas within the warm or hot ejecta. The HST observations of Cas A (Fesen, 2001) suggest a size between 0.2′′-0.6′′ (physical size of 6000-12000 AU). Assuming that the density of CO is 5108 - 106 cm-3 and using the estimated CO mass in Table 1 the clump size would be 2-14 (20-140) AU for a filling factor of 10-1 (10-4). Note that a CO density could not be directly estimated because the beam for the spectrum is too large compared to the size of clumps and thus the uncertainty of the filling factor dominates.
We found CO knots outside the bright ring and near the jet-like structures, and found that some of the clumps did not have ejecta counterparts. These dense, molecular ejecta clumps propagate into the ISM and will eventually cool down to ISM temperatures. Our observations thus provide direct evidence that supernovae eject dense clumps into the ISM.
In summary, our observations support the idea that SNe could be important sites of molecule formation resulting in species such as CO, SiO, SiS, O2, SO, and CO2 (Cherchneff & Lilly, 2008). A significant portion of the CO molecules has survived at least years after the initial explosion. Cherchneff & Dwek (2009) suggest that molecules form very efficiently in the ejecta of supernovae and that 13–34% of the progenitor mass of ejecta material could be in molecular form. For a 25 M⊙ progenitor, Woosley, Heger, & Weaver (2002) estimated a gas ejecta mass of 15 M⊙ after accounting for mass loss; however, observations of Cas A infer an observed ejecta mass of 4 M⊙ (Hwang et al., 2011). If CO locks up C and O in molecular form, and other molecular species lock up other heavy elements, then some of the missing ejecta mass could be in molecular form as well as in dust form. Recently, a dust mass of 0.4-0.7 M⊙ was estimated in SN1987A (Matsuura et al., 2011), emphasizing the importance of dust in supernovae.
We have shown the detection of the fundamental vibrational mode of CO at 4.65 m from Cas A with AKARI. We infer CO temperatures of 900 - 2400 K and a total CO mass of (5.90.3)10-7 M⊙ using an LTE model. CO has not been efficiently destroyed, and molecular species could thus be a significant reservoir of heavy elements in the ejecta. Future modeling including supernovae explosion models and CO radiative transport calculations in non-LTE will allow us to examine the core density profiles and the circumstellar medium profile before the explosion.
The First Light TEst CAMera (FLITECAM) (McLean et al., 2006) on SOFIA covers 1-5m, and it will be easier to detect the first overtone and fundamental CO bands when observing in the stratosphere than from the ground. High resolution spectroscopy in the mid-infrared (EXES) and low-resolution grism (FORCAST) (Adams et al., 2010) on SOFIA will thus further advance our understanding of molecule and dust evolution.
References
- Adams et al. (2010) Adams, J. D., et al. , 2010, SPIE 7735, 62
- Barlow et al (2010) Barlow, M.J. et al., 2010, A&A, 518L, 138
- Cami et al. (2010) Cami, J., van Malderen, R., & Markwick, A.J., 2010, ApJS, 187, 409
- Cherchneff & Lilly (2008) Cherchneff, I. & Lilly, S., 2008, ApJ, 683, L123
- Cherchneff & Dwek (2009) Cherchneff, I. & Dwek, I., 2009, ApJ, 703, 642 Meyer, B. S., 2001, ApJ, 562, 480
- DeLaney et al. (2011) DeLaney, T. A. et al., 2011, ApJ, 725, 2038
- Ennis et al. (2006) Ennis, J., Rudnick, L., Reach, W.T., Smith, J.D., Rho, J., DeLaney, T.D., Gomez, H., Kozasa, T., 2006, ApJ, 652, 376
- Fesen (2001) Fesen, R. A., 2001, ApJS, 133, 161
- Gearhart et al. (1999) Gearhart, R. A., Wheeler, J. C., Swartz, D. A., 1999, ApJ, 510, 944
- Gerardy et al. (2002) Gerardy, C. L., Fesen, R. A., Nomoto, K., Meada, K., Hoflich, P., & Wheeler, J.C., 2002, PASJ, 54, 905
- Goorvitch (1994) Goorvitch, D. 1994, ApJS, 95, 535
- Hwang et al. (2011) Hwang, U. & Laming, J. M., 2011, ApJ, in press
- Kotak et al. (2006) Kotak, R. et al. 2006, ApJ, 651, L117
- Lawson & Hanson (1974) Lawson C.L., Hanson R.J., 1974, Solving least squares problems, Prentice-Hall Series in Automatic Computation, Englewood Cliffs: Prentice-Hall,
- Liu, Dalgarno & Lepp (1992) Liu, W., Dalgarno, A., & Lepp, S., 1992, ApJ, 396, L679
- Liu & Dalgarno (1995) Liu, W., & Dalgarno, A., 1995, ApJ, 454, L472
- Matsuura et al. (2011) Matsuura, M. et al., 2011, Science, 333, 1258
- McLean et al. (2006) McLean, I. S., et al., 2006, SPIE, 6269, 168
- Nozawa et al. (2003) Nozawa, T., Kozasa, T., Umeda, H., Maeda, K., & Nomoto, K., 2003, ApJ, 598, 785
- Ohyama et al. (2007) Ohyama, Y. et al. 2007, PASJ, 59, S411
- Onaka et al. (2007) Onaka, T. et al. 2007, PASJ, 59, S401
- Rho et al. (2008) Rho, J., Kozasa, T., Reach, W.T., Smith, J., Rudnick, L., DeLaney, T., Ennis, J., Gomez, H., Tappe, A., 2008, ApJ, 673, 271
- Rho et al. (2009) Rho, J., Jarrett, T. H., Reach, W. T., Gomez, H., & Andersen, M., 2009, ApJL, 693, L39
- Rho et al. (2010) Rho, J., Gomez, H., Lagage, P.-O., Boogert, A., Reach, W. T., & Dowell, D., 2010, 38th COSPAR Scientific Assembly. July 2010, in Bremen, Germany, E19-0105-10
- Rothman et al. (2009) Rothman, L., et al. 2009, J. Quant. Spectrosc. Radiat. Transfer, 110, 533
- Smith et al. (2009) Smith, J. D. et al. 2009, ApJ, 693, 713 Isensee, K.A 2009, ApJ, 693, 713
- Spyromilio et al. (1988) Spyromilio, J., Meikle, W. P. S., Learner, R.C.M., & Allen, D.A., 1988, Nature, 334, 327
- Spyromilio & Leibundgut (1996) Spyromilio, J., Leibundgut, B., 1996, MNRAS, 283, L89
- Wooden et al. (1993) Wooden, D.H. et al., 1993, ApJS, 88, 477
- Woosley, Heger, & Weaver (2002) Woosley, S. E., Heger, A., & T. A. Weaver, 2001, Reviews of M. Physics, 74, 1015.